HAL Id: hal-02570027
https://hal.archives-ouvertes.fr/hal-02570027
Submitted on 11 May 2020HAL is a multi-disciplinary open access archive for the deposit and dissemination of sci-entific research documents, whether they are pub-lished or not. The documents may come from teaching and research institutions in France or abroad, or from public or private research centers.
L’archive ouverte pluridisciplinaire HAL, est destinée au dépôt et à la diffusion de documents scientifiques de niveau recherche, publiés ou non, émanant des établissements d’enseignement et de recherche français ou étrangers, des laboratoires publics ou privés.
Two-Step Structural Changes in Orange Carotenoid
Protein Photoactivation Revealed by Time-Resolved
Fourier Transform Infrared Spectroscopy
Alberto Mezzetti, Maxime Alexandre, Adrien Thurotte, Adjélé Wilson, Michal
Gwizdala, Diana Kirilovsky
To cite this version:
Alberto Mezzetti, Maxime Alexandre, Adrien Thurotte, Adjélé Wilson, Michal Gwizdala, et al.. Two-Step Structural Changes in Orange Carotenoid Protein Photoactivation Revealed by Time-Resolved Fourier Transform Infrared Spectroscopy. Journal of Physical Chemistry B, American Chemical So-ciety, 2019, 123 (15), pp.3259-3266. �10.1021/acs.jpcb.9b01242�. �hal-02570027�
Two-step Structural Changes in Orange Carotenoid Protein Photoactivation Revealed
by Time Resolved FTIR Spectroscopy
Alberto Mezzetti1,2,*, Maxime Alexandre2, Adrien Thurotte2,3, Adjelé Wilson2, Michal Gwizdala2,4, Diana
Kirilovsky2
1
Laboratoire de Réactivité de Surface, UMR CNRS 7197, Sorbonne Université, Paris, France
2
Institute for Integrative Biology of the Cell (I2BC), CEA, CNRS, Université Sud, Université
Paris-Saclay, 91198 Gif sur Yvette, France
3 Metabolism, Engineering of Microalgal Molecules and Applications (MIMMA) Team, Mer, Molécules,
Santé/Sea, Molecules & Health (EA2160), Département de Biologie et Géosciences, Le Mans Université
Avenue Olivier Messiaen, 72085 Le Mans cedex 9 France
4
Department of Physics, Faculty of Natural and Agricultural Sciences, University of Pretoria, Private bag
X20, Hatfield 0028, South Africa
5
Department of Physics and Astronomy, Faculty of Sciences, VU University, De Boelelaan 1081, 1081 HV
Amsterdam, The Netherlands.
*Corresponding author. [email protected]
ABSTRACT. The Orange Carotenoid Protein (OCP), which is essential in cyanobacterial photoprotection, is
the first photoactive protein containing a carotenoid as an active chromophore. Static and time-resolved
FTIR difference spectroscopy under continuous illumination at different temperatures was applied to
investigate its photoactivation mechanism. Here we demonstrate that in the OCP, the photo-induced
conformational change involves at least two different steps, both in the second timescale at 277 K. Each step
involves partial reorganization of α-helix domains. At early illumination times the disappearance of a
non-solvent exposed α-helix (negative 1651 cm-1 band) is observed. At longer times, a 1644 cm-1 negative band
starts to bleach, showing the disappearance of a solvent-exposed α-helix, either the N-terminal extension or
the C-terminal tail. A kinetic analysis clearly shows that these two events are asynchronous. Minor
modifications in the overall FTIR difference spectra confirm that the global protein conformational change
consists of - at least - two asynchronous contributions. Comparison of spectra recorded in H2O and D2O
Introduction
The Orange Carotenoid Protein (OCP) is a water-soluble carotenoprotein found in cyanobacteria1 . OCP
plays a key role in photoprotection, acting both as a promoting agent of thermal dissipation of excess
excitation energy absorbed by the phycobilisome, the cyanobacterial light harvesting antenna, and as a
scavenger of singlet oxygen2. Most of OCPs (including that from Synechocystis PCC6803 studied in this
work) belong to a big sub-family called OCP1 but recently bioinformatics studies revealed the existence of
at least two other sub-families OCP2 and OCPX presenting slightly different characteristics3. OCP consists
of two discrete domains: an all helical N-terminal domain (NTD), made up of two discontinuous four-helix
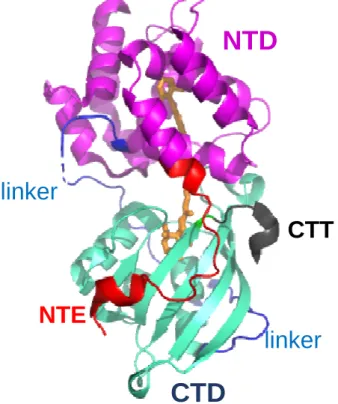
Figure 1. The crystal structure of the Synechocystis PCC 6803 OCP. (Protein Data Bank identifier: 3MG1).
The OCP monomer is shown in the orange closed state. The N-terminal domain (NTD, residues 1–165) is
magenta . The C-terminal domain (CTD, residues 196-315) is light blue-green. The N-terminal extension
(NTE) is represented in red, the C-terminal tail (CTT) in grey and the linker loop in blue. The carotenoid is
represented as orange sticks.
NTD
CTD
CTT
NTE
linker
linker
A linker of 25 amino acids connects the two domain. The carotenoid –3’-hydroxyechinenone (hECN) –
spans the two domains, and is almost entirely embedded in the protein matrix. The keto group of hECN is
hydrogen bonded to the Y201 and W288 of the CTD 4. A salt bridge between the R155 side chain of the
NTD and the E244 side chain of the CTD 4 stabilizes the structure shown in Fig. 1.
When absorbing strong blue-green light the OCP converts from a dark-adapted orange form (OCPO) to a
light-activated red form (OCPR)5. OCPR binds to the phycobilisome and facilitates thermal dissipation of
excess light energy5,6, 7.
In the OCPO to OCPR transition the domains (NTD and CTD) of the protein dissociate; as a result, the OCPR
seems to be more elongated and less hydrophobic than the starting form OCPO 8,9,10,11 . During this
transformation, the carotenoid undergoes a 12 Å translocation, from its original position, spanning the two
domains of OCPO, to a new one, inside the NTD 12. The binding of a keto carotenoid is essential for
photoactivation. Echinenone and canthaxantin binding OCPs are also photoactive 13,14. The overall structure
of NTD and CTD domains do not strongly change upon the OCPO→ OCPR transition, apart the N-terminal extension (NTE) which unfolds8,12, 15 . The quantum yield of the OCPO→ OCPR photoconversion is very low5, and the details of the process have not been clarified. Whereas femtosecond time-resolved UV-Vis
spectroscopy has been used to study the initial events concerning the carotenoid5,16,17,18, these studies were
focusing on changes taking place in the pigment and not in the protein matrix. Recently, the photocycle has
been followed (by time-resolved UV-Vis and fluorescence spectroscopy) at a much larger time scale,
spanning from 100 ns to 10 s9, revealing a red intermediate state OCPRI preceding the red signalling state
OCPR. In addition, a novel orange intermediate state has been identified in the relaxation from OCPR to
OCPO 9.
A recent dynamic crystallography study made possible to look at the early photo-induced changes at an
atomic level15. Bandara et al. proposed that the early photochemical event triggering the photoactivation
takes place in the CTD. More precisely, light induced breakage of hydrogen bonds between Y201 and W288
(both acting as hydrogen bond donors) and the 4-keto group of hECN. Conversely, Gurchiek et al., used
fluorescence spectroscopy to propose that the initial photochemistry takes place in the NTD by a large
Light-induced FTIR difference spectroscopy (DS), especially in the time-resolved mode, is a widely used
technique in order to investigate, the mechanism of photo-induced reactions in proteins at an atomic level
20,21
. Differently from time-resolved single wavelength IR techniques, time-resolved FTIR-DS make it
possible to follow the time evolution of the system simultaneously in a whole spectral region. It has been
applied to dozens of different photo-reactions, including light-induced CO dissociation in heme proteins22,
photosynthetic reaction centers23, light harvesting complexes24 and photoreceptors21.
Also OCP has been the object of light-induced FTIR-DS studies5, 25, mainly in the static mode. A recent
time-resolved IR investigation at several different wavelength aimed to better understand the early steps of
the photoactivation mechanism (between 1 ps and 500 µs)26.
The very low quantum yield of OCP makes flash-induced rapid-scan FTIR DS27 , the most straightforward
time-resolved FTIR DS approach, inconvenient. Furthermore, the very slow recovery time OCPR→ OCPO hampers proper cycle averaging in the induced rapid-scan FTIR mode and makes the other
flash-induced technique, step-scan FTIR DS28, virtually impossible.
Intermediate trapping at low temperature22 and time-resolved FTIR DS under continuous illumination29 are
valid alternative approaches. They allow to put in evidence the presence of several different kinetic
components. We have applied both approaches; the synergic combination of the two resulting particularly
powerful in order to show that the photoactivation mechanism consists of (at least) two asynchronous
Experimental Section
The OCP was isolated from Synechocystis cells overexpressing the OCP gene as described previously6 or
from E. coli cells producing holo-WT and mutant OCPs as described in ref. 14. The construction of OCP
mutants and OCP purification has been reported previously30.
FTIR spectra were recorded in the rapid-scan mode (mirror speed 2,54 cm/s) on a Bruker IFS 88 FTIR
spectrometer equipped with OPUS software and an Oxford instruments N2- flux cryostat. The use of a
cryostat is necessary as previous results from UV-Vis spectroscopy strongly suggest that the photoactivation
mechanism is temperature-dependent25. Furthermore, recording of FTIR difference spectra at temperatures
lower than 298 K has already proven very efficient to put in evidence intermediate states of photoactive
proteins, for instance in phototropin 1 31.
Time-resolved FTIR experiments were performed as follows: after background recording, and switching on
of a blue LED, 500 interferograms were recorded (corresponding to a time interval of ~13 s). Different
recording were performed at increasing times during 6-12 minutes (according to the temperature). At 298 K,
interferograms were also recorded after switching off the LED.
Time-resolved FTIR difference spectra were obtained after Fourier Transform and after subtraction of the
background, as described in ref. 29.
Results
A preliminary step in the present work has been the recording of static FTIR difference spectra after
illumination of the echinenone containing wild-type Synechocystis OCP in H2O and D2O, as well as on a
Figure 2. (A) Static light-minus-dark spectra in H2O (red) and D2O (black). In blue, the calculated double
difference spectrum D2O-minus-H2O is shown. Before subtraction, spectra in H2O and D2O were
normalized using the 1391 (-) cm-1 (common feature to both spectra; by comparison with literature data32,33
most probably an echinenone vibration) as a reference. Spectra were recorded on WT OCP from
Synechocystis.
(B) FTIR difference spectra recorded after illumination for WT OCP from Synechocystis (blue), WT OCP
The molecular details of the light-induced structural reorganization in OCP have already been investigated
by static FTIR DS5 , allowing to pinpoint the differential signals in the amide I band region (1690-1610 cm
-1
), with a broad bleaching in the 1660-1635 cm-1 region, centred at ~1643-1644 cm-1. A subsequent
investigation has shown that in a series of site-directed mutants the signals in the amide I region are
unchanged in frequency, size and shape25.
In Fig. 2A static light-minus-dark FTIR difference spectra on WT OCP in H2O and D2O are shown. The
1644 cm-1 negative band (in H2O) and the 1651 cm-1 negative shoulder are of particular interest as they lie in
the region characteristic of α-helices34. It is worth noticing that the position and the shape of the signals in
H2O are strikingly similar to those observed in the LOV photoreceptor (in that case, 1656 and 1643 cm-1)
and attributed to two α-helices21.
The 1644 cm-1 negative band downshifts to 1639 cm-1 in D2O, whereas no appreciable shift is observed for
the 1651 cm-1 shoulder. A slight downshift (2 cm-1) is observed for the positive 1663 cm-1 band. The 1632
cm-1 negative shoulder (which can be interpreted also as a positive ~1634 cm-1 shoulder) disappears in D2O.
The downshifts upon H/D exchange ensure that the shifting bands are not due to non-exchangeable
molecular moieties, notably the carotenoid backbone or its C=O group. In addition, the shifting bands
provide information on the solvent exposure of the corresponding molecular group, as only solvent-exposed
secondary structure elements will exchange protons. As it will be discussed more in detail later, previous
attribution5 of the 1619 (+) cm-1 band to a β-sheet is to be considered uncertain, as the band neither remains
unchanged (as expected for a non-solvent exposed secondary structure element) nor downshifts its position
(as expected for solvent exposed secondary structure elements).The band instead apparently upshifts to 1624
cm-1 in D2O.
In the whole 1640-1580 cm-1 region the spectral differences between the H2O and the D2O spectra are
difficult to interpret in term of simple H/D substitution in clearly identifiable exchangeable moieties; for
instance the ~1632-34 cm-1 shoulder observed in H2O completely disappears in D2O. Indeed, it should be
kept in mind that in the difference spectra positive and negative features are actually the result of the overlap
of several positive and negative spectral contributions. Some further hints may be derived from the double
band in D2O (1626 cm-1 in the double difference spectrum) may be associated to a “hidden” ~1637 (+) cm-1
band in H2O, which could be responsible for the possible positive shoulder observed at ~1634 cm-1 in the
H2O spectrum.
Fig. 2B shows the light-minus dark FTIR difference spectra obtained on OCPs from WT and ∆2-20 mutant
isolated from E. coli. For comparison, a light-minus dark FTIR difference spectrum obtained on WT isolated
from Synechocystis is included. Whereas the spectra obtained on the two WT OCPs are virtually
indistinguishable, the ∆2-20 mutant shows strong differences compared to them. The most striking feature is
the absence of the negative band at 1644 cm-1, which is the most intense negative band in spectra from WT
OCPs. This strongly suggests that this band can be attributed (at least partially) to the solvent-exposed NTE
α-helix, in agreement with the shift observed in D2O (see Fig. 2A) and with data obtained from other
techniques8 (see “Discussion” section). Another striking spectral difference is the absence of the positive
band at 1619 cm-1 in the mutant (a small positive peak at 1614 cm-1 is observed instead). This strongly
suggests that, in WT OCPs, the disappearance of the solvent-exposed NTE helix – monitored by the
bleaching of the 1644 cm-1 band - is somehow associated with the appearance of the positive 1619 cm-1
band. Other differences include the absence, in the mutant, of the broad negative band at around 1670-1680
cm-1, and of the negative shoulder at ~1632 cm-1 present in WT spectra (a small differential signal at 1635
(+)/1628 (-) cm-1 is observed in the mutant).
Relying on the information gathered from static spectra at 298 K, it is possible to better interpret the changes
observed in static spectra after illumination at lower temperatures. The spectrum recorded at 268 K (upper
trace, Fig. 3A) differ from that recorded at 298 K (lower trace, Fig. 3A), especially in the relative intensity
Figure 3. (A) Middles traces: time resolved FTIR difference spectra recorded during illumination at 277 K,
following the scheme shown in the lower right panel. For comparison, spectra recorded after illumination at
268 K and 298 K are shown at top and at the bottom of the Figure. Spectra were recorded on WT OCP from
Synechocystis at the following times after onset of light: blue, 7 s; light green, 33 s; magenta, 101 s; dark
green, 129 s; yellow, 189 s; brown, 270 s.
(B). Enlarged time-resolved spectra at 277 K showing the evolution of the 1619 (+) cm-1 band. Same timing
as in (A). See text for further details.
(C) Scheme of the experiment under illumination. Background spectra are recorded in the dark and, after
onset of light, at increasing times. Difference spectra are obtained subtracting the background from spectra
At 268 K the two bands have roughly the same amplitude, whereas at 298 K the 1644 cm-1 is definitely more
intense and the 1651 cm-1 appears as a shoulder. Small differences are also present in the 1700-1665 cm-1
region. Spectra recorded after illumination at 275 and 277 K are shown in Fig. S1 in Supplementary
information.
Fig. 3A reports – along with the two static spectra at 298 K and 268 K recorded after illumination– some of
the time-resolved FTIR difference spectra recorded during illumination at 277 K. At this temperature,
differently from 298 K (see Fig S2 in Supplementary Information), a clear evolution in the shape of the
spectra is observed. From the relative intensity of the 1651 (–) cm-1 and 1644 (–) cm-1 bands in the spectra
recorded 7, 33, and 101 s after onset of the light it is possible to deduce that these bands follow a slightly
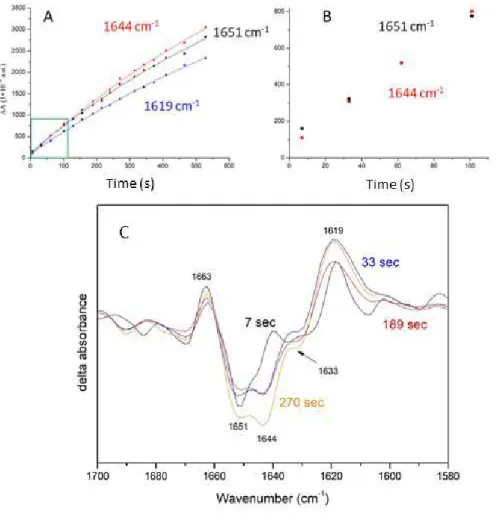
Figure 4. Analysis of time-resolved FTIR spectra at 277 K. (A) Kinetics under illumination at 277 K for key
IR bands. 1619 cm-1, 1644 cm-1, 1651 cm-1. (B) The asynchronicity of the 1644 and 1651 cm-1 bands can be
put in evidence by looking at the time evolution in the 0-100 sec time interval (see also Fig 3) or by
comparison of spectra at different times. (C). FTIR difference spectra recorded during illumination at
different times after light onset. The size of each spectra is adjusted in order to show how the 1619 (+) cm-1
is not associated with any clear negative feature. More precisely, the 7 s spectrum (black) has been enlarged,
so that the size of the 1619 cm-1 positive band is the same of the 1619 cm-1 band of the 189 s (red) spectrum.
Similarly, the 33 s spectrum (blue) has been enlarged so that the 1619 cm-1 positive band is of the same size
as in the 270 s spectrum (yellow). Comparison of spectra recorded 7 s (black) and 189 s (red) after the
beginning of illumination clearly show that the 1644 cm-1 negative band cannot be the dark corresponding of
the 1619 (+) cm-1 band. This is also evident by the comparison of the spectra recorded 33 s (blue) and 270 s
(orange) after the beginning of illumination. Finally, it should be noticed that the shape of the 1619 (+) cm-1
band changes with time (as shown also in Fig. 3B). Notably, in the spectrum recorded 7 s after onset of the
In particular, in the spectrum recorded 7 s after the onset of light shows a 1651 cm-1 band clearly more
intense than the 1644 cm-1 band (see Fig. 3A and Fig. 4B and 4C). This still holds true for the second
spectrum (33 s after the onset of light), whereas in the third one (62 s) the intensity of the two bands is the
same. Starting from the fourth spectrum (101 s) the 1644 cm-1 becomes more intense.
The 1619 (+) cm-1 band seems particularly difficult to interpret as arising from a simple secondary structure
element. Beside the already mentioned apparent upshift (observed at 298 K) upon H/D exchange, its shape
seems to change with time, notably by increasing its width (see Fig. 3B and Fig. 4C). In addition,
comparison of spectra recorded at different times and normalized with respect to the 1619 cm-1 band, show
that no clear negative feature can be directly associated with it, in particular the 1644 cm-1 negative band
(Fig. 4C).
To summarize a) the unusual apparent upshift upon H/D exchange; b) the lack of a clear negative band
associated to it; c) the different growth kinetics compared to those of the 1644 and 1651 cm-1 bands; and d)
the change in its shape during time, show that it is most likely misleading to interpret the 1619 cm-1 band as
due to a simple chemical event. In fact, in the 1690-1610 cm-1 region not only amide I contributions from
different secondary structure elements are expected, but also contributions from echinenone vibrations31,35 ,
notably the C=O 32, from amino acid side chains34, and especially from water bending vibrations36. Indeed, it
is reasonable to assume that H2O molecules rearrange around and possibly inside the protein, and even
participate to localized protonation/deprotonation events; some authors8 have also proposed that internal
water molecules may play a crucial role in the photoactivation mechanism (see “Discussion” section).
Thus, all these elements demonstrates that the previously proposed simple interpretation of the
1619 (+) cm -1 band as an indication of the compaction of the β-sheet domain5 concomitant with a decrease
of α-helices content in the red form of OCP, is most probably an oversimplified model.
It is interesting to compare the first spectrum recorded 7 s after the onset of illumination at 277 K (“early
Figure 5. Comparison between the FTIR difference spectrum recorded after 7 s of illumination (blue trace)
and the static FTIR difference spectrum of the ∆2-20 mutant (black trace). The upper spectrum was recorded
The 1663 (+) / 1651 (-) cm-1 differential feature is essentially identical, both in position and relative
intensity. This strongly suggests that the α-helix responsible of the 1651 cm-1 negative band convert itself in
a secondary structure element responsible of the 1663 (+) cm-1 band, which lie in the spectral region for
turns34. It cannot however be excluded that it remains in a strongly modified α-helix structure (for instance,
by a shortening of the length of the helical part34). The ∆2-20 mutant spectrum shows no intense positive
band at ~1618 cm-1. Conversely, the “early spectrum” at 277 K shows a narrow intense positive band at
1618 cm-1, but interestingly no clear intense negative band can be associated to it in the 1645-1625 cm-1
region. One possibility is that the 1618 (+) cm-1 band reflects, at least in part, the bending of one or more
internal water molecules. Another possibility is that it could arise from a secondary structure element.
Further experiments (e.g. exploring the water stretching region, 3700-3000 cm-137,38, and/or performing
experiments in H2 18O 38,39, and/or at different hydration level39 ) will be required to clarify this issue.
Discussion
In this work, we have used time-resolved FTIR difference spectroscopy under continuous illumination at
different temperatures in order to better characterize the photoactivation mechanism of OCP. As mentioned
in the introduction, the low quantum yield and the long relaxation time of OCPR to the initial OCPO state has
prevented a normal flash-induced time-resolved FTIR investigation, using either the step or the rapid-scan
technique. These approaches would have required the use of a FTIR microscope equipped with a moving
plate40 or other strategies to study slowly reversible photoreactions (ref 41 and refs. therein) as well as a
pulsed laser equipped with an OPO for excitation in the blue. Such instrumentation is – for the time being –
not available in our laboratories. It should also be noticed that a continuous illumination approach better
mimics the condition of OCP under physiological conditions (i.e. under continuous strong solar irradiance).
Recently, a flash-induced time-resolved IR study of OCP in the femtosecond to submillisecond time domain
has been reported26. Konold et al. used a pump-probe approach and were able to record spectra at 30
different wavenumbers (spaced by 6 cm-1). They were able to bypass the problem of the slow relaxation time
min. The spot of the probe was ~150 µm in dimeter. The approach has however some drawbacks, such as
the strict requirement of D2O as a solvent 42.
Interestingly, the results of Konold et al. 26 are in agreement with our results. Whereas they were able to
explore the initial photophysics of the carotenoid, they were also able to follow the bleaching of a
non-solvent exposed α-helix at 1655 cm-1. Within the limits imposed by their spectral resolution, this is
reasonable agreement with the negative band we observed at early times (at later on) at 1651 cm-1 (it should
be recalled that amide I bands arising from non-solvent exposed α-helices do not downshift upon H/D
exchange). Unfortunately, due to technical reasons, they could only explore the time evolution of the system
up to ~500 µs, so they were not able to observe the rise of the 1619 cm-1 band (whose identity is still
unclear, and which probably reflects more than a simple spectral contribution) and the bleaching of the 1644
cm-1 (1638-39 cm-1 in D2O) band, due to a solvent exposed α-helix. It is also interesting to note that Konold
et al. recorded (in D2O and H2O) static light-minus-dark FTIR difference spectra of a mutant OCP lacking
the C-terminal tail (CTT; see also Fig. 1)26. By comparison with the WT OCP, they found that also this
solvent-exposed α-helix absorbs at 1638 cm-1 in D2O and at 1644 cm-1 in H2O, like the NTE
solvent-exposed α-helix. This suggests that the band at 1644 cm-1 that bleaches with a slower kinetics in our
experiments may also, in part or totally, arise from the CTT part of the protein, and not only from the NTE.
It is useful to compare our results with those obtained from other techniques. Gupta et al.8 have shown that
the OCPO→ OCPR photoconversion involves complete dissociation of CTD and NTD. They proposed that the alteration of the OCP secondary structure was confined only to the NTE of the OCP. Our results
demonstrate that this is an over-simplified picture, as time-resolved FTIR shows that two different signals
involving α-helix disappearance (with different kinetics) are present. From our results and those of Konold et al.26, it is clear that protein changes involving at least one non-solvent exposed alpha helix occurs before
opening of the protein and changes in the NTE and CTT. Amino acids in the helices C, E and G (reference is
made to the nomenclature used in ref. 4, where helices are named progressively A, B, C… starting from the
N-term) are not in the same position in the NTD of OCPo and the isolated red holo-NTD suggesting
movement and rotation of these helices during the photoactivation8,26. Also the translocation of the
the CTD in OCPR lacking the carotenoid was still not resolved. However, comparison of the CTD in OCP
with an holo-CTDH suggest that in the CTD the mayor change is related to the movement of the CTT.
Nevertheless, small changes (smaller than those observed in the NTD) in the position of two α-helices including the one carrying the Tyr 201 can be observed 43. These changes could be related to the empty
carotenoid binding pocket or to differences in primary sequence between the CTD and the CTDH. Our
results do not allow us to decide if the changes on the non-solvent exposed a helix occurs in the NTD or the
CTD. Konold et al.26 , based on their results, proposed that these changes occur in the NTD since they occur
in the 0.5-1 µs while the breakage of the H-bonds between the carotenoid and the CTD occurs in ps. This
leads to a second intermediary carotenoid state in 50 ns. In this intermediary state the carotenoid was not
translocated but slightly moves away from Tyr 201 and Trp288. This slight movement breaks the π-π stacking interactions between the β2-ring of the carotenoid and Tyr44 and W110 in the NTD triggering the
changes in the α-helices in the NTD26.
Our FTIR spectra show also strong spectral changes in the 1690-1610 cm-1 region, which, as already
underlined, cannot be interpreted as simple secondary structure changes. Likely spectral contributors are
bending of H2O molecules. Gupta et al.8 put forward the hypothesis that the signal propagation for the
protein conformational change “occurs from the light-activated carotenoid to the protein surface via internal
hydrogen bonding networks and involves bound water molecules”. Our results – showing likely
light-induced response of (a) water molecule(s) signal, are consistent with this hypothesis.
Putting together all the pieces of information from different techniques, a working hypothesis can be put
forward. Assuming that the 1644 cm-1 band is due (at least partially) to the NTE α-helix, and that the 1651
cm-1 band arise from a non-solvent exposed α-helix, we can interpret the time-resolved data at 277 K under
illumination as follows. At early times, a 1651 cm-1 band, due to partial unfolding or modification of a
non-solvent exposed α-helix of the OCP (most probably in the NTD) appears. Later, the NTE and/or the CTT
(responsible for the 1644 cm-1 band) unfold (or modify their structure) with a slower kinetics than the helix
corresponding to the 1651 cm-1 band. It should be noticed that temperature has a stronger slowing effect for
the 1644 cm-1 band than for the 1651 cm-1 band.
viscosity of water does not hamper significantly fast α-helix unfolding for the NTE. At 277 K the higher
viscosity of water becomes a problem and hampers fast unfolding of the NTE α-helix. At 268 K the
unfolding is even completely blocked at half-way. This effect does not affect the 1651 cm-1 band and the
corresponding α-helix, as this is not solvent-exposed.
Conclusions
Time-resolved FTIR difference spectroscopy under continuous illumination was successfully applied to
investigate the photoactivation mechanism of OCP. The photo-induced conformational change involves at
least two different steps, both in the second timescale at 277 K. The first step involves partial reorganization
of non-solvent exposed α-helix , whereas the second step involves a solvent-exposed α-helix. A positive
band at ~1619 cm-1 (whose identity is still unclear) is also present at early times under illumination at 277 K.
An analysis of difference spectra recorded in H2O and D2O has shown that most probably several spectral
contributions are superimposed in the 1600-1640 cm-1 region, suggesting also that water molecules may play
a key role in the photoactivation mechanism.
Supporting Information
Static FTIR difference spectra after illumination at different temperatures; time-resolved FTIR difference
spectra under illumination at 298 K.
Acknowledgements
This work was supported by grants from the Agence Nationale de la Recherche (ANR projects
CYANOPROTECT (ANR-11-BSV8-0003) and RECYFUEL (ANR-16-CE05-0026)). The research was also
supported by the Centre National de la Recherche Scientifique (CNRS) and the Commissariat à l’Energie
11–IDEX–0003–02). The salary of MG was financed by HARVEST EU FP7 Marie Curie Research
Training Network.
MG acknowledges the funding from European Molecular Biology Organisation (EMBO) via Long-Term
References
(1) Wu, Y.P.; Krogmann D.W. The Orange Carotenoid Protein of Synechocistis PCC 6803. Biochim.
Biophys. Acta – Bioenergetics 1997, 1322, 1-7.
(2) Kirilovsky, D.; Kerfeld, CA; Cyanobacterial Photoprotection by the Orange Carotenoid Protein, Nat.
Plants 2016, 2, 16180.
(3) Bao, H; Melnicki, M.R.; Pawlowski, E.G.; Sutter, M.; Agostoni, M.; Lechno-Yossef, S.; Cai, F., Montgomery, B.L.; Kerfeld, C.A. Additional Families of Orange Carotenoid Proteins in the
Photoproctective System of Cyanobacteria, Nat. Plants, 2017, 3, 17089
(4) Kerfeld C.A.; Sawaya M.R.; Brahmandam, V.; Cascio, D.; Ho, K.K.; Trevithick-Sutton, C.C.;
Krogmann, D.W.; Yeates, T.O. The Crystal Structure of a Cyanobacterial Water-soluble Carotenoid Binding Protein. Structure 2003, 11, 55-65.
(5) Wilson, A.; Punginelli, C.; Gall, A.; Bonetti, C.; Alexandre, M.; Routaboul, J.M.; Kerfeld, C.A.; van Grondelle, R.; Robert, B.; Kennis, J.T.; Kirilovsky D. A Photoactive Carotenoid Protein Acting as Light Intensity Sensor. Proc. Natl. Acad. Sci. U.S.A. 2008, 105, 12075-12080.
(6) Gwizdala, M.; Wilson, A.; Kirilovsky D. In Vitro Reconstitution of the Cyanobacterial Photoprotective Mechanism Mediated by the Orange Carotenoid Protein in Synechocystis PCC 6803. Plant Cell, 2011, 23, 2631-2643.
(7) Gwidzala, M.; Botha, J.L.; Wilson, A.; Kirilovsky, D.; van Grondelle, R.; Krüger, T.P.J. Switching an Individual Phycobilisome Off and On. J. Phys. Chem. Lett., 2018, 9, 2426–2432.
(8) Gupta, S; Guttman, M.; Leverenz, R.L.; , Zhumadilova, K.; Pawlowski, E.G.; Petzold, C.J.; Lee, K.K.; Ralston, C.Y.; Kerfeld, C.A. Local and Global Structural Drivers for the Photoactivation of the Orange Carotenoid Protein, Proc. Natl. Acad. Sci. U.S.A. 2015, 112, E5567-5574.
(9) Maksimov, E.G.; Sluchanko, N.N.; Slonimskiy, Y.B.; Slutskaya, E.A.; Stepanov, A.V.; Argentova-Stevens, A.M.; Shirshin E.A.; Tsoraev, G.V.; Klementiev, K.E.; Slatinskaya, O.V. et al. The Photocycle of Orange Carotenoid Protein Conceals Distinct Intermediates and Asynchronous Changes in
the Carotenoid and Protein Components. Sci. Rep. 2017, 7, 15548.
(10) Maksimov, E.G.; Sluchanko, N.N.; Mironov, K.S.; Shirshin, E.A.; Klementiev, K.E.; Tsoraev, G.V.; Moldenhauer, M.; Friedrich, T.; Los, D.A.; Allakhverdiev, S.I.; Paschenko, V.Z.; Rubin, A.B.; Fluorescent Labeling Preserving OCP Photoactivity Reveals its Reorganization During the Photocycle, Biophys. J. 2017,
(11) Maksimov, E.G.; Moldenhauer, M.; Shirshin, E.A.; Parshina, E.A.; Sluchanko, N.N.; Klementiev, K.E.; Tsoraev, G.V.; Tavraz, N.N.; Willoweit, M.; Schmitt, F.J.; et al. A Comparative Study of Three Signaling Forms of the Orange Carotenoid Protein, Photosynth. Res. 2016, 130, 389-401.
(12) Leverenz, R.L.; Sutter, M.; Wilson, A.; Gupta, S.; Thurotte, A.; Bourcier de Carbon, C.; Petzold, C.J.; Ralston, C.; Perreau, F.; Kirilovsky, D.; Kerfeld, C.A.; A 12 Å Carotenoid Translocation in a Photoswitch Associated with Cyanobacterial Photoprotection. Science. 2015, 348, 1463-1466.
(13) Punginelli, C.; Wilson, A.; Routaboul, J.M.; Kirilovsky, D. Influence of Zeaxanthin and Echinenone Binding on the Activity of the Orange Carotenoid Protein Biochim Biophys Acta - Bioenergetics 2009, 1787, 280-288.
(14) Bourcier de Carbon, C. ; Thurotte, A. ; Wilson, A. ; Perreau, F. ; Kirilovsky, D. Biosynthesis of Soluble Carotenoid Holoproteins in Escherichia coli. Sci Rep. 2015 5, 9085.
(15) Bandara, S.; Ren, Z.; Lu, L.; Zeng, X.; Shin, H.; Zhao, K.H.; Yang, X. Photoactivation Mechanism of a Carotenoid-based Photoreceptor. Proc. Natl. Acad. Sci. U S A. 2017 114, 6286-6291.
(16) Slouf, V.; Kuznetsova, V.; Fuciman, M.; Bourcier de Carbon, C.; Wilson, A. ; Kirilovsky, D. ; Polivka, T. Ultrafast Spectroscopy Tracks Carotenoid Configurations in the Orange and Red Carotenoid Proteins from Cyanobacteria Photosynth. Res. 2017, 131, 105-117.
(17) Berera, R.; Gwizdala, M.; van Stokkum, I.H.; Kirilovsky, D.; van Grondelle, R.;Excited States of the Inactive and Active Forms of the Orange Carotenoid Protein. J. Phys. Chem. B. 2013, 117, 9121-9128.
(18) Berera, R.; van Stokkum, I.H.; Gwizdala, M.; Wilson, A.; Kirilovsky, D.; van Grondelle, R.;The
Photophysics of the Orange Carotenoid Protein: a Light-powered Molecular Switch. J. Phys. Chem. B. 2012,
116, 2568-2574.
(19) Gurchiek, J.K.; Bao, H.; Domínguez-Martín, M.A.; McGovern, S.E.; Marquardt, C.E.; Roscioli, J.D.; Ghosh, S.; Kerfeld, C.A.; Beck, W.F.; Fluorescence and Excited-State Conformational Dynamics of the Orange Carotenoid Protein, J. Phys. Chem. B. 2018, 122, 1792-1800.
(20) Kötting, C.; Gerwert, K; Proteins in Action Monitored by Time-resolved FTIR Spectroscopy.
Chemphyschem. 2005, 6, 881-888.
(21) Kottke, T; Lorenz-Fonfrie, V.A.; Heberle, J., The Grateful Infrared. Sequential Protein Changes Resolved by Infrared Difference Spectroscopy. J. Phys. Chem. B. 2017, 121, 335-350.
(22) Nienhaus, K.; Nienhaus G.U. Ligand Dynamics in Heme Protein Observed by Fourier Transform Infrared Spectroscopy at Cryogenic Temperatures. Methods Enzymol. 2008, 437, 347-378.
(23) Mezzetti A, Leibl W. Time-resolved Infrared Spectroscopy in the Study of Photosynthetic Systems.
Photosynth. Res. 2017, 131, 121-144.
(24) Mezzetti A. Light-Induced Infrared Difference Spectroscopy in the Investigation of Light Harvesting Complexes. Molecules. 2015, 20, 12229-12249
(25) Wilson, A.; Gwizdala, M.; Mezzetti, A.; Alexandre, M.; Kerfeld, C.A.; Kirilovsky, D. The Essential Role of the N-terminal Domain of the Orange Carotenoid Protein in Cyanobacterial Photoprotection: Importance of a Positive Charge for Phycobilisome Binding. Plant Cell 2012, 24, 1972-1983.
(26) Konold, P.E.; van Stokkum, I.H.M.; Muzzopappa, F.; Wilson, A.; Groot, M.-L.; Kirilovsky, D.; Kennis, J.T.M. Photoactivation Mechanism, Timing of Protein Secondary Structure Dynamics and Carotenoid Translocation in the Orange Carotenoid Protein ,J. Am. Chem. Soc. 2019, 141, 520-530.
(27) Mezzetti A, Nabedryk E, Breton J, Okamura MY, Paddock ML, Giacometti G, Leibl W. Rapid-scan Fourier Transform Infrared Spectroscopy Shows Coupling of Glu-L212 Protonation and Electron Transfer to QB in Rhodobacter sphaeroides Reaction Centers. Biochim Biophys Acta- Bioenergetics 2002, 1553,
320-330.
(28) Uhmann, W.; Becker, A.; Taran, C.; Siebert, F. Time-Resolved FT-IR Absorption Spectroscopy Using a Step-Scan Interferometer, Appl. Spectr. 1991, 45, 390-397.
(29) Mezzetti, A.; Leibl, W.; Breton, J.; Nabedryk, E.; Photoreduction of the Quinone Pool in the Bacterial Photosynthetic Membrane: Identification of Infrared Marker Bands for Quinol Formation. FEBS Lett. 2003,
537, 161-165.
(30) Thurotte, A.; Lopez-Igual, R.; Wilson, A.; Comolet, L.; Bourcier de Carbon, C.; Xiao, F.; Kirilovsky, D.; Regulation of Orange Carotenoid Protein Activity in Cyanobacterial Photoprotection. Plant Physiol.
2015, 169, 737-747.
(31) Alexandre, M.T.A.; van Grondelle, R.; Hellingwerf, K.J. ; Kennis, J.T.M. Conformational Heterogeneity and Propagation of Structural Changes in the LOV2/Jα Domain from Avena sativa
Phototropin 1 as Recorded by Temperature-Dependent FTIR Spectroscopy, Biophys. J. 2009, 97, 238-247.
(32) Aasen, J.A.; Liaaen-Jensen, S. “Carotenoids of flexibacteria. III. The Structures of Flexixanthin and Deoxyfelixanthin”, Acta Chem. Scand. 1966, 20, 1970-1988.
(33) Fujisawa, T.; Leverenz, R.L.; Nagamine, M.; Kerfeld, C.A.; Unno, M.; Raman Optical Activity Reveals Carotenoid Photoactivation Events in the Orange Carotenoid Protein in Solution. J. Am. Chem. Soc. 2017,
139, 10456-10460.
(35) Kish, E: Mendes Pinto, M.M.; Kirilovsky, D.; Spezia, R.; Robert, B. Echinenone Vibrational
Properties: From Solvents to the Orange Carotenoid Protein. Biochim. Biophys. Acta – Bioenergetics 2015,
1847, 1044-1054.
(36) Vanderkooi, J.M; Dashnau, J.L.;Zelent, B. Temperature Excursion Infrared (TEIR) Spectroscopy Used to Study Hydrogen Bonding between Water and Molecules, Biochim. Biophys. Acta – Protein Proteomics
2005, 1749, 214-233.
(37) Noguchi, T. Fourier Transform Infrared Analysis of the Photosynthetic Oxygen-evolving Center,
Coord. Chem. Rev. 2008, 252, 336-346.
(38) Maréchal, A.; Rich, P.R. Water Molecule Reorganization in Cytochrome c Oxidase Revealed by FTIR Spectroscopy Proc. Natl. Acad. Sci. U. S. A. 2011 108, 8634-8638.
(39) Malferrari, M.; Mezzetti, A.; Francia, F.; Venturoli, G. Effects of Dehydration on Light-induced Conformational Changes in Bacterial Photosynthetic Reaction Centers Probed by Optical and Differential FTIR Spectroscopy. Biochim. Biophys. Acta – Bioenergetics 2013, 1827, 328-339.
(40) Rammelsberg,, R.; Boulas, S.; Chorongiewski, H.; Gerwert, K. Set-up for Time-resolved Step-scan FTIR Spectroscopy of Noncyclic Reactions Vib. Spectr. 1999, 19, 143-149.
(41) Schleeger, M.; Wagner, C.; Vellekop, M.J., Lendl, B.; Heberle, J. Time-resolved Flow-flash FT-IR Difference Spectroscopy: the Kinetics of CO Photodissociation from Myoglobin Revisited. Anal. Bioanal.
Chem. 2009, 394, 1869-1877.
(42) Groot, M.L.; van Wilderen, L.J.; Di Donato, M. Time-resolved Methods in Biophysics. 5. Femtosecond
Time-resolved and Dispersed Infrared Spectroscopy on Proteins. Photochem Photobiol Sci. 2007, 6,
501-507.
(43) Harris, D.; Wilson, A.; Muzzopappa, F.; Sluchanko, N.N.; Friedrich, T.; Maksimov, E.G.; Kirilovsky,
D.; Adir, N. Structural Rearrangements in the C-terminal Domain Homolog of Orange Carotenoid Protein
are Crucial for Carotenoid Transfer. Commun Biol. 2018 1, 125.