HAL Id: hal-03007985
https://hal.archives-ouvertes.fr/hal-03007985
Submitted on 16 Nov 2020
HAL is a multi-disciplinary open access
archive for the deposit and dissemination of
sci-entific research documents, whether they are
pub-lished or not. The documents may come from
teaching and research institutions in France or
abroad, or from public or private research centers.
L’archive ouverte pluridisciplinaire HAL, est
destinée au dépôt et à la diffusion de documents
scientifiques de niveau recherche, publiés ou non,
émanant des établissements d’enseignement et de
recherche français ou étrangers, des laboratoires
publics ou privés.
Infrared Complex Refractive Index of N-containing
astrophysical ices free of water processed by cosmic-ray
simulated in laboratory
W.R.M. Rocha, S. Pilling, A. Domaracka, H. Rothard, P. Boduch
To cite this version:
W.R.M. Rocha, S. Pilling, A. Domaracka, H. Rothard, P. Boduch. Infrared Complex Refractive
Index of N-containing astrophysical ices free of water processed by cosmic-ray simulated in laboratory.
Spectrochimica Acta Part A: Molecular and Biomolecular Spectroscopy, Elsevier, 2020, 228, pp.117826.
�10.1016/j.saa.2019.117826�. �hal-03007985�
Graphical Abstract
Infrared Complex Refractive Index of N-containing astrophysical ices free of water processed by
cosmic-ray simulated in laboratory
W. R. M. Rocha,S. Pilling,A. Domaracka,H. Rothard,P. Boduch
Ice-covered interstelar grain E.g.: N2, CO, NH3
Bombarded ice (dirty ice) E.g.: CH3CN, CH3CH2OH, OCN-, NH 4+
Co
smic
rays
Astrophysical Scenario: N-containing ices
Molecular Cloud environment
Bare insterstellar grain Ads
orp tion
!
"
#= %
#+ '(
#"
!
)= %
)+ '(
) Refractive index modificationHighlights
Infrared Complex Refractive Index of N-containing astrophysical ices free of water processed by
cosmic-ray simulated in laboratory
W. R. M. Rocha,S. Pilling,A. Domaracka,H. Rothard,P. Boduch
• Complex refractive index is key parameters in radiative transfer models of dusty media • The dataset provided in this paper reduces the lack of data for the astrochemical community
• In general, the refractive index modification triggered by cormic-ray bomabardment, leads to an albedo decreasing in the infrared.
Infrared Complex Refractive Index of N-containing astrophysical ices
free of water processed by cosmic-ray simulated in laboratory
W. R. M.
Rocha
a,∗,1,
S.
Pilling
a,b,
A.
Domaracka
c,
H.
Rothard
cand
P.
Boduch
caUniversidade do Vale do Paraíba (UNIVAP), Laboratório de Astroquímica e Astrobiologia (LASA), Av. Shishima Hifumi, 2911, Urbanova, CEP: 12244000, São José dos Campos, SP, Brazil
bDepartamento de Física, Instituto Tecnólogico de Aeronáutica, ITA - DCTA, Vila das Acácias, São José dos Campos, 12228-900 SP, Brazil
cCentre de Recherche sur les Ions, les Matériaux et la Photonique, Normandie Univ, ENSICAEN, UNICAEN, CEA, CNRS, CIMAP, 14000 Caen, France
A R T I C L E I N F O Keywords:
Complex refractive index Kramers-Kronig Thin films cosmic rays astrophysical ices mid-IR albedo A B S T R A C T
Several nitrogen containing species has been unambiguously identified in the Solar System and in the Interstellar Medium. It is believed that such rich inventory of species is a result of the energetic processing of astrophysical ices during all stages of the protostellar evolution. An intrinsic parame-ter of matparame-ter, the complex refractive index, stores all the "chemical memory" triggered by energetic processing, and therefore might be used to probe ice observations in the infrared. In this study, four N-containing ices have been condensed in ultra-high vacuum chamber and processed by heavy ions (O and Ni) with energies between 0.2 and 15.7 MeV at the Grand Accélérateur National d’Ions Lourds (GANIL), in Caen, France. All chemical changes were monitored in situ by a Infrared Absorption Spectroscopy. The complex refractive index was calculated directly from the absorbance spectrum, by using the Lambert-Beer and Kramers-Kroning relations. The values containing the values will be available in a online database: https://www1.univap.br/gaa/nkabs-database/data.htm. As result, other than the database, it was observed that non-polar ices are more destroyed by sputtering than polar ones. Such destruction and chemical evolution leads to variation in the IR albedo of samples addressed in this paper.
1. Introduction
Astrophysical ices consist of frozen molecules in extrater-restrial environments inside the Solar System and beyond. Regarding to the early stages of Young Stellar Objects (YSOs), H2O is the major contributor to the entire inventory of ices
in Space[1,2]. Ammonia (NH3), on the other hand, is the
fourth most abundant molecular specie in the solid phase as also pointed out by Öberg et al.[1].
Inside our Solar System, N-containing environments were identified in several places, such as the Saturn’s moons (e.g. Titan, Iapetus, Triton), Pluto, and Ultima Thule[3,4]. All these objects have in common a dark/red coloration that have been attributed to “tholins”, namely, extended heterogeneous aromatic and aliphatic species with various degrees of nitro-gen incorporation. They are synthesized when simple molecules containing, N, C, H or O are energetically processed by ion-izing agents, such as ultraviolet (UV) and cosmic rays (CRs). Due to their extensive molecular conjugation, the tholins are known by their low albedo. Other than these peculiar mate-rial, simple nitrogen bearing molecules, such as N2has been
identified in the coma of comet 67P/Churyumov-Gerasimenko, after analysis carried out by the ROSINA (Rosetta’s Orbiter Spectrometer for Ion and Neutral Analysis) mass spectrom-eter on board the Rosetta spacecraft [5].
From a physical chemistry perspective, nitrogen exists both in reactive (e.g. N2O, NO−3, NO−2, NH3, NH+4) and
∗Principal corresponding author
will.rocha@nbi.ku.dk(W.R.M. Rocha) ORCID(s):0000-0001-6144-4113(W.R.M. Rocha)
1Current address: Niels Bohr Institute Centre for Star and Planet
For-mation, University of Copenhagen, Øster Voldgade 5-7, DK-1350 Copen-hagen K., Denmark
non-reactive form (N2), giving its strongest triple molecular
bond (N N). Laboratory experiments have shown[6,7,
8,9,10,11,12,13], however, that energetic processing of N2-containing ices opens several channels for new
chemi-cal reactions, allowing the formation of N-reactive species. In addition, ⋅NO radicals have been considered an impor-tant precursor of prebiotic molecules, and therefore might be linked to the origin of life on earth as discussed in [14,15]. Apart of the chemical interest in N-containing ices, the complex refractive index (henceforth called CRI) is an im-portant parameter, as it determines how the material inter-acts with electromagnetic radiation. In addition, it records the chemical variation triggered by the ionizing radiation such as UV, X-rays and Cosmic-rays[16,17,18,19,20,21]. On this subject, the aim of this paper is not to provide a de-tailed description of the chemical synthesis after ion bom-bardment of the ices, but instead, to provide a new CRI database, calculated from different N-containing ice samples, and con-tribute to reduce the huge lack of this kind of data in the astronomical community. Moreover, the data provided will be useful in astrophysical modelling of mid-IR spectrum of ices, as well as some clue about the role of polarization level in the ice destruction by radiation.
This papers is structured as follows: section 2 described the laboratory experiments, and the methodology employed to calculate the ice thickness and the complex refractive in-dex of the samples probed in this work. Sections 3 and 4 show the results and astrophysical implications focusing on the role of polarity and albedo of irradiated ices. The con-clusions are summarized in section 5.
Table 1
N-containing samples addressed in this paper. Non-irradiated species are labelled “a”, whereas the letters “b” and “c” refer to the first and second level of irradiation. The samples identification, thickness, and relative destruction are shown in columns 2, 3 and 4, respectively. The laboratory conditions under which the experiments were performed are shown in the columns 5-7.
Label Samples d (𝜇m) Δ𝑑∕𝑑 Temp. (K) Energy/Projectile Fluence (1010 ions cm−2) Reference
N1a N2:CO (1:1) 0.7 ± 0.1 0.0 14 - 0 -N1b N2:CO 0.7 ± 0.1 0.0 14 5.8 MeV16O2+ 120 -N1c N2:CO 0.5 ± 0.1 35.6 ± 1.2 14 5.8 MeV16O2+ 1000 -N2a N2:CH4 (19:1) 11.3 ± 1.0 0.0 19 - 0 [53] N2b N2:CH4 11.2 ± 0.7 2.8 ± 0.8 19 15.7 MeV16O5+ 1000 [53] N2c N2:CH4 10.5 ± 0.4 16.1 ± 1.4 19 15.7 MeV16O5+ 6000 [53] N3a NH3:CO (1:1) 0.8 ± 0.2 0.0 14 - 0 -N3b NH3:CO 0.8 ± 0.2 0.0 14 5.8 MeV16O2+ 120 -N3c NH3:CO 0.6 ± 0.1 20.0 ± 1.7 14 5.8 MeV16O2+ 1000 -N4a NH3:CH3OH (1:1) 4.4 ± 0.4 0.0 14 - 0 -N4b NH3:CH3OH 4.4 ± 0.4 0.0 14 0.2 MeV Ni24+ 100 -N4c NH3:CH3OH 4.2 ± 0.3 4.6 ± 0.3 14 0.2 MeV Ni24+ 1000
-Note: Initial samples according to polarity: N1a [Non-Polar:Non-Polar], N2a [Non-Polar:Non-Polar], N3a [Polar:Non-Polar] , N4a [Polar:Polar]
2. Methodology
In this work we employ a Lambert-Beer and Kramers-Kronig based code[22] in four sets of infrared spectra of N-containing peculiar astrophysical ice analogs (virgin and ir-radiated) obtained in the lab to determined their complex re-fractive index.
2.1. Laboratory experiments
The experiment simulating bombardment of cosmic rays and energetic particles on four peculiar N-containing ices was performed by using the high-vacuum chamber mounted at the IRRSUD (IR Radiation SUD) beamline at the Grand Accelerateur National d’Ions Lourds (GANIL) located in Caen, France. Briefly, the incoming ions impinge perpendicularly the solid samples, previously produced from gas mixture and deposited over a ZnSe substrate coupled to the helium closed-cycle cryostat inside the vacuum chamber. In-situ Fourier-transformed infrared (FTIR) spectra of the sample were recorded before irradiation and at different ion fluences, using a Nico-let FTIR spectrometer (Magna 550). The ion flux was around 7 × 109cm−2s−1. During the experiments, the chamber pres-sure was roughly 2 × 10⁻⁸mbar. More details of the
exper-imental set up is given in Vasconcelos et al.[12] and Pilling et al.[23].
This work presents data from 4 different experiments: 1) N2:CO (1:1) ice at 14 K irradiated by 5.8 MeV O2+, 2)
N2:CH4(19:1) ice at 19 K irradiated by 15.7 MeV O5+, 3)
NH3:CO(1:1) ice at 14 K irradiated by 5.8 MeV O2+and, 4)
NH3:CH3OH (1:1) at 14K irradiated by 0.2 MeV Ni24+. The
absorbance infrared spectra of these ice mixtures are shown in Figure1, and some assignments taken from [24] and [12] are indicated. Table1presents additional parameters of the addressed N-containing samples.
2.2. Initial ice thickness
The thickness of the samples listed in Table1before the irradiation was analytically calculated using the equations below: 𝑑(𝜇m) = [ 𝑁 𝜌 𝑀 𝑁𝐴 ] × 104 (1a) 𝑁(cm−2) = 2.3 𝐴 𝜈2 ∫ 𝜈1 𝐴𝑏𝑠𝜈𝑑𝜈 (1b)
where 𝑁 is the column density (cm−2), 𝜌 the specific
den-sity (g cm−3), 𝑀 the molar mass, 𝑁
𝐴Avogrados’s number,
𝐴the band strength of the of molecular bond and Abs𝜈 the
measured absorbance in the infrared spectral range. For the N2:CO mixture, the band centered at 2139 cm−1
(∼ 4.67 𝜇m) corresponding to C-O stretching mode, was used to calculate the initial thickness. The band strength (1.1 × 10⁻¹⁷cm molecule−1) and density (0.8 g cm−3) was
taken from Hudgins et al.[16] and Luna et al.[19], respec-tively. As N2has no active vibrational mode in IR, the
thick-ness relative to nitrogen was assumed to be the same as that of CO.
In the case of N2:CH4 sample, the combination mode
𝜈1+ 𝜈4of CH4 was used to calculate the initial thickness.
The band strength and density for this mixture were taken
from Bouilloud et al. [25], respectively, as 3.5 × 10⁻¹⁹cm molecule−1
and 0.45 g cm−3.
The initial thickness of NH3:CO, was calculated from the
bands centered at 1070 cm−1 (∼ 9.35 𝜇m) relative to NH 3
(𝜈2) and 2139 cm−1(∼ 4.67 𝜇m) belonging to CO. The
den-sity and band strength used in this calculation for NH3was,
respectively, 0.7 g cm−3and 1.7 × 10⁻¹⁷cm molecule−1, as
taken from Giuliano et al. [26], whereas for CO, the param-eters of Section 2.2.1 have been used.
N-containing astrophysical ices 600 1200 1800 2400 3000 3600 4200 4800 0.00 0.02 0.04 0.06 0.08 0.10
Ab
so
rb
an
ce
+
of
fse
t
CO 2 N2 O N O2 N3 NO CO O C N N2 O CO2 CO2*
*
F0: 0 ions/cm2 F1: 1012 ions/cm2 F2: 1013 ions/cm2 a) N2:CO (1:1) at 14 K 600 1200 1800 2400 3000 3600 4200 4800 0.0 0.1 0.2 0.3 0.4 0.5Ab
so
rb
an
ce
+
of
fse
t
CH2 6 C2 H4 N H3 CH4 C2 H6*
N3 C H2 N2 N2 CH4 CH4 CH4 HCN C2 H2 N H3 HNC*
*
CH4 CH4 F0: 0 ions/cm2 F1: 1010 ions/cm2 F2: 1011 ions/cm2 b) N2:CH4 (19:1) at 19 K 600 1200 1800 2400 3000 3600 4200 4800 0.00 0.05 0.10 0.15 0.20 0.25 0.30 0.35Ab
so
rb
an
ce
+
of
fse
t
C O2 C O2 OC N CO H2 C O C H3 N H3 NH3 N3 F0: 0 ions/cm2 F1: 1012 ions/cm2 F2: 1013 ions/cm2 c) NH3:CO (1:1) at 14 K 600 1200 1800 2400 3000 3600 4200 4800Wavenumber(cm
1)
0.0 0.5 1.0 1.5 2.0 2.5Ab
so
rb
an
ce
+
of
fse
t
C O2 O C N CO Aldehydes Amides C O O H2 C O C H4 C H3 O H C H3 O H C H3 O H (T M TH +) C H3 O H (C H4 ) C H3 O H (C H4 ) HCN C2 H2 N H3 C H2 O H P O M F0: 0 ions/cm2 F1: 1012 ions/cm2 F2: 1013 ions/cm2 d) NH3:CH3OH (1:1) at 14 KFigure 1: Absorbance infrared spectra of the four ice mixtures addressed in this paper. In order to assure a better readability, an arbitrary offset has been applied. The colours black, blue and red refer to the different fluences used in each experiment. Some vibrational modes associated to the bands are indicated by the vertical dashed grey line and their assignments is shown, as taken from [12,24]. In the panel d, some bands are associated to different functional groups of molecules in literature, and are indicated by the chemical formula inside the parenthesis.
𝜈4, 𝜈5, 𝜈6and 𝜈7at 1461 cm−1(∼ 6.84 𝜇m) of CH3OH, has
been used to calculate the methanol thickness in this sample. As described in Giuliano et al.[26], the band strength and density of methanol ice are, respectively, 1.2 × 10⁻¹⁷cm molecule−1
and 1.02 g cm−3. For the ammonia thickness, the
parame-ters described in the above paragraph were used.
2.3. Thickness variation
During the ice irradiation by heavy ions, the sample thick-ness decreases due to compaction and sputtering as widely
discussed in literature [27,28,29,30].
In this paper, the compaction and sputtering model in-troduced in Dartois et al.[30], has been applied to estimate the sputtering yield (𝑌𝑆) for each experiment. Briefly, the model assumes that if a chemical species is radiolytically re-sistant, their column density evolution at each fluence (𝐹 ) can be modelled by the following equation:
𝑁(𝐹 ) = 𝑁𝐷× ln ⎛ ⎜ ⎜ ⎜ ⎝ e −𝑌 ∞𝑆𝐹 𝑁𝐷 +ln ( e 𝑁0 𝑁𝐷−1 ) + 1 ⎞ ⎟ ⎟ ⎟ ⎠ , (2)
where 𝑁𝐷 is the ice column density where the sputtering effect ends, and 𝑁0is the initial column density. The term
𝑌𝑆∞ is the sputtering yield at an asymptotic regime,
calcu-lated from: 𝑌𝑆(𝑁) = 𝑌𝑆∞ ( 1 − e− 𝑁 𝑁𝐷 ) (3) It is worth to note, however, that a radiolytically resilience property do not belong to all chemical species, and therefore, the Equation2applied to these situation, provides the upper limit for 𝑌∞
𝑆 .
The compaction effect, on the other hand, dominates for fluences below 1011ions cm−2, as pointed out in Dartois et
al.[28]. As the data used in this paper only take into account
fluences above 1012ions cm−2, the measured absorbances
probe the real thickness evolution.
Figure2, shows the sputtering model applied to column density variation as the fluence increases. The fitted values for 𝑁𝐷and 𝑌𝑆∞are shown inside each panel.
The ices used to calculate the column densities of the Figures 1a-1d where CO, CH4, CO and NH3, respectively.
As shown in Pilling et al.[23] and Vasconcelos et al.[12], these molecules are not radiolytically resistant, as their col-umn densities drastically change with the fluence, and 𝑁𝐷 and 𝑌∞
𝑆 must be taken as upper limits.
2.4. Theoretical methodology for the complex
refractive index calculation
In order to calculate the Complex Refractive Index (CRI) given by ̃m = n + ik, the NKABS code[22] has been used. It is an interactive code, that uses the Lambert-Beer and Kramers-Kroning equations to find accurate values of CRI from the Absorbance data (𝐴𝑏𝑠𝜈) at different wavenumbers 𝜈 - often called frequency.
To start the code, a few parameters must be provided, such as the sample thickness (𝑑), the refractive index at 670 nm (𝑛0), and for the substrate used during the experiments
(𝑛2). The Mean Average Percentual Error (MAPE) is used
to estimate the accuracy of each iteration.
The imaginary term (𝑘) is calculated from the Lambert-Beer absorption coefficient (𝛼), given by:
𝛼= 1 𝑑 [ 2.3 × Abs𝜈+ 𝑙𝑛|||| | ̃t01̃t12∕̃t02 1 + ̃r01̃r12𝑒2𝑖̃x || || | 2] (4a) 𝛼= 4𝜋𝜈𝑘 (4b)
where ̃t and ̃r, are the transmission and reflection Fresnel’s coefficients, respectively. The sub-indexes 01, 12 and 02 are related to the interfaces vacuum-sample, sample-substrate and vaccum-substrate, respectively. The complex number in the power is directly proportion to CRI, and is given by ̃x = 2𝜋𝜈d ̃m.
Once the imaginary term has been determined, the real part (𝑛) is calculated using the Kramers-Kroning relations:
𝑛(𝜈) = 𝑛0+ 2 𝜋℘∫ 𝜈2 𝜈1 𝜈′𝑘(𝜈′) 𝜈′2− 𝜈2𝑑𝜈 ′ (5)
where ℘ is the Cauchy Principal Value, used to solve inte-grals with singularity, that is this case occurs at 𝜈′2
= 𝜈2.
As this integral is numerically calculated, the Maclaurin’s method[31] is used to avoid such singularity. The adopted values for n0were 1.20 in the N1# and N2# cases and 1.30
taken from Luna et al.[19], and Hudigins et al.[16]. In all cases the substrate refractive index was 2.54.
The experimental parameters 𝜌, 𝐴 and 𝑛0are the main
source of error in calculating the CRI. In this sense, the error propagation was calculated by using the equations below:
𝜎𝑛2= 𝜎𝑛2 0+ 𝜎 2 𝑘 (6a) 𝜎𝑘2= (𝜕𝛼 𝜕𝑑 )2 𝜎𝑑2 (6b) 𝜎𝑑2= (𝜕𝑑 𝜕𝑁 )2 𝜎𝑁2 + ( 𝜕𝑑 𝜕𝜌 )2 𝜎2𝜌 (6c) 𝜎𝑁2 = (𝜕𝑁 𝜕𝐴 )2 𝜎𝐴2 (6d)
As such experimental parameters used in this paper are very sensitive to the chemical composition as shown in Luna
et al.[19,21], the values of 𝜎𝜌, 𝜎𝐴and 𝜎𝑛
0, were estimated from the confidence limits (See Appendix). Due to uncer-tainties involved in the initial parameters, the error for 𝑛 and
𝑘were around 12%.
3. Results and Discussion
3.1. Refractive Index in infrared
Figures3and4show the real and imaginary parts of the complex refractive index in the infrared (5000 - 600 cm−1),
corresponding to 2.0 - 16.6 𝜇m. The values obtained from different irradiation levels are shown by the colours black, blue and red, respectively.
The decreasing and increasing of the band areas in Fig-ures3and4are, respectively, related to the destruction and formation of chemical species during the irradiation process, which consequently changes the values of 𝑛 and 𝑘, for virgin and processed ices.
Using accurate values for 𝑛670and thickness (𝑑), is
im-portant to determine 𝑛 and 𝑘. However, the instrumentation 1The database containing these values in ASCII (American
Stan-dard Code for Information Interchange) format are available online at: https://www1.univap.br/gaa/nkabs-database/data.htm
N-containing astrophysical ices
Figure 2: Column density as function of fluence for the samples studied in this paper. Each blue dot was estimated from the Absorbance data collected after the experiments (see Section 2.2). The red line is the fitting using a sputtering model detailed in Dartois et al.[30]. ND and Y∞S are the column density probed by sputtering, and the sputtering yield at the asymptotic level, respectively.
required to calculate these parameters might not be available in some laboratories. In such cases, an analytical method us-ing averaged values has been used[23,32] instead. In order to address the impact of approximated values in the Com-plex Refractive Index calculation, a statistical analysis was performed.
As result, the confidence limit of 1𝜎 allows a variation of 30% of thickness around the mean, but only of 7% of n0.
The density and band strength allows variations around 20% and 10%, respectively.
3.2. Relative destruction
The electronic sputtering yield (𝑌𝑆), assumed here to be the main trigger of ice destruction, roughly increases quadrat-ically with the electronic stopping power (𝑆). Furthemore,
𝑆is a function of energy, mass and charge of a particle[33,
34,35,36,30]. For instance, such dependence might be ob-served in the yield values in Figure2, where 𝑌𝑆 of sample bombarded by Ni24+is higher than for samples bombarded
by O2+or O5+.
The effects of electronic sputtering is shown in Figure5
in terms of the relative destruction, i.e. Δd∕d and fluence for all samples in Table1. This figure also shows that two linear fits are required as can be seen from the solid red lines. For comparison, the black dashed lines indicates the relative de-struction of H2O-rich ices taken from Rocha et al.[20] both
for polar-containing ices and non-polar containing ices, as the van der Walls force are different. The blue and green shaded areas were also taken from Rocha et al.[20]. One can observe, in fact, that such relation with the polarity found for
H2O-containing ices is also observed for N-rich ices. As
de-scribed in Table1, the samples N1a and N2a are composed by two non-polar molecules, whereas in N3a and N4a polar ices are present. However, if the ice is very thick, such ef-fect cannot be observed, as it is the case of N2#. If samples sharing common characteristics are compared, instead (e.g. N1# and N3#), such polarity effects become more evident as they have almost the same initial thickness and were pro-cessed by the same ionizing agents. As N3# is more polar than N1#, the destruction behavior is more similar to polar ices than with non-polar species.
By comparing the linear fittings at fluence of 1013ions
cm−2, of N-rich and H
2O-rich ices, the relative destruction
for water-containing cases is about 30% higher compared to nitrogen-containing samples. However, for a non-polar sit-uation, the N-rich ices are almost three times more rapidly destroyed than water-rich ices, which strength the idea that polar molecules are important to keep processed molecules in the same site to allow the radicals to react again and enrich the chemical complexity.
4. Astrophysical implications
4.1. Polarity in astrophysical ices
Astrophysical environments at very low temperatures (T < 20K), and n > 104cm−3, allow the formation of a
non-polar layers of ice, mainly composed by CO and N2as shown
by Boogert et al.[2], given their low desorption temperature[37]. Such layers, however, are formed onto a previous ice mantle made up of H2O, CH4and NH3, as consequence of the
hy-600
1200
1800
2400
3000
3600
4200
4800
0.0
2.0
4.0
6.0
8.0
n+
of
fse
t
F0: 0 ions/cm
2F1: 10
12ions/cm
2F2: 10
13ions/cm
2a) N
2
:CO (1:1) at 14 K
600
1200
1800
2400
3000
3600
4200
4800
1.10
1.15
1.20
1.25
1.30
1.35
1.40
1.45
1.50
F0: 0 ions/cm
2F1: 10
10ions/cm
2F2: 10
11ions/cm
2b) N
2
:CH
4
(19:1) at 19 K
600
1200
1800
2400
3000
3600
4200
4800
wavenumber(cm
1
)
1.00
1.25
1.50
1.75
2.00
2.25
2.50
2.75
3.00
n+
of
fse
t
F0: 0 ions/cm
2F1: 10
12ions/cm
2F2: 10
13ions/cm
2c) NH
3
:CO (1:1) at 14 K
600
1200
1800
2400
3000
3600
4200
4800
wavenumber(cm
1
)
1.00
1.25
1.50
1.75
2.00
2.25
2.50
F0: 0 ions/cm
2F1: 10
12ions/cm
2F2: 10
13ions/cm
2d) NH
3
:CH
3
OH (1:1) at 14 K
Figure 3: Real part of the Complex Refractive Index for the samples shown in Table1at different fluences. In order to assure a better readability, an arbitrary offset has been applied.
drogenation mechanism of small grains in Molecular Clouds[38]. Cosmic rays, on the other hand, are an important agents to enrich the chemistry in Molecular Clouds, as many en-dothermic reactions are forbidden due to low temperature[39]. As such energetic particles penetrate deeper than UV or X-rays photons[40] in high density regions, they reach regions where the ices are formed, leading to many physicochemi-cal processes, including electronic sputtering, as described in Sections 2 and 3.
In such context, and assuming that non-polar ices are at least 20% more susceptible to electronic sputtering ef-fects, as shown in Figure5, one could expect a reduced life-time of icy layers containing non-polar molecules. In fact, the most abundant ices in ISM are composed by H2O, CO2,
CH3OH, and NH3as shown by Öberg et al.[1]. CO ice, on
the other hand, is the most abundant non-polar molecule, as also pointed out by Öberg et al.[1]. Its IR feature, however, has been attributed to CO diluted in polar-matrices of H2O,
CO2and CH3OH.
Other aspects relating polarity to astrophysical ices, have also been reported by Müller et al.[41], associating the band strength of O2with the chemical environment. In addition,
Knez et al.[42], point out that the acetylene’s 𝜈5feature is
much more resolved in ices dominated by non-polar or low-polarity molecules.
4.2. Opacities and albedos for astrophysical
models
Since the complex refractive index records the chemical evolution of astrophysical ices, they can be used to derive opacity table of dust models, which are the input of radiative transfer models dominated by dust. In fact, previous works by [43,44,45,46,47], have shown that the IR spectrum of YSOs are better reproduced by grain model combining dust and ice opacities. Other than ISM, where the standard ice model is dominated by H2O[1,2], some places in the
So-lar System are dominated by N-containing ices, such as Sat-urn’s moons (e.g. Titan, Iapetus, Triton), Pluto, and Ultima Thule[3,48,4]
Another direct astrophysical implication of cosmic ray irradiation of N-containing ices, is related to the albedo changes with the chemistry. The generic albedo, can be given by the
N-containing astrophysical ices
600
1200
1800
2400
3000
3600
4200
4800
0.0
1.0
2.0
3.0
4.0
5.0
6.0
k+
of
fse
t
F0: 0 ions/cm
2F1: 10
12ions/cm
2F2: 10
13ions/cm
2a) N
2
:CO (1:1) at 14 K
600
1200
1800
2400
3000
3600
4200
4800
0.00
0.05
0.10
0.15
0.20
0.25
0.30
F0: 0 ions/cm
2F1: 10
10ions/cm
2F2: 10
11ions/cm
2b) N
2
:CH
4
(19:1) at 19 K
600
1200
1800
2400
3000
3600
4200
4800
wavenumber(cm
1
)
0.0
0.5
1.0
1.5
2.0
k+
of
fse
t
F0: 0 ions/cm
2F1: 10
12ions/cm
2F2: 10
13ions/cm
2c) NH
3
:CO (1:1) at 14 K
600
1200
1800
2400
3000
3600
4200
4800
wavenumber(cm
1
)
0.0
0.2
0.4
0.6
0.8
1.0
1.2
F0: 0 ions/cm
2F1: 10
12ions/cm
2F2: 10
13ions/cm
2d) NH
3
:CH
3
OH (1:1) at 14 K
Figure 4: Imaginary part of the Complex Refractive Index for the samples shown in Table 1 at different fluences. In order to assure a better readability, an arbitrary offset has been applied.
following equation as defined in Hanner et al.[49]:
𝜔(𝜃, 𝜆) = 𝜙(𝜃)
𝑥2 (7)
where 𝜙(𝜃) is the dimensionless scattering function, and 𝑥 is the size parameter. Both equations are defined by:
𝜙(𝜃) = 4𝜋
𝑘𝑠𝑐𝑎𝑡𝑍11(𝜃) (8a)
𝑥= 2𝜋𝑎
𝜆 (8b)
where 𝑘𝑠𝑐𝑎𝑡is the scattering opacity in cm2g−1, 𝑍11(𝜃)are
the values from the scattering matrix in cm2g−1 sr−1
cal-culated from a full scattering Muller matrix for all angles of scattering (see Bohren & Huffman[50] for details), and 𝜃 is the phase angle. The subindex ‘11’ means the intensity from the Stokes parameter2. The geometric albedo, on the other
hand, is defined as the ratio between the scattered light at zero phase angle and the scattering of a idealized lamber-tian surface of same cross section. In another approach, the 2As the polarization effect is not addressed in this study, the other
Stokes parameters Q, U, and V are not being considered.
geometric albedo is also defined as two thirds of the single-scattering albedo, given by:
𝜂= 𝑘𝑠𝑐𝑎𝑡
𝑘𝑎𝑏𝑠+ 𝑘𝑠𝑐𝑎𝑡 (9)
where 𝑘𝑎𝑏𝑠is the scattering opacity in cm2 g−1. The sum
𝑘𝑎𝑏𝑠+ 𝑘𝑠𝑐𝑎𝑡is known as extinction opacity (𝑘𝑒𝑥𝑡).
In order to address the geometric albedo variation due to the chemical changes induced by the energetic processing of ices, a computational code in Python programing language was used3. Briefly, this code uses the Mie theory[51] to
solve Maxwell’s equation for the light dispersion in a medium containing spherical particles. Figure6show the geometric albedo of the samples addressed in this paper, as function of the wavelength, fluence, and grain size. Different parti-cle radius are used to highlight the scattering effects from small to large grains. The trend between geometric albedo 3Note by C. Dullemond: This is a python version of the
fa-mous Bohren Huffman Mie code. It was ported to Python from its original version bhmie.f (written by Bruce Draine) by Cor-nelis Dullemond, February 2017. Available in: http://www.ita.uni-heidelberg.de/ dullemond/software/radmc-3d/
Figure 5: Relative destruction variation (in percentage) against fluence. The squares are the values for each sample in Table1. The red solid lines are the fittings assuming a linear approximation for the N-rich ices. The black dashed lines are the fittings for H2O-rich ices taken from Rocha et al.[20]. Both polar and non-polar regions are identified by a green and blue shaded region.
and fluence is not universal for the samples shown in Fig-ure6, although one can note a general trend of decreasing in different wavelenghts. The ice mixture NH3:CH3OH
di-verge from the decreasing trend (panels d, h, l), since the geometric albedo at Fluence 3 is higher than in Fluence 2 between 2.9 and 4.2 𝜇m. Such a relationship between geo-metric albedo and fluence is given by the synthesis of com-plex molecules, including several saturated or non-saturared aliphatic compounds[12], and heteropolymers[52]. In the former case, however, the disarranged polymer-like struc-ture and the complex combinations of functional groups has been called “tholins”, as coined by Sagan & Khare[53], and are responsible for the low albedo and reddish colour as-sociated to these compounds[54]. The existence of tholins in our samples, however, has not been addressed yet, and will be investigated in a future manuscript. The grain size dependence, in general, decrease the geometric albedo in all wavelengths, although this effect is more prominent for particle radius of 100𝜇m (panels i,j,k,l). Particularly, both O Hbonds and ammonia hydrates affects the bands in the spectral range shown in Figure6. Additionally to the chemistry, nevertheless, large grains cause an extra extinc-tion due to scattering for 𝜆 > 3.1 𝜇m as reported by Léger et al.[55], that’s particularly the case of particle radius of 10 𝜇m (middle column), compared to 1 𝜇m (left column). For very large grains, however, it worth to describe the limts of the Mie theory applied to scattering effects. This limit is given by the non-dimensional size parameter given by Equa-tion 8b. In terms of the single scattering albedo and the CRI calculated in this paper, 𝑥 > 200 characterizes the
geomet-ric optics limit, whereas 0.2 < 𝑥 < 200 the Mie theory is fully considered[56]. For 𝑥 < 0.2 the Rayleigh regime is adopted. In the case of 100 𝜇m icy grain radius, the range below 3 𝜇m is in the geometric optics limit, and must be used with caution. The range above 3𝜇m, however, can be fully considered.
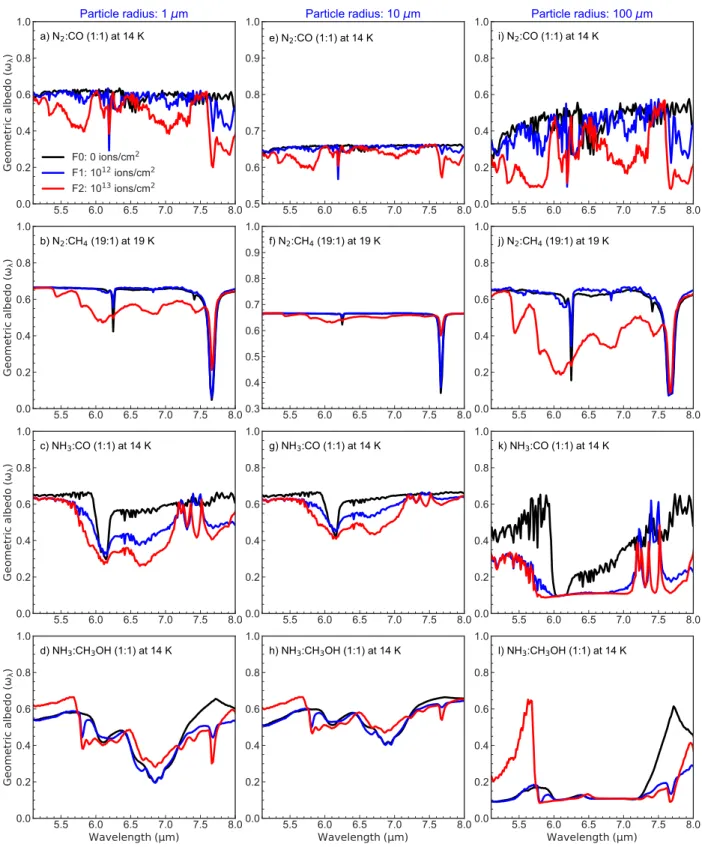
Figure9show the the geometric albedo as function of the wavelength, fluence, and grain size for the range between 5 and 8 𝜇m. This spectral range contains contributions of sev-eral functional groups associated to complex species such as alcohols, aliphatic ethers (R1-OCH2-R2) and related molecules[2].
As observed in Figure6, both the fluence and grain size in-creasing, reduce the icy grain geometric albedo, except in specific spectral intervals in the case of NH3:CH3OH. For
example, the geometric albedo in the the range between 6.5
𝜇m and 7.2 𝜇m for grain radius of 1 𝜇m and 10 𝜇m, is higher
than the samples at Fluence 0 and Fluence 1. Nevertheless it is an unexpected result, since one could expect an albedo reducing due to the synthesis of more complex species with the irradiation exposure, this suggest that the production of complex molecules do not increases with all levels of irradi-ation in some cases, but rather, high fluences might destroy the chemical bonds of synthesized species formed earlier in the same experiment. In terms of scattering regime, the in-terval between 5 and 8 𝜇m for large particle radius (100 𝜇m) ramains in the Mie regime, although very close of the geo-metric optics domain. The extinction caused by scattering in this case still very prominent, and reduces the geometric albedo by a factor of 4−6 for 5.8𝜇𝑚 < 𝜆 < 7.2𝜇𝑚.
N-containing astrophysical ices the chemical processing and particle size for the cases
be-tween 2.0−5.0 𝜇m and 5.0−8.0 𝜇m is shown in Figures8
and9, respectively. The ice mixtures N2:CO, NH3:CO and
NH3:CH3OH are shown in the upper panels, whereas N2:CH4
is shown in the bottom panels, since it was irradiated in a dif-ferent fluence regime, and also because this sample do not contains Oxygen atoms in its structure. In Figure8, the geo-metric albedo of all samples decreases with the fluence and grain size, except in the case of NH3:CH3OH. Apart of the
small decreasing observed in panels a and b (less than 2%), its geometric albedo increases with the fluence. Differently of the O-containing ice mixtures, the normalized and inte-grated geometric albedo of N2:CH4decreases linearly with
the fluence. On the other hand, some differences are ob-served in the normalized and integrated geometric albedo between 5−8 𝜇m, as shown in Figure 9. The decreasing albedo is observed for the O-containing ice mixtures, except in the case of NH3:CH3OH, that increases for large fluences,
independent of the grain size. The role for N2:CH4 is no longer linear, as observed for the case between 2−5 𝜇m, but show a small increasing at low fluences, and then decreases significantly for small (1 𝜇m) and large grains (100 𝜇m). In-termediary grain sizes, such as 10 𝜇m, the normalized and integrated albedo remains constant, taken into account the error bars.
As a test case, the NH3:CO geometric albedo is
com-pared to the reflectance profile of two regions of Iapetus, a Saturn’s icy moon. The Iapetus’s surface has a unique bi-modal albedo distribution as shown in the top panel of Fig-ure10. The white hemisphere is rich in H2O, and show a
geometric albedo of around 60%, whereas the dark region
(white dashed box) is dominated by nitrogen-rich tholin ( C N) [57]. The origin of this dichotomy is beyond the scope of this
work, but detailed explanations can be found in [58,59]. Be-tween these two hemispheres, a mixed region (green dashed box) has also been studied [60]. The temperature variation as seen between 9−16 𝜇m is shown to highlight the high temperature associated to the low albedo in the dark region, compared to the H2O-rich water. The spectrum as observed
by the Visible and Infrared Mapping Spectrometer (VIMS) instrument on-board of Cassini spacecraft between 2−5 𝜇m for the dark[61] and mixed[60] region is shown in the
bot-tompanel by the solid black line. Both blue and red lines are
the scaled geometric albedo (also called reflectance) taken from panel g in Figure6. Only the particle radius of 10 𝜇m is shown since it provided the best comparison by eye. The NH3at 3 𝜇m and CO2at 4.25 𝜇m features are prominent in
this comparison, whereas other bands such as CO2at 2.65
𝜇m, OCN−at 4.62 𝜇m and CO at 4.67 𝜇m are not observed
by VIMS, which can be caused by a resolution issue. An-other feature observed in the experiments is the13CO mode
at 4.73 𝜇m, but only observed in the mixed region during the mission at 2004 July 13, but not observed at another flyby at 2004 October 7. Buratti et al.[60], however, do not com-ment about this band in their work. Some chemical differ-ences are strickly between 2.5 and 4.0 𝜇m. Since H2O is also
present in the low albedo region, the band centered in 3 𝜇m is
more broader than the transitions for NH3:CO even at high
fluences. Two regions are hatched in this papen, namely,
𝜆= 2.8𝜇m and 𝜆 = 3.6𝜇m, since they are strongly affected by (C N) and (N H) bonds, although the grain size effect at 𝜆 = 3.6𝜇m is also known[55].
5. Conclusions
The Complex Refractive Index of N-containing ices pro-cessed by heavy ions in the laboratory is shown in this pa-per. This contributes to reduce the lack of this kind of data in the astronomical community, and become useful to improve the computational simulations in environments dominated by dust and N-ice.
The relative destruction triggered by sputtering can be associated to the polarity level of ice samples, as it was also observed for H2O-containing molecules in Rocha et al.[20].
From a astrochemical perspective, this implies in a short life-time of non-polar mantles of ices inside Molecular Clouds. Such scenario, however, opposes to layered structure of ices, and strengthen the idea that non-polar species are triggered in a H2O-dominated ice matrix.
The geometric albedo calculated in this paper in two wave-length windows has shown a strong dependence with the par-ticle size and chemical processing induced by cosmic-rays analogues. The albedo decreasing observed in both cases suggest the formation of N-rich tholins and aliphatic satu-rated and non-saturared complex molecules, which is asso-ciated to reddish colours in small bodies of the Solar Sys-tem. As a test case, the geometric albedo of NH3:CO at
two fluence levels were compared to the geoemtric albedo (reflectance) of the dark and mixed region in Iapetus, a Sat-urn’s moon. Although the aim of this comparison was not provide a conclusive analysis of the Iapetus’ surface com-position, one can note that a energetic processing of N-rich component containing traces of other materials (carbon and oxygen), seems to be the likely scenario to explain the low albedo region seem by the Cassini’s instruments. This be-comes a strong motivation for future prospects aiming fur-ther chemical constraints of low albedo surfaces inside the Solar System and beyond.
6. Aknowledgements
The authors acknowledge the anonymous referee’s com-ments that securely improved this manuscript. They also are grateful to the financial support provided by the Brazilian agencies FAPESP (Projects 2015/23054-7, 2016/11334-5, 2017/07283-9, 2016/22018-7 and 2013/07657-5) and CNPq (Projects 304130/2012-5 and 306145/2015-4). WRMR also acknowledge MSc. Giulia Perotti for the fruitful discussions about this paper.
A. Appendix
The degeneracy was addressed by using a 𝜒2statistical
analysis. In summary, random values were attributed to 𝐴,
2.5 3.0 3.5 4.0 4.5 5.0 0.0 0.2 0.4 0.6 0.8 1.0
Ge
om
et
ric
alb
ed
o(
)
a) N2:CO (1:1) at 14 KParticle radius: 1 m
F0: 0 ions/cm2 F1: 1012 ions/cm2 F2: 1013 ions/cm2 2.5 3.0 3.5 4.0 4.5 5.0 0.3 0.4 0.5 0.6 0.7 0.8 0.9 1.0Ge
om
et
ric
alb
ed
o(
)
b) N2:CH4 (19:1) at 19 K 2.5 3.0 3.5 4.0 4.5 5.0 0.0 0.2 0.4 0.6 0.8 1.0Ge
om
et
ric
alb
ed
o(
)
c) NH3:CO (1:1) at 14 K 2.5 3.0 3.5 4.0 4.5 5.0Wavelength ( m)
0.0 0.2 0.4 0.6 0.8 1.0Ge
om
et
ric
alb
ed
o(
)
d) NH3:CH3OH (1:1) at 14 K 2.5 3.0 3.5 4.0 4.5 5.0 0.0 0.2 0.4 0.6 0.8 1.0 e) N2:CO (1:1) at 14 KParticle radius: 10 m
2.5 3.0 3.5 4.0 4.5 5.0 0.3 0.4 0.5 0.6 0.7 0.8 0.9 1.0 f) N2:CH4 (19:1) at 19 K 2.5 3.0 3.5 4.0 4.5 5.0 0.0 0.2 0.4 0.6 0.8 1.0 g) NH3:CO (1:1) at 14 K 2.5 3.0 3.5 4.0 4.5 5.0Wavelength ( m)
0.0 0.2 0.4 0.6 0.8 1.0 h) NH3:CH3OH (1:1) at 14 K 2.5 3.0 3.5 4.0 4.5 5.0 0.0 0.2 0.4 0.6 0.8 1.0 i) N2:CO (1:1) at 14 KParticle radius: 100 m
2.5 3.0 3.5 4.0 4.5 5.0 0.0 0.2 0.4 0.6 0.8 1.0 j) N2:CH4 (19:1) at 19 K 2.5 3.0 3.5 4.0 4.5 5.0 0.0 0.2 0.4 0.6 0.8 1.0 k) NH3:CO (1:1) at 14 K 2.5 3.0 3.5 4.0 4.5 5.0Wavelength ( m)
0.0 0.2 0.4 0.6 0.8 1.0 l) NH3:CH3OH (1:1) at 14 KFigure 6: 2−5𝜇m wavelength and grain size dependent geometric albedo for the ice mixtures listed in Table1, and shown in each row from the top to bottom panels. The first, second and third columns indicate the icy grain radius of 1𝜇m, 10𝜇m and 100𝜇m, respectively.
to calculate the 𝑛 and 𝑘 after 10 iterations, and a 𝜒2given by Equation 7a was calculated.
𝜒2=∑ 𝑖 ( 𝐴𝑏𝑠𝑒𝑥𝑝𝜈,𝑖 − 𝐴𝑏𝑠𝑡ℎ𝑒𝑜 𝜈,𝑖 )2 𝐴𝑏𝑠𝑡ℎ𝑒𝑜𝜈,𝑖 (10a)
N-containing astrophysical ices 5.5 6.0 6.5 7.0 7.5 8.0 0.0 0.2 0.4 0.6 0.8 1.0
Ge
om
et
ric
alb
ed
o(
)
a) N2:CO (1:1) at 14 KParticle radius: 1 m
F0: 0 ions/cm2 F1: 1012 ions/cm2 F2: 1013 ions/cm2 5.5 6.0 6.5 7.0 7.5 8.0 0.0 0.2 0.4 0.6 0.8 1.0Ge
om
et
ric
alb
ed
o(
)
b) N2:CH4 (19:1) at 19 K 5.5 6.0 6.5 7.0 7.5 8.0 0.0 0.2 0.4 0.6 0.8 1.0Ge
om
et
ric
alb
ed
o(
)
c) NH3:CO (1:1) at 14 K 5.5 6.0 6.5 7.0 7.5 8.0Wavelength ( m)
0.0 0.2 0.4 0.6 0.8 1.0Ge
om
et
ric
alb
ed
o(
)
d) NH3:CH3OH (1:1) at 14 K 5.5 6.0 6.5 7.0 7.5 8.0 0.5 0.6 0.7 0.8 0.9 1.0 e) N2:CO (1:1) at 14 KParticle radius: 10 m
5.5 6.0 6.5 7.0 7.5 8.0 0.3 0.4 0.5 0.6 0.7 0.8 0.9 1.0 f) N2:CH4 (19:1) at 19 K 5.5 6.0 6.5 7.0 7.5 8.0 0.0 0.2 0.4 0.6 0.8 1.0 g) NH3:CO (1:1) at 14 K 5.5 6.0 6.5 7.0 7.5 8.0Wavelength ( m)
0.0 0.2 0.4 0.6 0.8 1.0 h) NH3:CH3OH (1:1) at 14 K 5.5 6.0 6.5 7.0 7.5 8.0 0.0 0.2 0.4 0.6 0.8 1.0 i) N2:CO (1:1) at 14 KParticle radius: 100 m
5.5 6.0 6.5 7.0 7.5 8.0 0.0 0.2 0.4 0.6 0.8 1.0 j) N2:CH4 (19:1) at 19 K 5.5 6.0 6.5 7.0 7.5 8.0 0.0 0.2 0.4 0.6 0.8 1.0 k) NH3:CO (1:1) at 14 K 5.5 6.0 6.5 7.0 7.5 8.0Wavelength ( m)
0.0 0.2 0.4 0.6 0.8 1.0 l) NH3:CH3OH (1:1) at 14 KFigure 7: Same of Figure6, but for the range between 5−8 𝜇m.
𝐴𝑏𝑠𝑡ℎ𝑒𝑜𝜈,𝑖 = 𝐴𝑏𝑠(𝑛0, 𝐴, 𝜌) (10b)
where 𝐴𝑏𝑠𝑒𝑥𝑝
𝜈 is the laboratory data.
At the end of 5000 simulations, a 𝜒2analysis was
per-formed, by using the following equation:
Δ𝜒2(𝜈, 𝛼) = 𝜒2− 𝜒𝑚𝑖𝑛2 (11)
where 𝜈 and 𝛼 are the degrees of freedom and the statistical significance, respectively. One can observe, that confidence regions do not depend on the accuracy of the fit, but the num-ber of degrees of freedom.
Figure11shows an example of this investigation for the sample N1, once the other results were similar. The colours
0.00 0.25 0.50 0.75 1.00
Fluence × 10
13ions cm
2 0.85 0.90 0.95 1.00 1.05 1.10d
/
F0d
Particle radius: 1 m N2:CO NH3:CO NH3:CH3OHa
0.00 0.25 0.50 0.75 1.00Fluence × 10
13ions cm
2 0.80 0.85 0.90 0.95 1.00 1.05 1.10 Particle radius: 10 m N2:CO NH3:CO NH3:CH3OHb
0.00 0.25 0.50 0.75 1.00Fluence × 10
13ions cm
2 0.4 0.6 0.8 1.0 1.2 1.4 Particle radius: 100 m N2:CO NH3:CO NH3:CH3OHc
0 2 4 6Fluence × 10
13ions cm
2 0.94 0.96 0.98 1.00d
/
F0d
Particle radius: 1 m N2:CH4d
0 2 4 6Fluence × 10
13ions cm
2 0.94 0.96 0.98 1.00 Particle radius: 10 m N2:CH4e
0 2 4 6Fluence × 10
13ions cm
2 0.6 0.7 0.8 0.9 1.0 Particle radius: 100 m N2:CH4f
Figure 8: Normalized and integrated geometric albedo between 2−5 𝜇m against fluence for all samples in Table1for 3 icy grain sizes. As the sample N2# was irradiated in a fluence range different of the other samples, it is shown separately at the bottom layer. The lines are to guide the eye only. A light gray dotted line indicate the ratio equal the unity.
show Δ𝜒2 for the thickness against 𝑛
0 and Band strength
against Density. The histograms are also shown, and the up-per, lower and mean values are indicated. The confidence limits in terms of 𝜎 are presented by the solid white, yellow and red colours, respectively.
References
[1] K. I. Öberg, A. C. A. Boogert, K. M. Pontoppidan, S. van den Broek, E. F. van Dishoeck, S. Bottinelli, G. A. Blake, and N. J. Evans, II. The Spitzer Ice Legacy: Ice Evolution from Cores to Protostars.
As-trophys. J., 740:109, October 2011.
[2] A. C. A. Boogert, P. A. Gerakines, and D. C. B. Whittet. Observa-tions of the icy universe. Annu. Rev. Astron. Astrophys., 53:541–581, August 2015.
[3] D. P. Cruikshank, W. M. Grundy, F. E. DeMeo, M. W. Buie, R. P. Binzel, D. E. Jennings, C. B. Olkin, J. W. Parker, D. C. Reuter, J. R. Spencer, S. A. Stern, L. A. Young, and H. A. Weaver. The surface compositions of Pluto and Charon. Icarus, 246:82–92, January 2015. [4] S. A. Stern, H. A. Weaver, and Spencer et al. Initial results from the New Horizons exploration of 2014 MU69, a small Kuiper Belt object.
Science, 364(6441), May 2019.
[5] M. Rubin, K. Altwegg, H. Balsiger, A. Bar-Nun, J.-J. Berthelier, A. Bieler, P. Bochsler, C. Briois, U. Calmonte, M. Combi, J. De Keyser, F. Dhooghe, P. Eberhardt, B. Fiethe, S. A. Fuselier, S. Gasc, T. I. Gombosi, K. C. Hansen, M. Hässig, A. Jäckel, E. Kopp, A. Korth, L. Le Roy, U. Mall, B. Marty, O. Mousis, T. Owen, H. Rème, T. Sé-mon, C.-Y. Tzou, J. H. Waite, and P. Wurz. Molecular nitrogen in comet 67P/Churyumov-Gerasimenko indicates a low formation tem-perature. Science, 348:232–235, April 2015.
[6] M. A. Satorre, M. E. Palumbo, and G. Strazzulla. Infrared spectra of N2-rich ice mixtures. J. Geophys. Res., 106:33363–33370, December
2001.
[7] P. Boduch, A. Domaracka, D. Fulvio, T. Langlinay, X. Y. Lv, M. E. Palumbo, H. Rothard, and G. Strazzulla. Chemistry induced by en-ergetic ions in water ice mixed with molecular nitrogen and oxygen.
Astron. Astrophys., 544:A30, August 2012.
[8] G. A. Cruz-Diaz, G. M. Muñoz Caro, Y.-J. Chen, and T.-S. Yih. Vacuum-UV spectroscopy of interstellar ice analogs. II. Absorp-tion cross-secAbsorp-tions of nonpolar ice molecules. Astron. Astrophys., 562:A120, February 2014.
[9] B. Augé, E. Dartois, C. Engrand, J. Duprat, M. Godard, L. Delauche, N. Bardin, C. Mejía, R. Martinez, G. Muniz, A. Domaracka, P. Bo-duch, and H. Rothard. Irradiation of nitrogen-rich ices by swift heavy ions. Clues for the formation of ultracarbonaceous micrometeorites.
Astron. Astrophys., 592:A99, August 2016.
[10] G. C. Almeida, S. Pilling, A. L. F. de Barros, C. A. P. da Costa, R. C. Pereira, and E. F. da Silveira. Processing of N2O ice by fast ions:
im-plications on nitrogen chemistry in cold astrophysical environments.
Mon. Not. R. Astronom. Soc., 471:1330–1340, October 2017.
[11] F. A. Vasconcelos, S. Pilling, W. R. M. Rocha, H. Rothard, and P. Bo-duch. Radiolysis of N2-rich astrophysical ice by swift oxygen ions: implication for space weathering of outer solar system bodies.
Phys-ical Chemistry ChemPhys-ical Physics (Incorporating Faraday Transac-tions), 19:24154–24165, 2017.
[12] F. d. A. Vasconcelos, S. Pilling, W. R. M. Rocha, H. Rothard, and P. Boduch. Energetic Processing of N2:CH4Ices Employing X-Rays
and Swift Ions: Implications for Icy Bodies in the Outer Solar System.
Astrophys. J., 850:174, December 2017.
[13] G. Fedoseev, C. Scirè, G. A. Baratta, and M. E. Palumbo. Cosmic ray processing of N2-containing interstellar ice analogues at dark cloud
N-containing astrophysical ices 0.00 0.25 0.50 0.75 1.00
Fluence × 10
13ions cm
2 0.7 0.8 0.9 1.0 1.1 1.2d
/
F0d
Particle radius: 1 m N2:CO NH3:CO NH3:CH3OHa
0.00 0.25 0.50 0.75 1.00Fluence × 10
13ions cm
2 0.80 0.85 0.90 0.95 1.00 1.05 1.10 Particle radius: 10 m N2:CO NH3:CO NH3:CH3OHb
0.00 0.25 0.50 0.75 1.00Fluence × 10
13ions cm
2 0.4 0.6 0.8 1.0 1.2 Particle radius: 100 m N2:CO NH3:CO NH3:CH3OHc
0 2 4 6Fluence × 10
13ions cm
2 0.90 0.95 1.00 1.05 1.10d
/
F0d
Particle radius: 1 m N2:CH4d
0 2 4 6Fluence × 10
13ions cm
2 0.90 0.95 1.00 1.05 1.10 Particle radius: 10 m N2:CH4e
0 2 4 6Fluence × 10
13ions cm
2 0.7 0.8 0.9 1.0 1.1 Particle radius: 100 m N2:CH4f
Figure 9: Same of Figure8, but for the range between 2−5 𝜇m.
conditions. Mon. Not. R. Astronom. Soc., 475:1819–1828, April 2018. [14] A. L. F. de Barros, E. F. da Silveira, D. Fulvio, P. Boduch, and H. Rothard. Formation of nitrogen- and oxygen-bearing molecules from radiolysis of nitrous oxide ices - implications for Solar system and interstellar ices. Mon. Not. R. Astronom. Soc., 465:3281–3290, March 2017.
[15] D. Fulvio, G. A. Baratta, B. Sivaraman, N. J. Mason, E. F. da Silveira, A. L. F. de Barros, O. Pandoli, G. Strazzulla, and M. E. Palumbo. Ion irradiation of N2O ices and NO2:N2O4ice mixtures: first steps to
understand the evolution of molecules with the N-O bond in space.
Mon. Not. R. Astronom. Soc., 483:381–391, February 2019.
[16] D. M. Hudgins, S. A. Sandford, L. J. Allamandola, and A. G. G. M. Tielens. Mid- and far-infrared spectroscopy of ices - Optical constants and integrated absorbances. Astrophys. J., 86:713–870, June 1993. [17] P. Ehrenfreund, A. C. A. Boogert, P. A. Gerakines, A. G. G. M.
Tie-lens, and E. F. van Dishoeck. Infrared spectroscopy of interstellar ap-olar ice analogs. Astron. Astrophys., 328:649–669, December 1997. [18] M. H. Moore, R. F. Ferrante, W. J. Moore, and R. Hudson. Infrared
Spectra and Optical Constants of Nitrile Ices Relevant to Titan’s At-mosphere. Astrophys. J., 191:96–112, November 2010.
[19] R. Luna, M. Á. Satorre, M. Domingo, C. Millán, and C. Santonja. Density and refractive index of binary CH4, N2and CO2ice mixtures.
Icarus, 221:186–191, September 2012.
[20] W. R. M. Rocha, S. Pilling, A. L. F. de Barros, D. P. P. Andrade, H. Rothard, and P. Boduch. Infrared complex refractive index of as-trophysical ices exposed to cosmic rays simulated in the laboratory.
Mon. Not. R. Astronom. Soc., 464:754–767, January 2017.
[21] R. Luna, G. Molpeceres, J. Ortigoso, M. A. Satorre, M. Domingo, and B. Maté. Densities, infrared band strengths, and optical constants of solid methanol. Astron. Astrophys., 617:A116, September 2018. [22] W.R.M. Rocha and S. Pilling. Determination of optical constants n
and k of thin films from absorbance data using kramers-kronig rela-tionship. Spectrochimica Acta Part A: Molecular and Biomolecular
Spectroscopy, 123:436 – 446, 2014.
[23] S. Pilling, E. Seperuelo Duarte, E. F. da Silveira, E. Balanzat, H. Rothard, A. Domaracka, and P. Boduch. Radiolysis of ammonia-containing ices by energetic, heavy, and highly charged ions inside dense astrophysical environments. Astron. Astrophys., 509:A87, Jan-uary 2010.
[24] G. M. Muñoz Caro, E. Dartois, P. Boduch, H. Rothard, A. Domaracka, and A. Jiménez-Escobar. Comparison of UV and high-energy ion irradiation of methanol:ammonia ice. Astron. Astrophys., 566:A93, June 2014.
[25] M. Bouilloud, N. Fray, Y. Bénilan, H. Cottin, M.-C. Gazeau, and A. Jolly. Bibliographic review and new measurements of the in-frared band strengths of pure molecules at 25 K: H2O, CO2, CO,
CH4, NH3, CH3OH, HCOOH and H2CO. Mon. Not. R. Astronom.
Soc., 451:2145–2160, August 2015.
[26] B. M. Giuliano, R. M. Escribano, R. Martín-Doménech, E. Dartois, and G. M. Muñoz Caro. Interstellar ice analogs: band strengths of H2O, CO2, CH3OH, and NH3in the far-infrared region. Astron.
As-trophys., 565:A108, May 2014.
[27] M. E. Palumbo, G. A. Baratta, and F. Spinella. Cosmic ion irradiation and UV photolysis of solids in star forming regions . Memorie della
Societa Astronomica Italiana Supplementi, 9:192, 2006.
[28] E. Dartois, J. J. Ding, A. L. F. de Barros, P. Boduch, R. Brunetto, M. Chabot, A. Domaracka, M. Godard, X. Y. Lv, C. F. Mejía Guamán, T. Pino, H. Rothard, E. F. da Silveira, and J. C. Thomas. Swift heavy ion irradiation of water ice from MeV to GeV energies. Approaching true cosmic ray compaction. Astron. Astrophys., 557:A97, September 2013.
[29] R. A. Baragiola. Water ice on outer solar system surfaces: Basic properties and radiation effects. Planet. Space Sci., 51:953–961, De-cember 2003.
[30] E. Dartois, M. Chabot, T. Id Barkach, H. Rothard, B. Augé, A. N. Ag-nihotri, A. Domaracka, and P. Boduch. Cosmic ray sputtering yield
Dark material
Mixed region
Image Credit: NASA/JPL/GSFC/SwRI/SSI
Image Credit: NASA/JPL-Caltech/Space Science Institute/Lunar and Planetary Institute Longitude La ti tu d e
Figure 10: Top: Iapetus moon reflectance compared to the scaled geometric albedo of the laboratory data (sample N3# in Table1). The solid black line indicate the dark material reflectance [61], and the dashed green line, between 4.5−5.0 𝜇m is the reflectance of the mixed region [60]. Both blue and red solid lines are the scaled geometric albedo of NH3:CO ice mixture, for an icy grain of radius equal to 10𝜇m, and at fluences 2 and 3, respectively. The hatched regions highlight the differences between the experimental and observed data. The dashed green box makes reference to the mixed region shown in the bottom panel. Bottom: Global 3-colour map of Iapetus obtained by the Cassini’s spacecraft Imaging Science Subsystem (ISS). Both dark material and mixed regions are indicated by the white and green dashed boxes. The subpanel overlayed the bottom panel show the temperature variation for the mixed region, as measured between 9 and 16 𝜇m by the Composite Infrared Spectrometer (CIRS). These images were taken from https://photojournal.jpl.nasa.gov/target/iapetus.
of interstellar H2O ice mantles. Ice mantle thickness dependence.
As-tron. Astrophys., 618:A173, October 2018.
[31] Koji Ohta and Hatsuo Ishida. Comparison among several numerical integration methods for kramers-kronig transformation. Appl.
Spec-trosc., 42(6):952–957, Aug 1988.
[32] A. Dawes, N. J. Mason, and H. J. Fraser. Using the C-O stretch
to unravel the nature of hydrogen bonding in low-temperature solid methanol-water condensates. Physical Chemistry Chemical Physics
(Incorporating Faraday Transactions), 18:1245–1257, 2016.
[33] E. Seperuelo Duarte, P. Boduch, H. Rothard, T. Been, E. Dartois, L. S. Farenzena, and E. F. da Silveira. Heavy ion irradiation of con-densed CO2: sputtering and molecule formation. Astron. Astrophys.,
N-containing astrophysical ices 0 4 8 12 16 20 24 28 32 De ns ity (g c m -3) n670 n m 1! 2! 3!
Thickness (µm) Band Strength (cm molecule-1) Δ%&', ) = %&− % ,-.& 0 4 8 12 16 20 24 28 32 Δ%&', ) = %&− % ,-.& De ns ity (g c m -3) 1! 2! 3! CIlo w er CIuppe r Me an CIlo w er CIuppe r Mean
Figure 11: Confidence limit levels and histogram of the input parameters based on a 𝜒2 statistical analysis. The levels 1-3𝜎 are shown by red, yellow and white solid lines, respectively. The mean is shown by a green solid line, whereas the upper and lower 1𝜎 confidence limits are given by red and blue dashed lines.
502:599–603, August 2009.
[34] P. Boduch, E. Dartois, A. L. F. de Barros, E. F. da Silveira, A. Do-maracka, X.-Y. Lv, M. E. Palumbo, S. Pilling, H. Rothard, E. Seperu-elo Duarte, and G. Strazzulla. Radiation effects in astrophysical ices. In Journal of Physics Conference Series, volume 629 of Journal of
Physics Conference Series, page 012008, July 2015.
[35] C. Mejía, A. L. F. de Barros, E. Seperuelo Duarte, E. F. da Silveira, E. Dartois, A. Domaracka, H. Rothard, and P. Boduch. Compaction of porous ices rich in water by swift heavy ions. Icarus, 250:222–229, April 2015.
[36] H. Rothard, A. Domaracka, P. Boduch, M. E. Palumbo, G. Strazzulla, E. F. da Silveira, and E. Dartois. Modification of ices by cosmic rays and solar wind. Journal of Physics B Atomic Molecular Physics, 50(6):062001, March 2017.
[37] M. P. Collings, M. A. Anderson, R. Chen, J. W. Dever, S. Viti, D. A. Williams, and M. R. S. McCoustra. A laboratory survey of the ther-mal desorption of astrophysically relevant molecules. Mon. Not. R.
Astronom. Soc., 354:1133–1140, November 2004.
[38] A. G. G. M. Tielens and W. Hagen. Model calculations of the molec-ular composition of interstellar grain mantles. Astron. Astrophys., 114:245–260, October 1982.
[39] C. J. Waddington. The ultra heavy elements in the cosmic radiation.
Space Science Reviews, 130(1):457–464, Jun 2007.
[40] A. E. Glassgold, J. Najita, and J. Igea. X-Ray Ionization of Protoplan-etary Disks. Astrophys. J., 480:344–350, May 1997.
[41] B. Müller, B. M. Giuliano, L. Bizzocchi, A. I. Vasyunin, and P. Caselli. O2signature in thin and thick O2-H2O ices. Astron.
Astro-phys., 620:A46, November 2018.
[42] C. Knez, M. H. Moore, R. F. Ferrante, and R. L. Hudson. Labora-tory IR Studies and Astrophysical Implications of C2H2-Containing
Binary Ices. Astrophys. J., 748:95, April 2012.
[43] K. M. Pontoppidan, C. P. Dullemond, E. F. van Dishoeck, G. A. Blake, A. C. A. Boogert, N. J. Evans, II, J. E. Kessler-Silacci, and F. Lahuis. Ices in the Edge-on Disk CRBR 2422.8-3423: Spitzer
Spectroscopy and Monte Carlo Radiative Transfer Modeling.
Astro-phys. J., 622:463–481, March 2005.
[44] G. Robinson, R. G. Smith, and M. M. Maldoni. The water-ice libra-tional band: radiative transfer model for AFGL 961. Monthly Notices
of the Royal Astronomical Society, 424(2):1530–1542, 08 2012.
[45] W. R. M. Rocha and S. Pilling. Computational Modeling of the Class I Low-Mass Protostar Elias 29 Applying Optical Constants of Ices Pro-cessed By High Energy Cosmic Ray Analogs. Astrophys. J., 803:18, April 2015.
[46] M. Min, J. Bouwman, C. Dominik, L. B. F. M. Waters, K. M. Pon-toppidan, S. Hony, G. D. Mulders, T. Henning, E. F. van Dishoeck, P. Woitke, N. J. Evans, II, and Digit Team. The abundance and ther-mal history of water ice in the disk surrounding HD 142527 from the DIGIT Herschel Key Program. Astron. Astrophys., 593:A11, August 2016.
[47] I. Kamp, A. Scheepstra, M. Min, L. Klarmann, and P. Riviere-Marichalar. Diagnostic value of far-IR water ice features in T Tauri disks. Astron. Astrophys., 617:A1, September 2018.
[48] W. B. McKinnon, F. Nimmo, T. Wong, P. M. Schenk, O. L. White, J. H. Roberts, J. M. Moore, J. R. Spencer, A. D. Howard, O. M. Umurhan, S. A. Stern, H. A. Weaver, C. B. Olkin, L. A. Young, K. E. Smith, R. Beyer, M. Buie, B. Buratti, A. Cheng, D. Cruik-shank, C. Dalle Ore, R. Gladstone, W. Grundy, T. Lauer, I. Linscott, J. Parker, S. Porter, H. Reitsema, D. Reuter, S. Robbins, M. Showalter, K. Singer, D. Strobel, M. Summers, L. Tyler, M. Banks, O. Barnouin, V. Bray, B. Carcich, A. Chaikin, C. Chavez, C. Conrad, D. Hamilton, C. Howett, J. Hofgartner, J. Kammer, C. Lisse, A. Marcotte, A. Parker, K. Retherford, M. Saina, K. Runyon, E. Schindhelm, J. Stansberry, A. Steffl, T. Stryk, H. Throop, C. Tsang, A. Verbiscer, H. Winters, A. Zangari, and G. a. I. T. T. New Horizons Geology. Convection in a volatile nitrogen-ice-rich layer drives Pluto’s geological vigour.
Nature, 534:82–85, June 2016.
[49] M. S. Hanner, R. H. Giese, K. Weiss, and R. Zerull. On the definition of albedo and application to irregular particles. Astron. Astrophys.,
104:42–46, December 1981.
[50] C. F. Bohren and D. R. Huffman. Absorption and scattering of light
by small particles. 1983.
[51] G. Mie. Beiträge zur Optik trüber Medien, speziell kolloidaler Met-allösungen. Annalen der Physik, 330:377–445, 1908.
[52] H. James Cleaves, Catherine Neish, Michael P. Callahan, Eric Parker, Facundo M. FernÃąndez, and Jason P. Dworkin. Amino acids gen-erated from hydrated titan tholins: Comparison with millerâĂŞurey electric discharge products. Icarus, 237:182 – 189, 2014.
[53] C. Sagan and B. N. Khare. Tholins: organic chemistry of interstellar grains and gas. Nature, 277(5692):102–107, Jan 1979.
[54] D. P. Cruikshank, W. M. Grundy, D. T. Britt, E. Quirico, B. Schmitt, S. Scipioni, C. M. Dalle Ore, J. C. Cook, L. Gabasova, S. Protopapa, S. A. Stern, H. A. Weaver, A. J. Verbiscer, J. R. Spencer, and New Horizons Composition Team. The Colors of 486958 2014 MU69 (“Ultima Thule”): The Role of Synthetic Organic Solids (Tholins). In
Lunar and Planetary Science Conference, Lunar and Planetary
Sci-ence ConferSci-ence, page 2051, Mar 2019.
[55] A. Leger, S. Gauthier, D. Defourneau, and D. Rouan. Properties of amorphous H2O ice and origin of the 3.1-micron absorption. , 117(1):164–169, Jan 1983.
[56] H. MoosmÃijller and C.M. Sorensen. Small and large particle limits of single scattering albedo for homogeneous, spherical parti-cles. Journal of Quantitative Spectroscopy and Radiative Transfer, 204:250 – 255, 2018.
[57] R. H. Brown, K. H. Baines, G. Bellucci, B. J. Buratti, F. Capaccioni, P. Cerroni, R. N. Clark, A. Coradini, D. P. Cruikshank, P. Drossart, V. Formisano, R. Jaumann, Y. Langevin, D. L. Matson, T. B. McCord, V. Mennella, R. M. Nelson, P. D. Nicholson, B. Sicardy, C. Sotin, N. Baugh, C. A. Griffith, G. B. Hansen, C. A. Hibbitts, T. W. Mo-mary, and M. R. Showalter. Observations in the Saturn system dur-ing approach and orbital insertion, with Cassini’s visual and infrared mapping spectrometer (VIMS). , 446(2):707–716, Feb 2006. [58] W. M. Grundy, M. W. Buie, J. A. Stansberry, J. R. Spencer, and
B. Schmitt. Near-Infrared Spectra of Icy Outer Solar System Surfaces: Remote Determination of H2O Ice Temperatures. , 142(2):536–549,
Dec 1999.
[59] Tobias C. Owen, Dale P. Cruikshank, C. M. Dalle Ore, T. R. Geballe, T. L. Roush, C. de Bergh, Roland Meier, Yvonne J. Pendleton, and Bishun N. Khare. Decoding the Domino: The Dark Side of Iapetus. , 149(1):160–172, Jan 2001.
[60] B. J. Buratti, D. P. Cruikshank, R. H. Brown, R. N. Clark, J. M. Bauer, R. Jaumann, T. B. McCord, D. P. Simonelli, C. A. Hibbitts, G. B. Hansen, T. C. Owen, K. H. Baines, G. Bellucci, J. P. Bibring, F. Capaccioni, P. Cerroni, A. Coradini, P. Drossart, V. Formisano, Y. Langevin, D. L. Matson, V. Mennella, R. M. Nelson, P. D. Nichol-son, B. Sicardy, C. Sotin, T. L. Roush, K. Soderlund, and A. Mu-radyan. Cassini Visual and Infrared Mapping Spectrometer Observa-tions of Iapetus: Detection of CO2. , 622(2):L149–L152, Apr 2005.
[61] Roger N. Clark, Dale P. Cruikshank, Ralf Jaumann, Robert H. Brown, Katrin Stephan, Cristina Morea Dalle Ore, K. Eric Livo, Neil Pear-son, John M. Curchin, Todd M. Hoefen, Bonnie J. Buratti, Gianrico Filacchione, Kevin H. Baines, and Philip D. Nicholson. The sur-face composition of Iapetus: Mapping results from Cassini VIMS. , 218(2):831–860, Apr 2012.