HAL Id: hal-02489994
https://hal.archives-ouvertes.fr/hal-02489994
Submitted on 24 Feb 2020
HAL is a multi-disciplinary open access
archive for the deposit and dissemination of
sci-entific research documents, whether they are
pub-lished or not. The documents may come from
teaching and research institutions in France or
abroad, or from public or private research centers.
L’archive ouverte pluridisciplinaire HAL, est
destinée au dépôt et à la diffusion de documents
scientifiques de niveau recherche, publiés ou non,
émanant des établissements d’enseignement et de
recherche français ou étrangers, des laboratoires
publics ou privés.
analysis in Aircraft Electrical Power Distribution System
Bernard Makhraz, Hubert Piquet, Xavier Roboam, Jérôme Mavier
To cite this version:
Bernard Makhraz, Hubert Piquet, Xavier Roboam, Jérôme Mavier.
Matrix approach based on
Quadripole for quality analysis in Aircraft Electrical Power Distribution System. Electrimacs, May
2019, Salerno, Italy. pp.21 - 23. �hal-02489994�
Matrix approach based on Quadripole for quality analysis in Aircraft
Electrical Power Distribution System
Bernard MAKHRAZ · Hubert PIQUET · Xavier ROBOAM · Jerome MAVIER
Abstract
HVDC bus based electrical network architectures have shown to be relevant for More-Electric Aircraft. Today, adequate standards of power quality and stability must be set and even optimized: subsequent design constraints have to allow the system integrator to guarantee the safe operation of the network, without excessive impact on the design of the equipment provided by the suppliers, especially regarding weight penalty. In this context, this paper proposes a specific methodology to analyze the power quality constraints in an HVDC network.
A matrix approach, based on Quadripole analysis of the power distribution is considered. It aims at achieving a direct sensitivity analysis of any quantity (regarding its harmonic content) of any electrical network with respect to selected inputs and based on the network topology and parameters. One major advantage of this methodology is that the modeling approach is analytically developed, based on symbolic calculation.
All the devices (sources, cables, filters, loads, etc) of the system are represented as four-terminal (quadripole) devices, connected together according to the network topology. The calculations are performed at very high speed in the frequency domain. An application of this approach on a relevant aircraft electrical power distribution is shown to
highlight its benefit on the path of optimizing new HVDC quality standards.
Keywords: Matrix approach, More-Electric Aircraft, Power Distribution, Quality, HVDC Standards.
Introduction
The More-Electric Aircraft embeds more electric power systems aiming at minimizing both sizes and weights of components (especially in the filter device) by fulfilling quality and stability standards [1] [2], as well as energy management optimization by using the same power inverter to supply different loads during different flight phases [3] [4]. New distribution architecture, for instance using HVDC buses to save weight [5] - though local HVDC bus bars are used in the current state of art [6]. Using a +/-270V DC network is a promising way to save weight as well [7]. These implications entail new challenges on the quality and the stability of the DC network [8] [9] due to the use of non-linear loads, such as power converters, [10] [11]. Interoperability between the sources and the loads falls under the responsibility of the system integrator through the HVDC standard, which defines the power quality requirements that need to be satisfied under different operating conditions. Today, standards for new distribution networks (HVDC) have to be studied and even optimized in order to avoid weight surplus.
In this context, this paper propose an analysis methodology based on a quadripole (matrix) approach. One major advantage of this method is that the modeling approach is analytically developed, based on symbolic calculation which allows to directly analyze network couplings in the frequency domain, leading to fast and direct analysis. In this paper, section 1 introduces the four-terminal model used for all the building blocks of the HVDC network and B. MAKHRAZ · J. MAVIER
Airbus Operation SAS Toulouse, France
E-mail : [email protected], [email protected]
H. PIQUET · X. ROBOAM · B. MAKHRAZ
Laboratoire Plasma et Conversion d’Energie (LAPLACE) Toulouse, France
its acausal formulation, with generalization at system level. The topology of the network is taken into account in section 2, using matrix formulation. Calculations presented in section 3 allow drawing the correlation and sensitivity analysis between any pair of devices (“disruptive” and “victim” devices), to evaluate the impact at the victim level of the environment pollution, especially fulfillment of standard requirements in the design of the disruptive element. An illustrative example at system level is presented in section 4. Finally, an approach integrating standard’s requirements currently under study is proposed in section 5. 1. Quadripole based model definition
1.1. Four-terminal model definition
The modelling approach for quality analysis is based on representing of each component of the electrical distribution network with a four-terminal circuit (also sometimes called “two-port network”), which is represented by a “quadripole” matrix. This matrix, involving two linear equations, links currents and voltages on both sides of the concerned element as shown in figure 1.
As the matrix representing each quadripole can have more than one format (based on the different input/output combinations of currents and voltages), the first matrix introduced in the equation (1) is the “Transfer Matrix” which connects the voltage and the current on the right side with those on the left side.
Fig. 1 - Schematic representation of a generic electric Quadripole.
[vio o] = [ T11 T12 T21 T22] ∗ [ vi −ii] (1)
One should notice that the terms of the quadripole matrix might take into account nonlinear phenomena in the frequency domain.
1.2. Quadripole acausal Matrix (QM)
Thereafter, the linear system based on the transfer matrix is transformed into an acausal set of equations showing both variables and a zero vectors, as shown in equation (2 & 3).
[1 0 −T11 T12 0 1 −T21 T22] ∗ [ vo io vi ii ] = [0 0] (2) [QM] ∗ [ vo io vi ii ] = [0 0] (3)
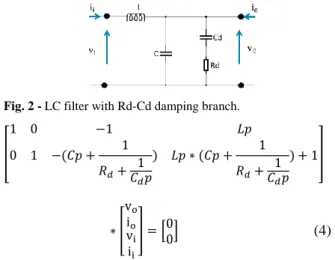
For instance, equation (4) represents the Quadripole acausal Matrix (QM) of a LC filter configuration with the addition of a shunt Rd-Cd as a damping network. This configuration is represented in figure 2.
Fig. 2 - LC filter with Rd-Cd damping branch.
[ 1 0 −1 𝐿𝑝 0 1 −(𝐶𝑝 + 1 𝑅𝑑+𝐶1𝑑𝑝 ) 𝐿𝑝 ∗ (𝐶𝑝 + 1 𝑅𝑑+𝐶1𝑑𝑝 ) + 1] ∗ [ vo io vi ii ] = [0 0] (4)
1.3. System Quadripole Matrix (SQM)
With the Quadripole acausal Matrix of each component, the “System Quadripole Matrix” is formed by gathering all of these quadripole matrices into one global matrix representing all the building blocks of the distribution network under study. In the System Quadripole Matrix, only the block diagonal terms are different from zero. For instance, the System Quadripole Matrix of an electrical distribution network that includes ‘n’ elements looks like the matrix shown in equation (5) which gathers all voltage current variables of the system.
[ QM1 0 ⋯ 0 0 QM02 ⋯ ⋯ 0 0 0 0 0 0 QMn ] ∗ [ vo1 io1 vi1 ii1 vo2 io2 vi2 ii2 ⋮ von ion vin iin] = [0⋮ 0 ] (5)
Note that the System Quadripole Matrix only integrates quadripole elements of the network without considering the topology which results from their connections; this point is considered in the following section.
2. Structural Relationships Matrix (SRM)
This second step takes into account the electrical distribution network architecture. Thereafter, structural relations are the equations that identify the connections between the different quadripoles. These relations are established using both Kirchhoff's current (KCL) and voltage (KVL) laws. Therefore, the Structural Relations Matrix is mapped for the same variable’s vector used to define the System Quadripole Matrix.
2.1. The number of Structural Relationships The number of structural relations depends on two factors: - The first one is ‘p’, the number of nodes in the network; - The second one is the number of quadripoles connected at each node. For instance, for a node connecting ‘k’ quadripoles, the number of structural relations is one for the currents (KCL) and ‘k-1’ for the voltages (KVLs).
Therefore, the total structural relation matrix is obtained by summing all structural relations for each node of the system, as shown in equation (6).
𝑇𝑜𝑡𝑎𝑙 𝑠𝑡𝑟𝑢𝑐𝑡𝑢𝑟𝑎𝑙 𝑅𝑒𝑙𝑎𝑡𝑖𝑜𝑛𝑠 = ∑ 𝑘𝑛𝑜𝑑𝑒𝑖 𝑝
𝑖=0
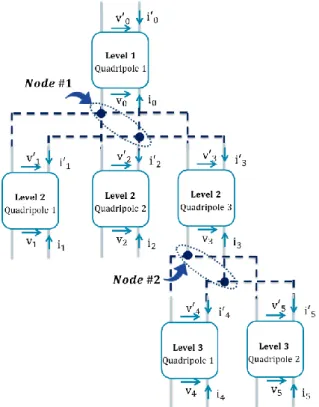
(6) An example of Electric Power Distribution, as shown in figure 3, is introduced in this section as a simple application. Two nodes are identified (#1 and #2) in a three levels electric power distribution.
Fig. 3 - Schematic representation of a simplified electric power
distribution with three distribution levels.
The first node connects 4 quadripoles; the second one connects 3 quadripoles. In this case, the number of structural relationships is 4 for the first node and 3 for the second node, resulting in a total of 7 structural relationships, as illustrated by the table 1. Node #1 Node #2 v0− v1′ = 0 v3− v4′ = 0 v0− v2′ = 0 v3− v5′ = 0 v0− v3′ = 0 i3+ i4′ + i5′ = 0 i0+ i1′ + i2′ + i3′ = 0
Table 1 - list of the structural relationships for nodes #1 and #2.
3. Electric Power System Matrix (EPSM)
In order to get a matrix describing the electrical power system under analysis, both the System Quadripole Matrix and the Structural Relations Matrix, which share the same voltage-current vector, are vertically merged in equation (7).
[EPSM] ∗ [ vo1 io1 vi1 ii1 vo2 io2 vi2 ii2 ⋮ von ion vin iin] = [SRMSQM] ∗ [ vo1 io1 vi1 ii1 vo2 io2 vi2 ii2 ⋮ von ion vin iin] = [0⋮ 0] (7)
To go further, the aim is now to identify the “causality for the analysis”, by establishing the input/output matrix related to the input variables chosen for analysis with all other variables, which can be calculated as the system’s outputs. The rank of the Electrical Power System Matrix determines the number of output variables, which are arbitrary selected. Accordingly, the input variables are the remaining system’s variables. Thereafter, the matrix connecting the inputs with the output variables is identified based on the merged Electrical Power System Matrix (equation (7)). Thus, the causal input-output matrix, equation (8), is introduced as the “Transfer Function Matrix” relating output vector with the desired input vector.
Supposing that ‘r’ is the rank of the Electrical Power System Matrix, in a system containing ‘m’ variables (Var), which can be either voltage or current, the “Transfer Function Matrix” is derived in equation (8).
(8)
For instance, the Electrical Power System Matrix’s rank of the 24 variables example introduced in figure 3 is 19. Therefore, 19 variables are to be considered as output and 5 variables as input.
Note that all calculations developed in the sections 2 and 3 can be derived analytically by means of symbolic calculation solvers; for that purpose, we have selected the Matlab’s Symbolic Toolbox. In our case, the Transfer Function Matrix, in equation (8), is the output of the ‘solve’
[ Varout1 ⋮ Varouti ⋮ Varoutr] = [TFM] ∗ [ Varin1 ⋮ Varinm−r ]
function (equations and systems solver from the Symbolic Toolbox) that solves a system of equations: it is applied for solving the Electrical Power System Matrix (equation (7)) considering specified output and input vectors.
4. Application
The application shown in this part is a simplified HVDC electric power distribution for More-Electric Aircraft integrating +/- 270 VDC voltage bus with only two loads connected in a star configuration, as shown in figure 4. In this application, each load connected to the bus through an input filter associates an inverter fed Permanent Magnet Synchronous Motor (3-Phase PMSM-1kW).
This topology is simplified in order to clarify the relevance of our modelling approach based on quadripole and frequency domain simulation and its ability to facilitate the power quality analysis. More typically, the issue is to clarifiy how this quadripole based approach allows directly analyzing the influence of power quality standard requirements on the quality of waveforms (harmonic content, rms values, resonances, etc) at the inputs/outputs of sources and loads and consequently on the weights of the connected electrical devices (especially the filters).
Fig. 4 – A simplified HVDC electric power distribution for
More-Electric Aircraft integrating a +/- 270 VDC voltage bus with 2 loads.
This application case is built of three quadripoles. The source quadripole includes one capacitor (C0= 2mF)
connected to two inductors (L0= 2.8uH) representing the
harness. Equation (9) represents its quadripole matrix (QM0). [1 0 −(C0L0p2+ 1) L0p + L0p(C0L0p2+ 1) 0 1 −C0p C0L0p2+ 1 ] ∗ [ v′0 i′0 v0 i0 ] = [00] (9)
On the other hand, both load quadripoles represent two different damped LC input filters which the structure is on Fig.2. and which values after a weight optimization are: (L1= 190uH, C1= 2.3uF, Cd1= 0.57uF, Rd1=
40Ω, L2= 306uH, C2= 1.6uF, Cd2= 0.7uF, Rd2= 42Ω).
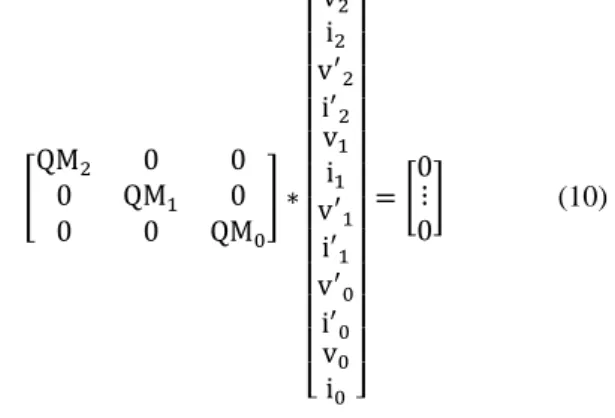
QM1 and QM2 are the same matrix as in equation (4). In the process developed in previous sections, the next step is to set up the System Quadripole Matrix, using the three Quadripole Matrices (QM0, QM1 and QM2) as shown in equation (10).
(10)
The network of our case study is then transformed into a quadripole schematic, as shown in figure 5.
Fig. 5 - Schematic representation of a simplified HVDC electric
power distribution with one source and two loads.
For this n=1 node architecture associating k=3 quadripoles, the Structural Relations Matrix reflects Kirchhoff's laws for currents (1 equation) and voltages (3-1=2 equations):
(11) (12) (13) The equations above are gathered in one matrix (14). The aggregation of both System Quadripole Matrix with the Structural Relations Matrix gives the Electrical Power System Matrix with 12 relationships. The rank of this matrix being 9, 12-9=3 variables have to be selected as the analysis inputs and nine as outputs.
For instance, choosing the source voltage and both load currents [v0, i1, i2] as the analysis input vector implies that
the remaining nine variables are considered as outputs, as in the equation (15) which sets the causality of the analysis.
[QM02 QM01 00 0 0 QM0 ] ∗ [ v2 i2 v′ 2 i′ 2 v1 i1 v′ 1 i′ 1 v′ 0 i′ 0 v0 i0] = [0⋮ 0] v0′− v1′ = 0 v0′ − v′2= 0 i0′ + i1′ + i2′ = 0
(14)
(15)
Among the capabilities of the analysis method one can emphasize: first, the analytical (symbolic) derivation of the transfer functions (Mi,j) in the frequency domain which clarifies the analysis of main couplings (typically resonant effects, etc.) between network elements. Secondly, based on the harmonic content (magnitude and phases) of the input data (here v0,i1,i2), the harmonic content of selected outputs here v2) can be numerically estimated to quantify the coupling analysis as displayed in figure 6.
Fig. 6 – Validation (by simulation) of the load voltage v2: blue harmonics represent the frequency domain calculation; these latter are superposed with harmonics (in red) issued from the PLECS® time simulator. Zooms are proposed at 20kHz, 40kHz and 60kHz
The electric network of figure 4 was also implemented using PLECS®, a time domain simulator, in order to compare and validate the results. Each load is constituted of a power drive system is here represented by a current source which harmonic content represents the harmonic pollution that
would be drawn by a 1kW permanent magnet synchronous machine fed by a voltage source inverter.
The simulation validation through the frequency analysis of the load voltage v2 is represented in figure 6, comparing both PLECS (red spectrum) and Quadripole model (in blue) for a frequency range of [0 ; 100kHz]: the results are completely overlaid, with a negligible difference lower than 0.4% for the main harmonics.
5. quality analysis based on power quality standards Civil and military aircraft manufacturers define standards, such as the MIL-STD-704 for military aircraft, in order to maintain the power quality of AC and DC electric power network and to ensure interoperability at system level. These standards set the interface between sources and loads to ensure compatibility between the aircraft electric system, external power, and airborne utilization equipment. Therefore, it give designers the specifications that they need to respect in order to ensure that an airborne system will be compatible with the power supply provided by the aircraft manufacturer.
Standards define the characteristics for different operational conditions such as power up, steady state and reconfiguration in normal, abnormal and emergency condition. However, no appropriate international standards are currently set to evaluate the power quality of the HVDC network, especially for recent concepts integrating +/- 270 VDC voltage distribution in aircraft [12].
In this part, the aeronautical standard’s requirements are “directly” integrated as the inputs of our analysis approach: the issue is to assess, thanks to the quadripole based analysis method, the influence of standards on the outputs selected to be analyzed. For this purpose, we first consider that the power source and the load 1 fulfill the quality standards: “it is like if these devices would pollute at the limit level allowed by the quality standards”. Thereafter, [v0′, i1′] are then imposed as the input vectors by considering that the output voltage (v0′) exactly involves the frequency spectrum
of fig 7 while the input current of the 1st load (i 1
′) has the
envelope of the current requirements of Fig. 8. On the other hand, the actual emitted current pollution by the load 2 (which is under analysis) is considered as a third input. The current i1′ is replaced by the maximum current
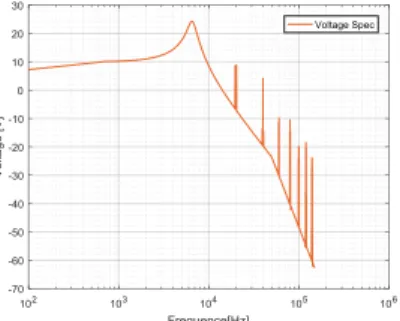
spectrum authorized by the power quality requirement as shown in figure 8. This current envelope represents the maximum pollution that this load “may emit”. In the same way, the voltage v0′ is considered as an input with the maximum voltage distortion spectrum; a typical envelope is represented in figure 7. Thus, the idea is to analyze the constraint on the device N°2, especially its voltage v2 (shown in fig. 8) when its network environment (source and load 1) fulfills the power quality requirements.
[ 0 0 0 0 0 0 −1 0 1 0 0 0 0 0 −1 0 0 0 0 0 1 0 0 0 0 0 0 1 0 0 0 1 0 1 0 0] 𝑡 ∗ [ v2 i2 v′ 2 i′ 2 v1 i1 v′ 1 i′ 1 v′ 0 i′ 0 v0 i0] = [0⋮ 0] [ v2 v2′ i2′ v1 v1′ i1′ i0 v0′ i0′] = [ M1,1 M1,2 M1,3 ⋮ ⋱ ⋮ M9,1 ⋯ M9,1 ] ∗ [ v0 i1 i2 ]
Fig. 7 - Frequency spectrum characteristics for load Voltage
specification
Fig. 8 – Frequency spectrum characteristics for the current
specification.
Fig. 9 – Voltage 𝑣2 for a frequency range of [0 ; 150kHz] when the source and the load 1 fulfill the quality requirements.
By this way, the approach allows “directly studying” the worst-case scenario with the impact of any quality requirements on the electrical device under analysis: in figure 9, the output voltage of load 2 is analyzed regarding the requirements previously considered and the current pollution of the load 1. This information is relevant for the designer of the power drive system of the analyzed load. Conclusion
The main assets of our strategy are the capability to perform symbolic and analytical calculations in the frequency domain based on selected inputs directly showing the main couplings on outputs: the description of the network topology as well as the first steps of the calculations are achieved using symbolic equations which are solved by specific symbolic calculation programs (e.g. Matlab and Maple). According to various scenarios, the mathematical relationships correlating input - output quantities can be analytically built out. In a second step, the actual implementation of each quadripole is taken into account,
using the numerical values of the electrical components. Using this approach to merge electrical distribution network with aeronautical standards may simplify the power quality analysis and may be ultimately used to reconsider and even to optimize power quality requirements, since integrating frequency spectrum into simulation software can be a tedious work to do. Using the proposed approach will simplify - eventually - the compliance to the requirements analysis.
References
[1] Liu, X, Forsyth, A, Piquet, H, Girinon, S, Roboam, X, Roux, N, Griffo, A, Wang, J, Bozhko, S, Wheeler, P, Margail, M, Mavier, J, Prisse, L, « Power Quality and Stability Issues in More-electric Aircraft Electrical Power Systems », MOET Forum EPE Conf. Barc. Spain 2009.
[2] S. Girinon, H. Piquet, N. Roux, et B. Sareni, « Analytical input filter design in DC distributed power systems approach taking stability and quality criteria into account », in 2009 13th European Conference on Power Electronics and Applications, 2009, p. 1‑10.
[3] X.Giraud, M.Budinger, X.Roboam, H.Piquet, M.Sartor, J.Faucher, ‘’Optimal design of the Integrated Modular Power Electronics Cabinet Aerospace Science and Technology’’, Elsevier AESCTE, (int Journal on Aerospace Science and Technology), Volume 48, January 2016, Pages 37–52.
[4] A. Morentin Etayo, « Methods and tools for the optimization of modular electrical power distribution cabinets in aeronautical applications », PHD Thesis of Institut National Polytechnique de Toulouse-INPT, 2017.
[5] X. Roboam, B. Sareni, A. De Andrade “More electricity in the air: Towards optimized electrical networks embedded in “more electrical aircraft”, IEEE Industrial Electronics Magazine, Vol 6, issue IV, pp 6-17, December 2012, pp 6-17,
[6] M. Sinnett, « Saving Fuel and Enhancing Operational Efficiencies », vol. AERO Q4.07, p. 6.
[7] J. Brombach, A. Lücken, T. Schröter, et D. Schulz, « Optimizing the Weight of an Aircraft Power Supply System through a +/- 270 VDC Main Voltage », Przegląd Elektrotechniczny, vol. R. 88, nr 1a, p. 47‑50, 2012.
[8] Girinon S., Baumann C., Piquet H., Roux N. Analytical modeling of the input admittance of an electric drive for stability analysis purposes, The European Physical Journal - Applied Physics,(47) 1, p.11101, 2009
[9] Charrada M., Girinon S., Piquet H., Roux N. Equipments characterization methods for stability analysis of DC networks IEEE International Symposium on Industrial Electronics, Gdansk, Poland, 2011.
[10] « IEEE Recommended Practice and Requirements for Harmonic Control in Electric Power Systems », IEEE Std 519-2014 Revis. IEEE Std 519-1992, p. 1‑29, juin 2014.
[11] T. M. Blooming et D. J. Carnovale, « Application of IEEE STD 519-1992 Harmonic Limits », in Conference Record of 2006 Annual Pulp and Paper Industry Technical Conference, 2006, p. 1‑9.
[12] I. Moir, A. Seabridge, Aircraft Systems: Mechanical, Electrical, and Avionics Subsystems Integration. John Wiley & Sons, 2011. [13] M. Beltramini, L. Prisse, P. Asfaux, N. Roux, F. Richardeau, X. Roboam, F. Costa, B. Revol, Comparison of different inverter topologies and controls in terms of conducted EMI, IEEE-ICIT 2010 (International Conference on Industrial Technology), Valparaiso, Chile,14th March- 17th March, 2010.