Publisher’s version / Version de l'éditeur:
ASHRAE Transactions, 108, Pt. 1, pp. 724-730, 2002-06-01
READ THESE TERMS AND CONDITIONS CAREFULLY BEFORE USING THIS WEBSITE. https://nrc-publications.canada.ca/eng/copyright
Vous avez des questions? Nous pouvons vous aider. Pour communiquer directement avec un auteur, consultez la première page de la revue dans laquelle son article a été publié afin de trouver ses coordonnées. Si vous n’arrivez pas à les repérer, communiquez avec nous à PublicationsArchive-ArchivesPublications@nrc-cnrc.gc.ca.
Questions? Contact the NRC Publications Archive team at
PublicationsArchive-ArchivesPublications@nrc-cnrc.gc.ca. If you wish to email the authors directly, please see the first page of the publication for their contact information.
NRC Publications Archive
Archives des publications du CNRC
This publication could be one of several versions: author’s original, accepted manuscript or the publisher’s version. / La version de cette publication peut être l’une des suivantes : la version prépublication de l’auteur, la version acceptée du manuscrit ou la version de l’éditeur.
Access and use of this website and the material on it are subject to the Terms and Conditions set forth at
Computational and experimental study of smoke flow in the stair shaft
of a 10-story tower
Hadjisophocleous, G. V.; Fu, Z.; Lougheed, G. D.
https://publications-cnrc.canada.ca/fra/droits
L’accès à ce site Web et l’utilisation de son contenu sont assujettis aux conditions présentées dans le site LISEZ CES CONDITIONS ATTENTIVEMENT AVANT D’UTILISER CE SITE WEB.
NRC Publications Record / Notice d'Archives des publications de CNRC:
https://nrc-publications.canada.ca/eng/view/object/?id=66e8c6f6-2ad5-4aa2-aa67-306849a6a076 https://publications-cnrc.canada.ca/fra/voir/objet/?id=66e8c6f6-2ad5-4aa2-aa67-306849a6a076Computational and experimental study of smoke flow
in the stair shaft of a 10-story tower
Hadjisophocleous, G.V.; Fu, Z.; Lougheed, G.D.
A version of this document is published in / Une version de ce document se trouve dans : ASHRAE Transactions, v. 108, pt. 1, 2002, pp. 724-730
www.nrc.ca/irc/ircpubs
The following paper was published in ASHRAE Transactions, Vol.
108, Pt. 1.
2002 American Society of Heating, Refrigerating
and Air-Conditioning Engineers, Inc.
This posting is by permission of ASHRAE and is presented for
educational purposes only.
ASHRAE does not endorse or recommend commercial products or
services. This paper may not be copied and/or distributed
electronically or in paper form without permission of ASHRAE.
Contact ASHRAE at
www.ashrae.org.
724 ASHRAE Transactions: Symposia
ABSTRACT
CONTAMW is an indoor air quality analysis network model developed to determine airflow and contaminant concentrations in each compartment of a building. In addition to its applicability in indoor environment modeling, CONTAMW is also used to model smoke control systems in multi-story buildings. This study investigates whether this model can accurately predict smoke movement in a multi-story building by comparing its predictions with data from experi-ments conducted in the 10-story test facility of the National Research Council of Canada (NRC).
The 10-story experimental facility at NRC was designed to simulate the center core of a high-rise building, including corridors and stair and elevator shafts. Various vents on the external and internal walls can be opened or closed to simulate the leakage area of typical buildings. Comparisons with two sets of experimental data are presented in this paper. In the first experiment, a propane burner was used to produce a constant heat release rate of 1 MW. In the second experiment, a couch was used as the fuel with the average heat release rate being 730 kW. The measured CO2 concentrations and pressure in the stair shaft are compared with the results predicted using the model. The results indicate that the model underpredicts the CO2 concentrations. A large difference between predicted and measured pressure also exists. In addition, the two-zone model FIERAsmoke is used to predict CO2 concentrations in the stair shaft. The two-zone model predictions compare better with the experimental data than the predictions of the network model.
INTRODUCTION
The stair shafts in a multi-story building are one of the means of smoke spread between floors, and there are many fire incidents where building occupants have died in stair shafts or corridors of floors above the fire floor due to smoke inhalation while attempting to evacuate (Proulx 1996). There are mainly three modeling approaches that can be used for this problem (Hadjisophocleous and Fu 1999; Milke and Mowrer 1994): network models, zone models, and CFD models.
CONTAMW is a network model that treats each compart-ment in a building as a single zone (Dols et al. 2000). It is mainly used to model indoor air quality by calculating airflow and contaminant concentrations. Its ability to calculate build-ing airflow is useful to assess the adequacy of ventilation rates, the variation in ventilation rates, and the distribution of venti-lation air. The prediction of contaminant concentrations can be used to determine the indoor air quality performance of a building and investigate the impacts of various design deci-sions. This model has a very good user interface in which all the components of the building, such as walls, compartments, and vents, can be schematically drawn using drawing tools and libraries of icons. Various parameters associated with each component can be conveniently entered through the interface. It also allows a user to view the simulation results on the screen or output them to a file for further analysis.
The model does not consider heat transfer and energy balance, and thus the temperature of each zone cannot be predicted but has to be input as a constant value. Due to its abil-ity to predict contaminant flow in a building, the model is used to simulate smoke movement in high-rise buildings and to assist in the design of smoke management systems.
Computational and Experimental
Study of Smoke Flow in the
Stair Shaft of a 10-Story Tower
George Hadjisophocleous, Ph.D., P.E.
Zhuman Fu, Ph.D.
Gary Lougheed, Ph.D.
Member ASHRAEGeorge Hadjisophocleous is a professor and Zhuman Fu is a post-doctoral fellow in the Department of Civil and Environmental Engineering, Carleton University, Ottawa, Ontario, Canada. Gary Lougheed is a senior research officer in the Fire Risk Management Program, Institute for Research in Construction, National Research Council Canada, Ottawa.
ASHRAE Transactions: Symposia 725
This study uses CONTAMW to simulate experiments performed in the 10-story experimental tower facility of NRC. This facility was designed to simulate the center core of a high-rise building, including corridors and stair and elevator shafts. Various vents on the external and internal walls can be opened or closed to simulate the leakage area of typical buildings. Two experiments were compared with the model predictions. One experiment used propane as fuel, another one used a couch as fuel. CO2 concentrations and pressure in the stair shaft are the
two parameters compared with the model predictions. This paper also includes comparisons of predictions obtained from a two-zone smoke movement model FIERAsmoke (Fu and Hadjisophocleous 2000).
In the following, the experimental facility is described and then the two-zone model FIERAsmoke. Finally, the experimental results and the predictions of CONTAMW and FIERAsmoke are compared and analyzed.
DESCRIPTION OF THE FACILITY
Experiments were conducted in a 10-story experimental facility at NRC. This facility was designed to simulate a high-rise building, including corridors and stair and elevator shafts. Various vents on the external and internal walls can be opened or closed to simulate the leakage area of typical buildings. Figure 1 shows the floor plan of the facility.
As shown in Figure 1, the floor is divided into two parts: service area and test area. The doors between the test and service areas were closed during the tests, so the service area is not considered in the calculations. In the test area, there are a number of compartments on each floor. The main compart-ment, the east and west corridors, the stair shaft lobby, and stair shaft are connected through various vents. None of the other compartments within the test area, such as the elevator shafts as shown in Figure 1, were connected to the smoke flow path during these tests. Thus, these compartments were not considered in the calculations. In addition, to simplify the problem, in the model the stair hall is combined with the west corridor due to its small size. With these simplifications, four compartments were modeled on each floor: main compart-ment, east corridor, west corridor, and stair shaft. The dimen-sions of each compartment are given in Table 1.
The main compartments are connected directly to the east corridors. Between the east and west corridors of each floor, there is an open standard door. Both east and west corridors have a small wall vent connected to the outside representing wall leakage. There is a small vent between the west corridor and the stair shaft also representing a specified leakage area. In addition, there is a standard door between the stair hall and stair shaft on the fire floor, which is open during the tests. The dimensions of all the openings, including doors and vents, are given in Table 2.
In the tests, the fire was located in the main compartment on the second floor. Concentrations of carbon dioxide in the stair shaft on the second, sixth, eighth, and tenth floors were measured. Temperature in the stair shaft was also measured. Only one point measurement was made for the CO2
concen-tration and temperature of each floor. The measuring point was at the mid-height between the two floors. In this study, the measured CO2 concentrations and temperatures are assumed
to represent the smoke layer values on that floor. These data will be compared with the model predictions.
DESCRIPTION OF THE TWO-ZONE MODEL
A two-zone smoke movement model was developed and coded using Visual Basic. Details of the model are provided in Fu and Hadjisophocleous (2000). This paper gives a brief description of the conservation equations of the model and the fire submodels, as well as a detailed description of the stair shaft flow model.
Figure 1 Floor plan of the 10-story smoke tower.
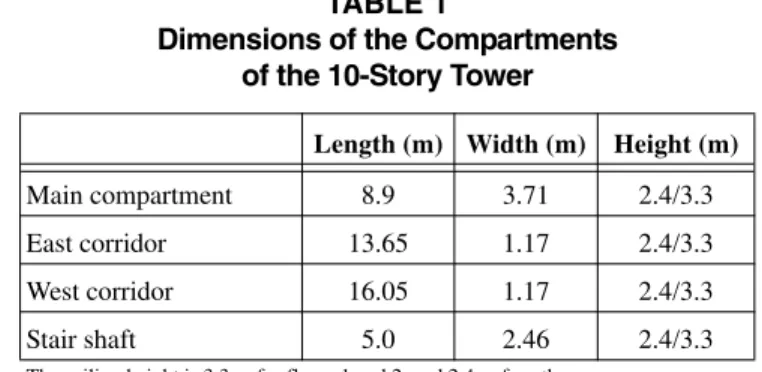
TABLE 1
Dimensions of the Compartments of the 10-Story Tower
Length (m) Width (m) Height (m)
Main compartment 8.9 3.71 2.4/3.3 East corridor 13.65 1.17 2.4/3.3 West corridor 16.05 1.17 2.4/3.3 Stair shaft 5.0 2.46 2.4/3.3
The ceiling height is 3.3 m for floors 1 and 2, and 2.4 m for others.
TABLE 2
Dimensions of the Vertical-Vents of the Building
Sill Height (m) Soffit Height (m) Width (m) Da-c (2) 0 3.3 1.17 Da-c (1, 3-10) 0 2.1 0.9 Dc-s (2) 0 2.1 0.9 Dc-c (1-10) 0 2.1 0.9 Vc-o (1-10) 1.43 1.56 0.28 Vc-s (1-10) 1.46 1.59 0.13
D: door, V: wall vent, a: main compartment, c: corridor, o: outside, s: stair shaft, (i): floor i
726 ASHRAE Transactions: Symposia
Conservation Equations and Numerical Technique
Ordinary differential equations (ODEs) are derived for the two zones in compartments with fire or smoke. The four independent variables of the ODEs for each compartment are the pressure, enthalpy of the upper layer, and the masses of the upper and lower layers. Nonlinear algebraic equations based on mass conservation are solved, instead of the ODEs, in compartments without smoke or fire. To solve the governing equations for the whole building, the model uses a new numer-ical method, referred to as room-by-room iteration method, rather than the traditional simultaneous solution method. This method solves the governing equations one room at a time and can employ different numerical methods for different compartments. In this model, either an ODE solver or a nonlinear algebraic equation solver is used to solve the governing equations of each room depending on the presence or not of fire or smoke in that compartment.
Combustion and Chemistry
Combustion is determined based on the calculation of fuel and oxygen mass in the fire plume. It is assumed that if the fuel to oxygen ratio in the fire plume is less than the stoichi-ometric ratio, then combustion takes place as in open air. If not, combustion is constrained by the available oxygen based on the oxygen consumption principle. A specification combustion chemistry model is used. The mass ratios of C, H, and O in the fuel are specified as input data. The mass ratios of CO and soot relative to the mass of carbon-related products (CO2+CO+soot) are also specified. In addition, the mass ratio
of any toxic species produced can also be included.
Fluid Flow
Two plume models are used: the McCaffrey’s (1983) model, and Heskestad’s (1995) model with constant coeffi-cients and ignoring virtual origin correction. Also, a mechan-ical ventilation model is included. Smoke can be extracted from, or air can be supplied into, compartments through an opening. Two parameters can be specified, the vertical exten-sion of the opening into the compartment from the ceiling and the mechanical volume or mass ventilation rate. Mass flow through a vertical vent (doors and windows) is calculated by integrating Bernoulli’s equation along the vertical direction of the vent. Mass flow through a horizontal vent is calculated using Cooper’s model for shallow, horizontal, circular vents under high Grashof number conditions (Cooper 1996). If the high Grashof number condition is not met, then Bernoulli’s equation is directly used.
Heat Transfer
To calculate conductive heat transfer through the compartment boundaries, a one-dimensional transient conduction model is used. In a fire room, heat loss at the ceil-ing surface and the upper wall due to a ceilceil-ing jet is calculated using the correlation given by Cooper (1982) and Motevalli and Ricciuti (1992). In this model, the ceiling surface is
converted into an equivalent circular surface with the same area, and the plume impingement point is assumed to be at the center of the surface. Heat transfer for other surfaces is consid-ered to be by natural convection, and empirical equations for turbulent convective heat transfer are used. For radiant heat transfer, a two-surface model is used. The flame is assumed to be a sphere with its center located at the position of half the flame height above the fuel bed, and the radiant flux of the sphere to any direction is assumed to be uniform. The smoke layer is considered to be an absorptive medium, and the lower layer is considered to be transparent.
Stair Shaft Flow
When dealing with multi-story buildings, it is important to compute the mass or volume flow rate through a stair shaft because a stair shaft is one path for smoke spread from floor to floor. Achakji and Tamura (1994) conducted research on pressure drop characteristics of typical stair shafts in high-rise buildings. It was found that pressure drop through a stair shaft can be represented by a pressure loss across an equivalent horizontal orifice located between floors of a frictionless stair shaft.
The equation for calculating the effective orifice area is as follows:
(1)
where Aei is the effective orifice area on the ith floor, As is the
cross-sectional area of the stair shaft, Cd is the coefficient of
discharge taken as 0.6 in Achakji and Tamura (1994), k is the friction pressure loss coefficient (29 for the open tread case and 32 for the closed tread case), hi is the height of the shaft
between the ith floor and (i-1)th floor, De is the equivalent
diameter, which can be calculated using the stair shaft cross-sectional area As and the perimeter of the shaft P as follows:
(2) Equation 1, however, does not include the effect of people in the stair shaft. To account for this, the approach used in CONTAM is followed:
(3)
where di is the density of people in the stairs between the ith
floor and (i-1)th floor, and β is constant (0.14 for the open tread case and 0.24 for the closed tread case).
In FIERAsmoke, the equivalent area Aei is obtained from
Equation 3. Cooper’s (1996) ceiling vent flow model is used to calculate the volumetric flow rate through the equivalent ceiling vent. Aei AS --- 1 Cd k hi De --- 1 2 --- ---= De 4AS P ---= Aei AS ---1.0–β di Cd k hi De --- 1 2 --- ---=
ASHRAE Transactions: Symposia 727
RESULTS
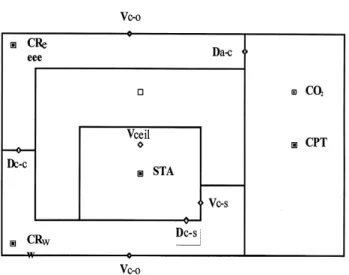
The experimental facility was modeled in CONTAMW as shown in Figure 2. Only the compartments in the test section of the facility are modeled. The observation area of the floor was completely isolated from the test so it was not necessary to include this part of the facility in the model.
Data from two tests conducted in the test facility are used for comparisons with the model predictions. In the first test, the fuel used was propane, with the fire size maintained steady at 1 MW. In the second test, a couch was used as the fuel.
Test 1 was simulated using a constant CO2 production rate produced by the 1 MW propane fire. The input value was 0.0682 kg/s. In addition, the temperatures measured in the stair shaft, listed in Table 3, were used as input to the model. Temperatures in the corridor and main compartment on the fire floor were predicted using the two-zone model FIERA-smoke. The temperatures of the corridors and main compart-ments on the other floors were not measured, and the initial temperature in those compartments was used. Runs conducted with CONTAMW showed that these temperatures did not affect the predictions considerably.
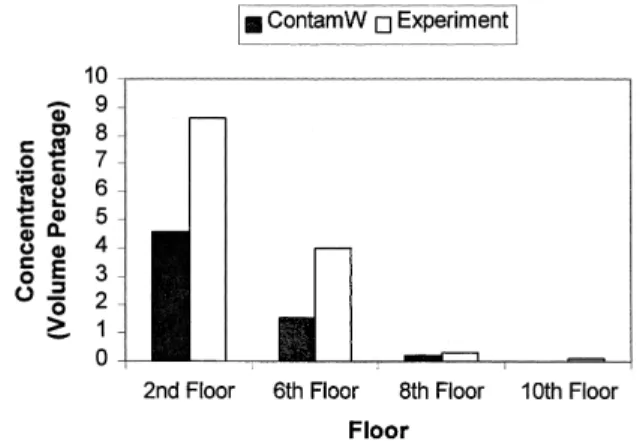
As with the experiment, the simulation was run for 15 minutes. Figure 3 shows a comparison of the CO2
concentra-tions predicted by CONTAMW in the stair shaft and the exper-imental data at 15 minutes. The predictions are significantly lower than the experimental data. Variations also exist between the experimental and predicted pressures shown in Figure 4.
The heat release rate measured in the open air for Test 2 is shown in Figure 5. As shown in this figure, the fire grows
rapidly to 2.4 MW in about 2.5 minutes. It remains at that level for about 1 minute and then decreases rapidly to about 0.4 MW and stays there until 10 minutes, which is the simulation time. Since the duration of the high heat release rate is short, the mean value of the heat release rate during the 10-minute period was used as input to CONTAMW. The value used was 0.73 MW. The corresponding CO2 production rate is 0.0708kg/s, which is calculated based on the measured yields of species.
CPT: main compartment; CRe: east corridor; CRw: west corridor; STA: stair-well; Da-c: door between main compartment and corridor; Dc-s: door between west corridor and stair shaft on the fire floor; Vc-o: vent between corridor and outside; Dc-c: door between east corridor and west corridor; Vc-s: vent be-tween corridor and stairwell; Vceil: ceiling vent bebe-tween neighboring floors; Ambt: ambient.
Figure 2 Plan of smoke tower in CONTAMW.
Figure 3 Comparison of CONTAMW predicted CO2 concentrations with experimental data for Test 1.
Figure 4 Comparison of CONTAMW predicted pressures with experimental data for Test 1.
728 ASHRAE Transactions: Symposia
For Test 2, the experimental temperatures in the stair shaft, listed in Table 4, were used as input to CONTAMW. Temperatures in the corridor and main compartment on the fire floor were from the FIERAsmoke prediction. The initial temperatures were used for all other locations.
The results of this simulation are shown in Figures 6 and 7. Figure 6 shows a comparison of the experimental and predicted temperatures in the stair shaft. Similarly to Test 1, CONTAMW underpredicts CO2 concentrations in the stair
shaft. The predicted pressures also differ from the experimen-tal values.
Comparison with Two-Zone Model
The two-zone model was used to simulate Test 1. Figure 8 shows a schematic diagram that demonstrates how the
10-story facility was modeled. On the second floor (fire floor), the fire compartment, the east corridor, and the west corridor are considered as separate compartments. On any other floor, the corridors and the main compartment are treated as a single compartment. The stair shaft was divided into 10 compart-ments, one compartment per floor.
TABLE 3
Temperatures Used as Input to CONTAMW for Test 1
Floor CPT (°C) CRe (°C) CRw (°C) STA (°C)
1 21 21 21 21 2 559 380 213 150* 3 21 21 21 115* 4 21 21 21 80* 5 21 21 21 60* 6 21 21 21 50* 7 21 21 21 40* 8 21 21 21 40* 9 21 21 21 35* 10 21 21 21 33* * Experimental data TABLE 4
Temperatures Used as Input to CONTAMW for Test 2
Floor CPT (°C) CRe (°C) CRw (°C) STA (°C)
1 21 21 21 21 2 431 320 180 91* 3 21 21 21 85* 4 21 21 21 61* 5 21 21 21 45* 6 21 21 21 40* 7 21 21 21 31* 8 21 21 21 26* 9 21 21 21 24* 10 21 21 21 23* * Experimental data
Figure 6 Comparison of CONTAMW predicted CO2 concentrations with experimental data for Test 2.
Figure 7 Comparison of CONTAMW predicted pressures with experimental data for Test 2.
Figure 8 Geometry of smoke tower used in the two-zone model.
ASHRAE Transactions: Symposia 729
The CO2 concentration results of the two-zone model are
compared with the experimental data and CONTAMW predictions in Figures 9 and 10. As the figures show, the two-zone model predictions generally compare well with the experimental data.
DISCUSSION
CONTAMW was used to simulate the concentrations of CO2 in the stair shaft of a 10-story experimental facility. Two cases were studied, one with a steady propane fire and the other with a couch as the burning item. The average CO2 production rate in the fire compartment was specified to provide the smoke source to the stair shaft. As this model does not consider heat transfer phenomena and energy balance, the temperature of each zone has to be input.
CO2 concentrations in the stair shaft on the second, sixth,
eighth, and tenth floors were compared with CONTAMW predictions. It was found that the model underpredicts CO2
concentrations, as well as the pressure difference between the stair shaft and the fire corridor. The results of the two-zone model were also compared with the experimental data and CONTAMW predictions and found to generally compare well with the experimental data.
From the above comparison results, it can be seen that CONTAMW predicts much lower CO2 concentrations in the
stair shaft than the experimental data. This demonstrates that in its present form, this model may not be well suited for smoke movement predictions, especially in cases like the one simulated in this paper, where stair shaft pressurization is not used. In other studies where comparisons were made between network models and experimental data, the problem consid-ered was one with pressurized stairwells (Said and MacDonald 1991). The results indicate that the model is better suited for pressure rather than buoyancy-driven situations. In addition, for the near fire compartments, the single-zone approach is not valid; hence, two zones should be used.
Simi-lar findings are reported in Upham et al. (2001), who have used the model to study contaminant migration in tall buildings. They report that poor mixing of the tracer gas caused signifi-cant discrepancies between predictions and experimental data. In addition, in the stairwell, the model does not consider the bidirectional flow mechanism of a ceiling vent. When hot smoke stays under a ceiling vent, even if there is no pressure difference, hot smoke will flow up through the vent because of the buoyancy induced by temperature or density difference. In the two-zone model, the stair shaft on each floor is treated as a separate compartment and mass flow between neighboring floors through the stair shaft is treated as a flow through an equivalent circular ceiling vent. Cooper’s (1996) model, which accounts for the bidirectional flow mechanism of a ceil-ing vent, is used to calculate the volumetric flow rate through the equivalent ceiling vent. That may be why the two-zone model provides better predictions for the CO2 concentrations
in the stair shaft.
REFERENCES
Achakji, G.Y., and G.T. Tamura. 1998. Pressure drop charac-teristics of typical stairshafts in high-rise buildings. ASHRAE Transactions 94(1):1223-1237.
Cooper, L.Y. 1996. Calculating combined buoyancy- and pressure-driven flow through a horizontal, circular vent —Application to a problem of steady burning in a ceil-ing-vented enclosure. Fire Safety Journal 27: 23. Cooper, L.Y. 1982. Heat transfer from a buoyant plume to an
unconfined ceiling. ASME Journal of Heat Transfer 104: 446.
Dols, W. Stuart, G.N. Walton, and K.R. Denton. 2000. CON-TAMW 1.0 User Manual, NISTIR 6476. Gaithersburg, Md.: National Institute of Standards and Technology. Fu, Z., and G. Hadjisophocleous. 2000. A two-zone fire
growth and smoke movement model for multi-compart-ment buildings. Fire Safety Journal 34: 257.
Figure 9 Comparison of experimental data, CONTAMW predictions and results of two-zone model for Test 1.
Figure 10 Comparison of experimental data, CONTAMW predictions and results of two-zone model for Test 2.
730 ASHRAE Transactions: Symposia
Hadjisophocleous, G.V., and Z. Fu. 1999. Modeling smoke conditions in large compartments equipped with mechanical exhaust using a two-zone model. Interna-tional Journal of Engineering Performance-Based Fire Codes 1: 162.
Heskestad, G. 1995. Fire plumes. SFPE Handbook of Fire Protection Engineering, pp. 2-9. Quincy, Mass.: National Fire Protection Association.
McCaffrey, B.J. 1983. Momentum implications for buoyant diffusion flames. Combustion and Flame, 52: 149. Milke, J.A., and F.W. Mowrer. 1994. Computer-aided design
for smoke management in atria and covered malls. ASHRAE Transactions 100(2): 448-456.
Motevalli, Y., and C. Ricciuti. 1992. Characterization of the confined ceiling jet in the presence of an upper layer in transient and steady-state conditions. NIST-GCR-92-613. Gaithersburg, Md.: National Institute of Standards and Technology.
Proulx, G. 1996. Critical factors in high-rise evacuations. Fire Prevention 291: 24. Borehamwood, England. Said, M.N.A., and R.A. MacDonald. 1991. An evaluation of
a network smoke control model. ASHRAE Transactions 97(1).
Upham, R.D., G.K. Yuill, and W.P. Bahnfleth. 2001. A vali-dation study of multizone airflow and contaminant migration simulation programs as applied to tall build-ings. ASHRAE Transactions 107(2).