READ THESE TERMS AND CONDITIONS CAREFULLY BEFORE USING THIS WEBSITE.
https://nrc-publications.canada.ca/eng/copyright
Vous avez des questions? Nous pouvons vous aider. Pour communiquer directement avec un auteur, consultez la
première page de la revue dans laquelle son article a été publié afin de trouver ses coordonnées. Si vous n’arrivez
Questions? Contact the NRC Publications Archive team at
PublicationsArchive-ArchivesPublications@nrc-cnrc.gc.ca. If you wish to email the authors directly, please see the first page of the publication for their contact information.
NRC Publications Archive
Archives des publications du CNRC
This publication could be one of several versions: author’s original, accepted manuscript or the publisher’s version. / La version de cette publication peut être l’une des suivantes : la version prépublication de l’auteur, la version acceptée du manuscrit ou la version de l’éditeur.
Access and use of this website and the material on it are subject to the Terms and Conditions set forth at
Resistance tests in ice with the USCGC Healy
Jones, S. J.; Moores, C.
https://publications-cnrc.canada.ca/fra/droits
L’accès à ce site Web et l’utilisation de son contenu sont assujettis aux conditions présentées dans le site LISEZ CES CONDITIONS ATTENTIVEMENT AVANT D’UTILISER CE SITE WEB.
NRC Publications Record / Notice d'Archives des publications de CNRC:
https://nrc-publications.canada.ca/eng/view/object/?id=3692e638-92f9-4128-925f-2858454c0c43 https://publications-cnrc.canada.ca/fra/voir/objet/?id=3692e638-92f9-4128-925f-2858454c0c43
Ice in the Environment: Proceedings of the 16th IAHR International Symposium on Ice Dunedin, New Zealand, 2nd–6th December 2002
International Association of Hydraulic Engineering and Research
RESISTANCE TESTS IN ICE WITH THE USCGC HEALY
Stephen J. Jones1 and Corwyn Moores1
ABSTRACT
Model tests to measure the resistance of a 1:23.7 scale model of the USCGC Healy in ice were conducted at IMD. Results showed that the total ice resistance, which was equal to the total resistance minus the open water resistance, was linearly dependent on velocity, and proportional to ice thickness squared, for constant ice strength and velocity. The model was tested at two hull-ice friction coefficients and the results showed that the hull-ice friction coefficient had a greater effect in thicker ice, but was independent of velocity. Results from varying the ice strength showed an effect, which increased considerably with ice thickness. At 27 mm ice thickness, doubling the ice strength caused RIT to increase by about 25 %; at 76 mm ice thickness, doubling the ice
strength caused a 40 % increase in RIT.
INTRODUCTION
Following a successful set of full-scale trials of the USCGC Healy, the Institute for Marine Dynamics undertook a complete set of model tests at a scale of 1:24 for correlation purposes. The full-scale trials are described in papers in the proceedings of the POAC 2001 conference (Frederking et al., 2001). In particular we wanted to correlate the powering requirements of the ship and model in level ice, the maneuvering characteristics as measured by turning circles, and to show the effect of ice strength on power required. This last was important because the full-scale trials had taken place in ice of approximately half the strength of that specified in the design requirements for the ship. This paper concentrates on the ice resistance tests conducted in 2001.
MODEL DETAILS
Model 546 was constructed, in accordance with IMD’s standard method, at a scale of 1:23.7. This scale was chosen so that we could use an existing set of propellers, namely our R-Class propellers 66L and 66R. The model’s principal dimensions are listed in Table 1.
1 National Research Council of Canada, Institute for Marine Dynamics, P.O. Box 12093, Stn. A, St.
Table 1: Particulars of Model 546
Overall length (LOA) 5.40 m
Length between perpendiculars (LBP) 5.10 m
Maximum beam 1.05 m
Depth at midships (D) 0.54 m
Design waterline (DWL) 0.36 m
Draft at even trim 0.37 m
Vertical C. of G. (VCG) 0.416 m
Displacement 1240 kg
A non-removable ice knife and two bossings, also non-removable, were fitted, together with the twin rudders and propellers. The model is shown in Fig. 1 below. Two hull-ice friction coefficients were used, 0.015 (low friction) and 0.034 (high friction). Twelve ice sheets were used for the resistance tests in order to vary the ice thickness as 27, 39, 58, and 73 mm corresponding to 63, 92, 137 and 174 cm full-scale for which full-scale performance data existed; the ice strength from 16-59 kPa corresponding to 380-1400 kPa full-scale; and the two friction coefficients. The ice density was maintained constant over the different ice sheets at 870 ± 30 kg/m3.
Figure 1: The USCGC Healy 1:23.7 scale model in the IMD ice tank. RESULTS
Open Water Results
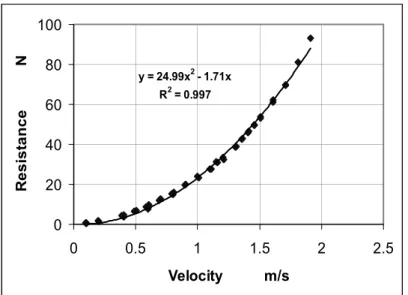
Open water resistance tests were conducted. Since the open water term is a small contribution to the total icebreaking resistance, a least squares polynomial was fitted to the data, as shown in Fig. 2, and this was used to calculate the open water term as needed.
Figure 2: Open water resistance of the USCGC Healy model 546. Ice Resistance Results
The open water resistance (Fig. 2) was first subtracted from the total resistance in ice to give RIT, the total ice resistance. This was then used for the analysis in the figures
below.
Effect of Velocity
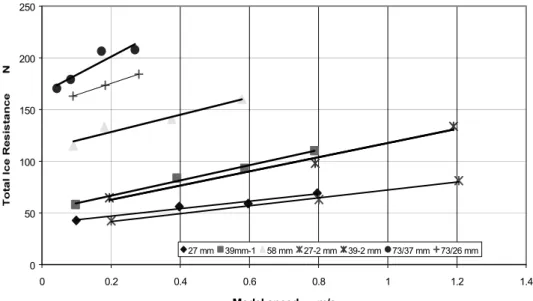
Fig. 3 below shows the total ice resistance results for the high friction (0.034) model as a function of velocity for different ice thicknesses, all for constant ice strength of 33±3 kPa. There is a linear dependence of ice resistance on velocity in Fig. 3. For example, when hi=39 mm, ice flexural strength σf = 33 kPa, and ice-hull friction
coefficient = 0.034, the total ice resistance was given by:- 1 . 49 v 5 . 68 RIT = +
where v is the velocity in m/s and RIT is in Newtons. Data are also shown for two
different ice sheets of the same nominal thickness, 27 and 39 mm, and the resistance results are seen to be in good agreement even before any “corrections” of the data for slight differences in ice thickness or strength are made.
Effect of Ice Thickness
Fig. 4 below shows the total ice resistance as a function of ice thickness for different velocities, at constant ice strength. It can be seen that the effect of ice thickness is non-linear and the resistance increases approximately as the square of the ice thickness. The equation shown on Fig. 4 is a best fit to the 0.1 m/s data, and at 0.4 m/s, and 33 kPa:-
35 . 1 h 02 . 0 RIT = 2i +
where hi is in mm, and RIT in Newtons.
y = 24.99x2 - 1.71x R2 = 0.997 0 20 40 60 80 100 0 0.5 1 1.5 2 2.5 Velocity m/s R esi st an ce N
Effect of Friction
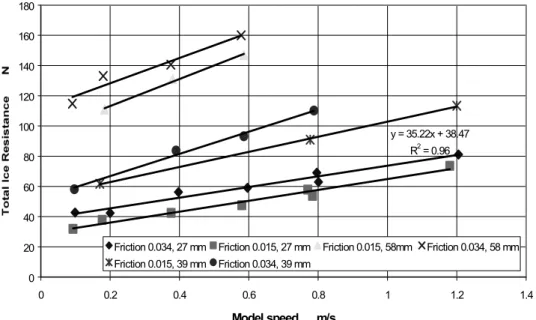
We investigated the effect of hull-ice friction coefficient on the ice resistance. Fig. 5 below shows the effect of changing the friction coefficient from 0.015 to 0.034 on the total ice resistance, for three different ice thicknesses. Fig. 5 shows that in thin ice of 27 mm thickness, the effect of approximately doubling the friction coefficient from 0.015 to 0.034, increased the total ice resistance by about 10 N or about 15 % depending on speed. In thick ice of 58 mm, the resistance was also increased by about 15 %. This result is consistent with our earlier correlation studies of the R-Class icebreaker (Spencer and Jones, 2001), and of other ships.
Figure 3: Total ice resistance for the high friction Healy model as a function of velocity for different ice thicknesses. Ice strength was maintained constant at 33 ± 3 kPa.
Figure 4: Total ice resistance for the high friction Healy model as a function of ice thickness for different velocities as shown. Ice strength constant at 33±3 kPa.
0 50 100 150 200 250 0 0.2 0.4 0.6 0.8 1 1.2 1.4 Model speed m/s 27 mm 39mm-1 58 mm 27-2 mm 39-2 mm 73/37 mm 73/26 mm y = 0.02x2 + 0.82x R2 = 0.98 0 50 100 150 200 250 0 10 20 30 40 50 60 70 80 Ice Thickness mm V=0.2 m/s V=0.1 m/s V=0.4 m/s V=0.8 m/s V=1.2 m/s
Figure 5: Effect of ice-hull friction coefficient on the total ice resistance for the Healy model as a function of velocity.
Effect of Ice Strength
Fig. 6 below shows the effect of ice strength on the resistance of the Healy model. The results showed an effect, which increased considerably with ice thickness, as shown by the slope of the lines in Fig. 6. At 27 mm ice thickness, doubling the ice strength caused RIT to increase by about 25 %; at 76 mm ice thickness, doubling the ice strength
caused a 40 % increase in RIT.
Figure 6: Ice resistance as a function of ice flexural strength for two ice thicknesses and three velocities. y = 35.22x + 38.47 R2 = 0.96 0 20 40 60 80 100 120 140 160 180 0 0.2 0.4 0.6 0.8 1 1.2 1.4 Model speed m/s
Friction 0.034, 27 mm Friction 0.015, 27 mm Friction 0.015, 58mm Friction 0.034, 58 mm Friction 0.015, 39 mm Friction 0.034, 39 mm 76 mm 27 mm y = 0.83x + 30.40 R2 = 0.8 0 50 100 150 200 250 0 10 20 30 40 50 60
Ice Flexural Strength kPa
This result is significant because the full-scale trials were conducted in ice of about 315 kPa, when the design condition for the ship had specified 690 kPa. The ship had been designed for “continuous icebreaking at 3 knots through 4.5 ft (1.37 m) of ice of 100 psi (690 kPa) strength”. The mean strength during the full-scale trials was 315 kPa (Jones et al., 2001) a factor of 2.2 weaker than the design strength. These resistance results show that the power requirements of the ship would have had to be between 25 % and 40 % higher than those measured on the full-scale trials, for the ship to have broken the same thickness of ice of the design strength. On the trials, the ship broke 1.37 m of ice of 315 kPa flexural strength while traveling at 3 knot, using 20,000 hp. Our present results suggest that had the ice had a flexural strength of 690 kPa , the power required would have been about 30 % greater or 26,000 hp. This is still within the capability of the Healy, which can generate a maximum power of 30,000 hp.
DISCUSSION AND CONCLUSIONS
Resistance tests on a 1:23.7 model scale of the USCGC Healy have shown that the ice resistance, excluding open water resistance, is directly proportional to velocity, and to ice thickness squared. The effect of hull-ice friction coefficient is significant as is the effect of ice strength. This last dependence is used to estimate the performance of the Healy at full-scale in ice of its design strength, and we conclude that the ship would have met its design performance requirements even if the ice strength during the trials had been 690 kPa instead of the 315 kPa as found. Further propulsion and maneuvering model tests are now underway at IMD.
ACKNOWLEDGMENT
We are grateful to many people at IMD who built the model and assisted with all the testing.
REFERENCES
Frederking, R., Kubat, I. and Timco, G. (eds). In Proceedings of POAC ’01, Vol. 2, National Research Council of Canada, Ottawa (2001) 891–973.
Jones S.J., Kirby, C., Meadus, C., Tucker, W., Gagnon, J., and Elder, B. Sea ice properties on the USCGC Healy ice trials. In Proceedings of POAC ’01, National Research Council of Canada, Ottawa, Canada (2001) 945–954.
Spencer, D. and Jones, S.J. Model-scale/full-scale correlation in open water and ice for Canadian Coast Guard “R-Class” icebreakers. Journal of Ship Research 45(4): 249–261 (2001).