HAL Id: hal-01503347
https://hal.archives-ouvertes.fr/hal-01503347
Submitted on 7 Apr 2017
HAL is a multi-disciplinary open access
archive for the deposit and dissemination of
sci-entific research documents, whether they are
pub-lished or not. The documents may come from
teaching and research institutions in France or
abroad, or from public or private research centers.
L’archive ouverte pluridisciplinaire HAL, est
destinée au dépôt et à la diffusion de documents
scientifiques de niveau recherche, publiés ou non,
émanant des établissements d’enseignement et de
recherche français ou étrangers, des laboratoires
publics ou privés.
Geovisualisation of animated tides in coastal area with
an OpenSource OpenGL platform
Antoine Masse, Sidonie Christophe
To cite this version:
Antoine Masse, Sidonie Christophe. Geovisualisation of animated tides in coastal area with an
Open-Source OpenGL platform. AGILE 2016 - Code Loves Maps workshop, Jun 2016, Helsinki, Finland.
�hal-01503347�
1
Introduction
Geovisualisation of coastal area and one of its major spatio-temporal phenomenon – tide – is very challenging because: (1) coastal area observation is difficult, underwater and upon water observation techniques are different and produce heterogeneous data, including airborne and bathymetric LiDAR surveys (Light Detection and Ranging); (2) coastal area elements are constantly in motion, in time and space, e.g. tides, waves, sands, implying uncertainty and imprecision in data; and (3) animation of spatiotemporal dynamics, particularly tide cycles, is tricky and brings difficulties to geovisualisation design adapted to uses and users of the coastal area.
In this paper, we propose and discuss about animated geovisualisation of the coastal area and its improvement by representation of water level dynamics in a realistic way. These improvements are based on, first, the use of close-to-reality data such as Digital Elevation Model obtained with LiDAR data to depict more accurately coastal elements and thus enhance the perceived realism, and, second, on the manipulation of the rendering engine (style) with abstraction (maps) and realism (photorealism images) in an existing OpenSource and OpenGL platform, in 2D1 and 3D2.
2
State-of-the-Art
Animated geovisualisation is related to the visualisation of continuous or pseudo-continuous geographical spatio temporal elements [1, 5]. As an example of animated geovisualisation of the coastal elements, we can mention rising water levels simulation [8], and sandbank movement monitoring [6]. Animated visualisations are increasingly used due to new rendering capabilities (fluid visualisation and data quality). Leskens et al. [7] demonstrate animation importance, which enhances the good perception of the result of a
1
http://ignf.github.io/geoxygene/ last access 2016/05/09
2
http://www.itowns-project.org/ last access 2016/05/09
scenario. This demonstration is based on a user study on geo-visualisation of a flood (crisis event). Resch et al. [11] conclude on the importance of the dynamic representation, including its temporal dimension from the evaluation of their 4D (3D+t) geovisualisation system of marine data. However, Rensink et al. [10] point out the limitations of animations in terms of information transmission efficiency, and especially on the perception of changes. In conclusion, animations have to be used sparingly to keep focus on the main purpose of the visualisation. None of these existing geovisualisation platforms brings together stylisation tools, animation functionalities, 2D/3D +t rendering engine. Moreover, we claim for OpenSource solutions.
3
Method
We introduce a methodology to improve the realism of animated tide geovisualisation in the coastal area, characterized by a seaside and a landside, separated by the sea/land interface. The major spatial and temporal phenomenon of this area is the tidal phenomenon, requiring information at any time t of the water depth (observation or prediction) and the position of the sea/land interface.
We have the following objectives: (1) to visualize and simulate the tidal phenomenon with water depth perception and (2) to obtain a coherent rendering over land and sea (same level of stylisation on both sides), in order to facilitate the understanding of the visualisation. We choose to explore rendering possibilities of water depth with inspiration of common styles corresponding to the levels of abstraction provided by nautical and topographic maps, or, the level of photorealism provided by ortho-imagery.
We have used and improved the OpenSource GIS platform and its OpenGL rendering engine developed within the project ANR Mapstyle3 [2]. For water depth rendering, we have implemented and improved in the rendering engine the ColorMap parameter of RasterSymbolizer from the Symbology Encoding standard from the Open Geospatial
3 http://mapstyle.ign.fr/ last access 2016/05/09
Geovisualisation of animated tides in coastal area with an OpenSource
OpenGL platform
Antoine Masse Sidonie Christophe Institut National de l'Information Géographique et Forestière
Laboratoire Cogit, Université Paris-Est 73 avenue de Paris, 94165 Saint-Mandé cedex, France antoine.masse@ign.fr sidonie.christophe@ign.fr
Abstract
In this paper, we present a geovisualisation system of coastal area and the animation of tides. We introduce a new methodology with data selection, data stylisation and data rendering, in 2D and 3D on an OpenSource and OpenGL platform. Finally, we discuss about architecture and results.
AGILE 2016 – Helsinki, June 14-17, 2016
Consortium [9] for assigning colours, colour palettes and colour gradients to values or interval of values, e.g. water depth values. The colour interpolation option of the ColorMap parameter has also been implemented and provides a continuous rendering across multiple depth values, contrary to layer tints, which are commonly used in existing visualizations but not realistic.
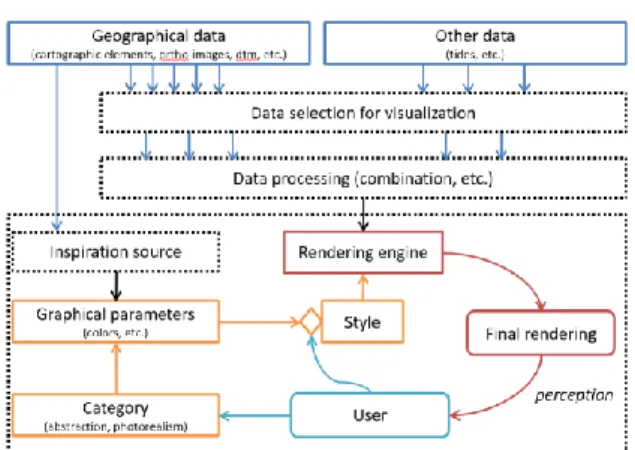
The general methodology of our implementation is presented in Figure 1 and is based on well-known architecture [3] with data to visualise (dark blue), stylisation (yellow), rendering (red) and user (light blue). We focus our work on the sequence of these different parts and especially on data selection, data processing and stylisation with inspiration sources (map abstraction or photo-realism) [4].
Figure 1: General methodology of our geovisualisation system
4
Results and Discussion
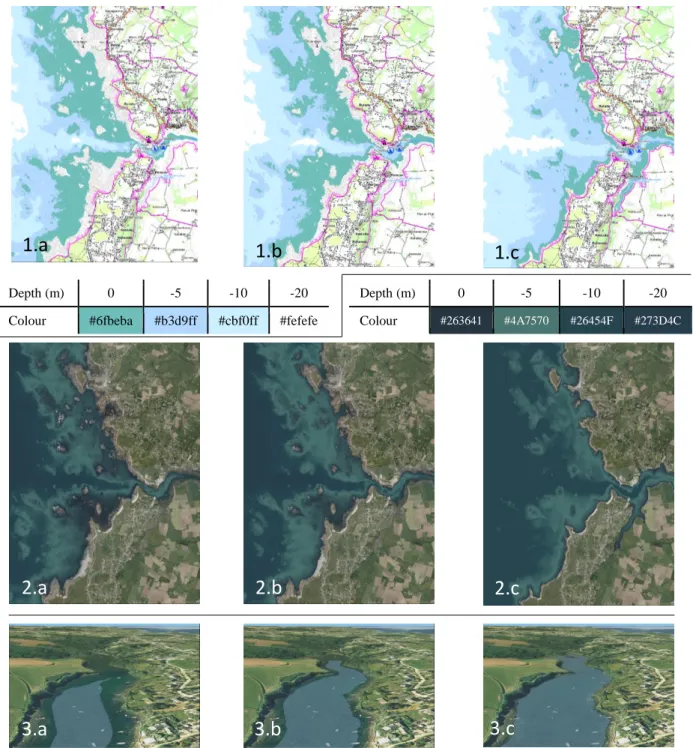
We present three types of animated geovisualisation of water depth based on tide information: (1) a 2D cartographic map (abstraction), (2) a 2D ortho-photorealistic image (photorealism) and (3) a 3D immersion (3Drealism). Figure 2 shows these three results at different tidal stages (low, medium and high level). Demonstration videos are also available4.
We can observe in (1) that we have a perception of water animation with displacement of water surfaces in a 2D cartographic map. In (2), we have more realism with better perception of submarine topography due to natural colour interpolation. Finally, in (3), we can note that the third dimension gives more interaction possibilities (displacement in 3D) to users and increases the comprehension of the tide phenomenon in producing more realistic sea animations.
During the workshop, it will be interesting to discuss about both methodological aspects, architecture and results, and especially the problem of temporal representation of the tide phenomenon: some thoughts will be provided about required tools to develop to give better interaction between users and
4
https://www.youtube.com/playlist?list=PLqYkYbT96Aq1FjC4LKzB SyIij1lD5D3ix last access 2016/05/09
renderer to manipulate time (speed, etc.) and stylisation (colours, highlights, stream, etc.).
Acknowledgement
This work is supported by the French National Research Agency, MapStyle project [ANR-12-CORD-0025]. We would like to thank IGN and SHOM for providing data.
References
[1] G. Andrienko, N. Andrienko, J. Dykes, S.I. Fabrikant, M. Wachowicz. Geovisualization of dynamics, movement and change: key issues and developing approaches in visualization research. Information
Visualization, 7(3-4): 173–180, 2008.
[2] S. Christophe, B. Dumenieu, J. Turbet, C. Hoarau, N. Mellado, J. Ory, H. Loi, A. Masse, B. Arbelot, R. Vergne, M. Brédif, T. Hurtut and D. Vanderhaeghe. Map Style Formalization: rendering techniques extension for map design , NPAR '16: Proceedings of the 14th
International Symposium on Non-Photorealistic Animation and Rendering, 2016
[3] M. Brasebin, E. Buard, S. Christophe and F. Pelloie. A knowledge base to classify and mix 3D rendering styles,
27th International Cartographic Conference (ICC'15),
Rio de Janeiro, Brazil, 2015.
[4] A. Masse, and S. Christophe. Homogeneous geovisualization of coastal areas from heterogeneous spatio-temporal data, ISPRS-International Archives of
the Photogrammetry, Remote Sensing and Spatial Information Sciences, XL-3/W3, 509-516, 2015. doi:10.5194/isprsarchives-XL-3-W3-509-2015.
[5] J. Bertin. Sémiologie graphique : Les diagrammes-Les
réseaux-Les cartes, Mouton & Cie ed. Gauthier-Villars,
Paris, France, 1967.
[6] T. Gierlinger, A. R. Brodtkorb, A. Stumpf, M. Weiler, and F. Michel. Visualization of Marine Sand Dune Displacements Utilizing Modern Gpu Techniques.
ISPRS-International Archives of the Photogrammetry, Remote Sensing and Spatial Information Sciences, 1:
503–8, 2015. doi:10.5194/isprsarchives-XL-3-W3-503-2015
[7] J.G. Leskens, C. Kehl, T. Tutenel, T. Kol, G. de Haan, G. Stelling, and E. Eisemann. An Interactive Simulation and Visualization Tool for Flood Analysis Usable for Practitioners. Mitigation and Adaptation Strategies for
Global Change, pages 1–18, 2015.
doi:10.1007/s11027-015-9651-2
[8] M. Douglas, W. Brooks, K. Draganov, B. Hadley, C. Haynes, N. Herold, J. McCombs, et al. New Mapping Tool and Techniques for Visualizing Sea Level Rise and Coastal Flooding Impacts, pages 474–90. American
AGILE 2016 – Helsinki, June 14-17, 2016
Society of Civil Engineers, 2011. doi:10.1061/41185(417)42
[9] M. Müller, Symbology Encoding Implementation Specification, Version 1.1.0 (revision 4), OGC 05-077r4, Open Geospatial Consortium, 2006. Available online: http://portal.opengeospatial.org/files/?artifact_id=16700
[10] R.A. Rensink, J.K. O’Regan, and J.J. Clark. To See or Not to See: The Need for Attention to Perceive Changes in Scenes. Psychological Science, 8 (5): 368–73, 1997. [11] B. Resch, R. Wohlfahrt, and C. Wosniok. Web-Based 4D
Visualization of Marine Geo-Data Using WebGL.
Cartography and Geographic Information Science 41
(3): 235–47, 2014. doi:10.1080/15230406.2014.901901
Figure 2: Geovisualisation examples at different tide stage, from left to right, at (a) 0m (low tide), (b) 4m and (c) 8m (high tide) and from up to down, (1) a 2D cartographic map, (2) a 2D ortho-photorealist image and (3) a 3D immersion.
Depth (m) 0 -5 -10 -20 Colour #6fbeba #b3d9ff #cbf0ff #fefefe
Depth (m) 0 -5 -10 -20 Colour #263641 #4A7570 #26454F #273D4C