HAL Id: hal-00023196
https://hal.archives-ouvertes.fr/hal-00023196
Submitted on 21 Apr 2006
HAL is a multi-disciplinary open access
archive for the deposit and dissemination of
sci-entific research documents, whether they are
pub-lished or not. The documents may come from
teaching and research institutions in France or
abroad, or from public or private research centers.
L’archive ouverte pluridisciplinaire HAL, est
destinée au dépôt et à la diffusion de documents
scientifiques de niveau recherche, publiés ou non,
émanant des établissements d’enseignement et de
recherche français ou étrangers, des laboratoires
publics ou privés.
Process Window OPC Verification: Dry versus
Immersion Lithography for the 65 nm node
Amandine Borjon, Jerome Belledent, Yorick Trouiller, Kevin Lucas,
Christophe Couderc, Frank Sundermann, Jean-Christophe Urbani, Yves Rody,
Christian Gardin, Frank Foussadier, et al.
To cite this version:
Amandine Borjon, Jerome Belledent, Yorick Trouiller, Kevin Lucas, Christophe Couderc, et al..
Pro-cess Window OPC Verification: Dry versus Immersion Lithography for the 65 nm node. 2006,
pp.1475-1485, �10.1117/12.657056�. �hal-00023196�
Process Window OPC Verification:
Dry versus Immersion Lithography for the 65 nm node.
Amandine Borjon
1-5, Jérôme Belledent
1, Yorick Trouiller
3, Kevin Lucas
2,
Christophe Couderc
1, Frank Sundermann
4, Jean-Christophe Urbani
4,
Yves Rody
1, Christian Gardin
2, Frank Foussadier
4, Patrick Schiavone
5 1Philips Semiconductors 850 rue J.Monnet 38926 Crolles, France
.
2
Freescale Semiconductor 850 rue J. Monnet 38926 Crolles, France
3LETI-CEA- 17 rue des Martyrs 38054 Grenoble, France
4STMicroelectronics 850 rue J. Monnet 38926 Crolles, France
5LTM-CNRS
c/o CEA-Grenoble, 17 rue des Martyrs, 38054 Grenoble Cedex09, France
ABSTRACT
Ensuring robust patterning after OPC is becoming more and more difficult due to the continuous reduction of layout dimensions and diminishing process windows associated with each successive lithographic generation. Lithographers must guarantee high imaging fidelity throughout the entire range of normal process variations. To verify the printability of a design across process window, compact optical models similar to those used for standard OPC are used. These models are calibrated from experimental data measured at the limits of the process window. They are then applied to the design to predict potential printing failures.
This approach has been widely used for dry lithography. With the emergence of immersion lithography in production in the IC industry, the predictability of this approach has to be validated on this new lithographic process. In this paper, a comparison between the dry lithography process model and the immersion lithography process model is presented for the Poly layer at 65 nm node patterning. Examples of specific failure predictions obtained separately with the two processes are compared with experimental results. A comparison in terms of process performance will also be a part of this study.
Keywords: OPC, resist modelling, process window, ORC, failure prediction
1. Introduction:
Due to diminishing process window (PW) with each successive lithographic generation, post–OPC verification methods have become indispensable tool to control the printability of patterns across PW. In this paper, simulation-based methodology is used to ensure robust patterning. Optical models and resist models calibrated through several process conditions are applied to post-OPC layouts to identify potential printing failures. This approach has proven its ability to detect printing issues of a layout across PW.
With the emergence of immersion lithography in a production scheme, this approach has to be extended to immersion processes. The goal of this paper is to build a PW model for an immersion lithography proces and to compare model prediction and process performance to the corresponding dry lithography process. The case study is the poly layer at the 65 nm node after lithography. This study will include a theoretical comparison, to understand what are the fundamental differences between dry and immersion lithography, through model calibration and model accuracy comparison will be detailed to compare the modelling ability of the simulation tool on the two different processes, and it will include a comparison of each process performance on the same post-OPC layout taking into
10
.
2
)²
1
(
)²
45
.
1
(
2 2=
=
air watern
n
(
6).
(
7),
account the error prediction. For this last comparison, the process performance will be evaluated on a single PW: defocus +/-120nm, dose variation from best dose +/-4%.
Concerning experimental data, dry and immersion lithography processes have the same resist stack, the same off-axis illuminator, the same wavelength of light and the same NA (imaging under low-NA). A top ARC is added to the resist stack for the immersion process. Two different lithographic tools are nevertheless used.
2. Theoretical comparison between dry and immersion lithography:
For a lithographic tool, it is well known that the resolution limit is driven by the wavelength of light
λ
0 and the numerical aperture NA. The minimum half-pitch is given by:(1).
As explained in the introduction, dry and immersion processes have the same NA and the same wavelength. Regarding to equation (1), both processes will have the same resolution limit. Considering the Depth-Of-Focus (DOF), the expression of the DOF of an optical system is given by [1]:
(2).
As (3),
where n is the refractive index of the media in which the light propagates, the ratio between the DOF of the dry process and the DOF of the immersion process will be 2:
(4).
Thus, the immersion process will have a larger DOF than the dry process.
Considering imaging properties using coherent light, the image (i) of the mask through an optical system is the result of the convolution of the mask (m) with the PSF (h) (point-spread function, which is the image of source-point at the exit of the optical system):
(5), where x can be 1D, 2D or 3D.
As our processes use strong OAI illumination with relatively small
σ
, the imaging part must be described by multiple convolution instead of a single convolution (5). In the Fourier domain, the convolution results in a product of the Fourier Transform (FT) of m and h:H is the Optical Transfer Function (OTF) of the optical system. The OTF corresponds to a low-pass filter in the Fourier space. Let’s describe its 3D-shape. An analytical expression of the OTF has been found in the literature [2]. The OTF has a torus-like shape with high intensity value in the centre. Its expression in the (u,v,w) Fourier space is the following:
NA
k
p
0 1 minλ
=
θ
λ
² sin 2 0 2 k DOF=n
NA
=
θ
sin
)
(
)
(
)
(
x
m
x
h
x
i
=
⊗
)
(
)
(
)
(
u
M
u
H
u
I
=
×
≤
≤
<
−
=
=
=
)
(
'
,
1
0
,
)
²(
'²
1
)
(
.
.
)
(
.
2
0
'
,
0
,
1
)
'
,
(
0q
m
w
q
for
q
m
w
q
m
q
q
l
w
q
for
w
q
H
π
q
z
x
] Re[FT−1Dry
Immersion
z
Fourier space Fourier space
Log
scale Log scale
] Re[FT−1 ' w
b)
w'1d)
a)
c)
where: , , , ,The following figure shows a cross-section of the theoretical OTF of the dry and the immersion processes obtained with the expression (7), together with their respective cross-section of the PSF.
Looking at the OTF (fig 1a and 1b), the cut-off frequency in the (u,v) plane (that is to say along q) is the same for dry and for immersion lithography. Thus, both processes will have the same cut-off frequency. That means that the printing errors, which are mainly induced by the limitation of the optics, will be the same for both processes. Looking at the cross-sections of the PSF (fig 1c and 1d) obtained by computing the inverse FT of the OTF, the PSF in the immersion case is more extended in the z-direction. That correlates with the fact that the DOF of the immersion process is twice as big as the DOFof the dry process. From these figures, we can expect that both processes will encounter the same printing defects but that these defects will appear at higher defocus condition in the immersion case than in the dry case.
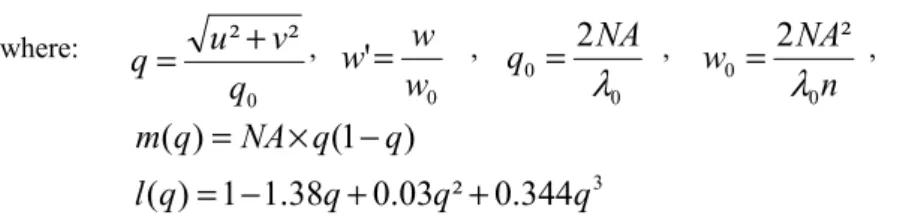
A last comment can be added to this theoretical study. This concerns the torus-like shape of the OTF. This particular shape will induce, especially for
w
'
>
0
, the filtering of intermediate diffraction orders. This is the forbidden pitch phenomenon. This idea is illustrated in the figure 2. This figure shows which diffraction orders,0
²
²
q
v
u
q
=
+
0'
w
w
w
=
0 02
λ
NA
q
=
n
NA
w
0 0²
2
λ
=
3344
.
0
²
03
.
0
38
.
1
1
)
(
)
1
(
)
(
q
q
q
q
l
q
q
NA
q
m
+
+
−
=
−
×
=
Figure 1: a) torus-like shape of the dry OTF; b) torus-like shape of the immersion OTF; c) Dry PSF; d) Immersion PSF.
-2 -1 0 +1 +2 -1 0 +1
Dry
Fourier space ' wOTF:
at w’=0
,
at w’> 0
-2 -1 0 +1 +2 -1 0 +1w’=0
w’>0
pitch
1
pitch
2
Figure 2: illustration of the forbidden pitch phenomenon looking at two line-space patterns with different pitches: for the first pattern, orders 0 and +1 are transmitted for the two w’ conditions, but for the second pattern, orders +1 and +2 are cut off for w’>0.
Order +1 and +2 are cut off.
belonging to two different line-space patterns, are transmitted by the OTF and which are cut off (under OAI). This analysis shows that the structure 2 will have a smaller PW than the structure 1, because its first and second diffraction orders are cut off for
w
'
>
0
.3. Model calibration and model accuracy:
In this part, the detailed model calibration and model accuracy comparison are developed. Two sets of measurements have been taken through several process conditions for the immersion and the dry processes. The calibration patterns are exactly the same (from the same mask). Indeed, a layout which OPC was computed with a dry lithography model will print properly under immersion lithography. The process conditions used for the calibration are different from one process to the other because the nominal dose is different and because the DOF in the immersion case is bigger. The calibration conditions are described on figure 3 and 4.
dose defocus -120nm +120nm +4% -4%
Point where data are measured for the calibration. dose defocus -160nm +3.5% -3.5% +160nm
Figure 3: Calibration conditions for dry lithography.
Figure 4: Calibration conditions for immersion lithography.
The PW models are then built using Tachyon LMC product (from BRION). The optical models, similar to those used by current OPC tools, are built separately from the resist model. The resist model used for our two calibration data sets is a multiple Gaussian resist model [3]. It is composed of several Gaussian convolutions. The first one is the convolution of the mask with a Gaussian function to account for density effects. Then, the aerial image is computed using the optical model. A sum of two Gaussian convolutions with the aerial image is calculated. The resist contour is then extracted from this last result at constant threshold. The accuracy is measured by the distribution of the EPE. The standard deviations of the un-weighted EPE distribution of the dry and the immersion processes are respectively 2.46 nm and 2.01 nm. The accuracy of the model on the overall calibration structures across PW is similar for both processes.
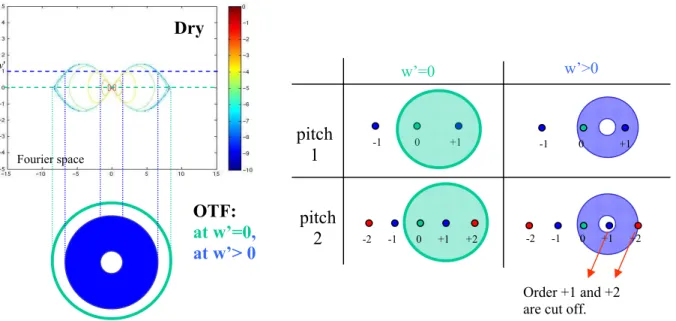
To analyse the model accuracy, the EPE distributions for 1D and 2D patterns extracted at nominal and corner conditions are plotted on figures 5 a-d. The EPE distributions for 1D data (5-a and 5-b) are sharp for both processes. But for 2D data, the distributions are lerger. Even if the level of noise during the measurement is high for 2D patterns, the models will be less accurate on 2D data than on 1D data. Comparing dry and immersion lithography, the prediction on 2D structures will be better using immersion lithography model.
A qualitative approach can be made looking at the matching between the resist contours from simulation and the corresponding SEM images. Figure 6 shows the overlap between simulated contours and the corresponding SEM images for dry lithography and figure 7 shows the overlap for immersion lithography. The first observation that
a) b) c) d) nm nm nm nm Nb of patterns Nb of patterns Nb of patterns Nb of patterns
Figure 5: EPE distributions of 1D dry data (a) and 1D immersion data (b), and EPE distributions of 2D dry data (c) and 2D immersion data (d).
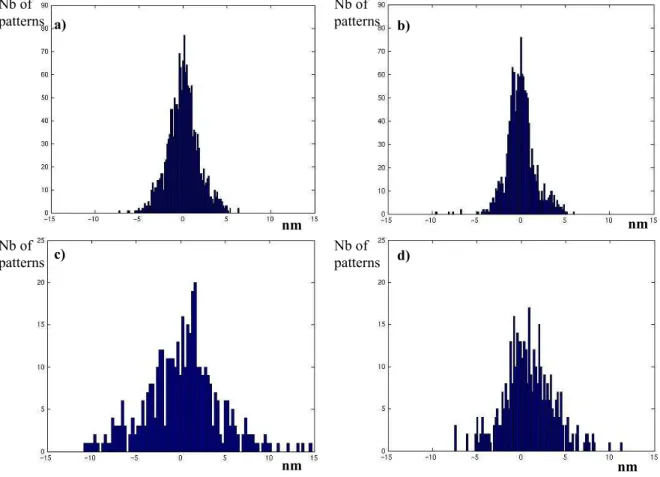
can be made on the pictures is that simulations and contours are matching. There is also a larger discrepancy in terms of CD variation for the central line though process variations in the dry case than for the immersion case, even though the focus variation is bigger in the second case. The wiggling effect, inducing a pinching case on figure 6, is well described by the model. From these pictures, the ability of the PW models to detect potential hard failures can be validated.
+120nm
-120nm
-4%
+4%
Figure 6: overlap between simulations and SEM pictures for the dry lithography case: simulated contours and SEM images are matching.
+160nm
-160nm
-3.5%
+3.5%
Figure 7: overlap between simulations and SEM pictures for the immersion lithography case: simulated contours and SEM images are matching.
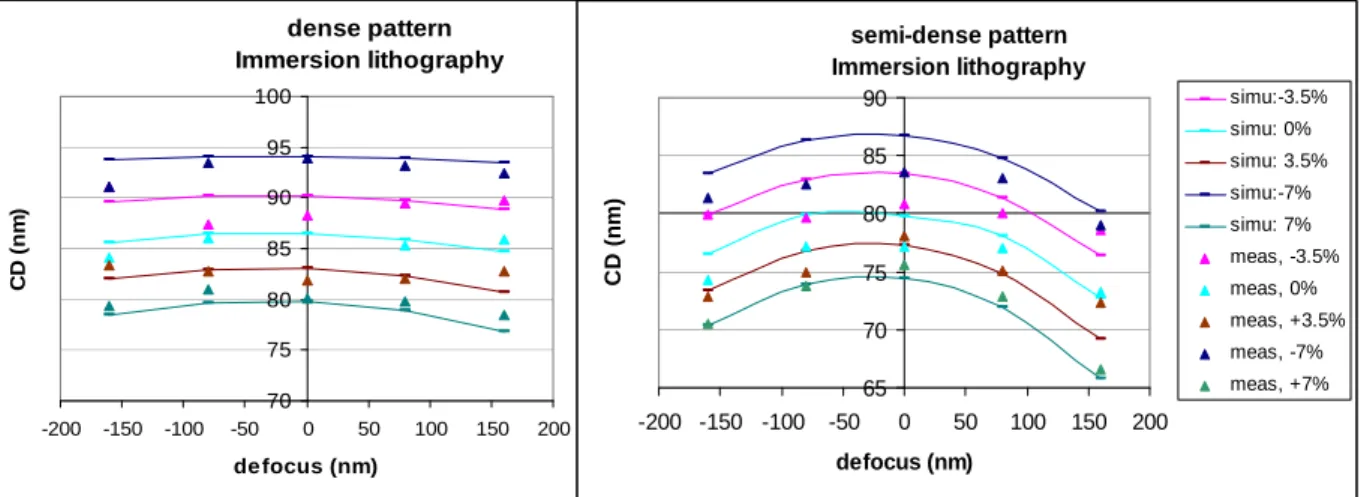
dense pattern Immersion lithography 70 75 80 85 90 95 100 -200 -150 -100 -50 0 50 100 150 200 de focus (nm) C D ( n m ) simu:-3.5% simu: 0% simu: 3.5% simu:-7% simu: 7% meas, -3.5% meas, 0% meas, +3.5% meas, -7% meas, +7% semi-dense pattern Immersion lithography 65 70 75 80 85 90 -200 -150 -100 -50 0 50 100 150 200 defocus (nm) C D ( n m ) simu:-3.5% simu: 0% simu: 3.5% simu:-7% simu: 7% meas, -3.5% meas, 0% meas, +3.5% meas, -7% meas, +7% A last evaluation of the accuracy of the models can be done comparing simulations and measurements on Bossung plots for dense and isolated patterns. For the dry lithography case on figure 8, the simulation and the measurement data are fitting well for the isolated pattern. Nevertheless, on the dense structure, the separation between the iso-dose curves is larger for the simulation than for the measurements points. For the immersion lithography case on figure 9, the simulation for the dense pattern matches the measurement points. But, for the semi-dense pattern, a large shift in the dose variation can be observed. Thus, these figures show that a precise CD control through the PW will not be possible with our models.
Dense pattern Dry lithography 70 75 80 85 90 95 100 -150 -100 -50 0 50 100 150 defocus (nm) C D ( n m ) simu:-4% simu: 0% simu: 4% simu:-8% simu: 8% meas, -4% meas, 0% meas, +4% meas, -8% meas, +8% Isolated pattern Dry lithography 65 70 75 80 85 90 95 -150 -100 -50 0 50 100 150 defocus (nm) C D ( n m ) simu:-4% simu: 0% simu: 4% simu:-8% simu: 8% meas, -4% meas, 0% meas, +4% meas, -8% meas, +8%
Figure 8: Bossung plots for a dense and an isolated patterns printed under dry lithography.
4. Error detection comparison:
The last step in this study is the evaluation of the process performance by comparing dry and immersion lithography error predictions. This evaluation is done on a single post-OPC layout (as OPC is transferable from dry to immersion lithography). The printing behaviour of the layout is evaluated through the following unique PW conditions:
Figure 10: PW evaluated for dry and immersion processes.
On the simulated contours, CD and space are measured. A necking case is defined as a pattern which CD is below 50 nm. A bridging case is defined as a space between patterns smaller than 60 nm. The following table described the worst printing issues found on the layout for the dry and immersion processes. The results show that for immersion lithography, the worst cases are less critical than for dry lithography (the defects are 20 nm bigger). What cannot be seen on this table is that the worst cases for both processes are actually coming from the same design structures, that is to say that the pinching cases for example are the same but the CD is bigger for immersion than for dry lithography. Looking at the statistical results on the full layout, the immersion process allowed a reduction of 95% of the total amounts of errors (this statistics was calculated using for pinching and bridging cases the following threshold values: 65 and 80nm respctively).
necking most critical value bridging most critical value
Dry lithography CD_worst = 37.7 nm Space_worst = 52.57 nm
Immersion lithography
CD_worst = 58.6 nm Space_worst = 71.3 nm Figure 11: Worst printing issues found on the layout for dry and immersion processes.
From the expectation of the theoretical study (see part 2), the printing issues are exactly the same for both processes but they are less critical for immersion than for dry lithography. The following figures (12 and 13) show examples of pinching and bridging issues found on our design. For all the cases, the printing issues appears at the same locations and they are more critical for dry lithography than for immersion lithography.
-4%
dose
defocus +120nm
+4%
Point where resist contour is calculated.
Contours: Dry lithography +120nm +4%, Immersion lithography +120nm +4%
∆CD = 19.7
nm
(+42%)
∆CD =
19.6
nm
(+42%)
∆CD = 14.0 nm
(+29%)
∆CD = 14.3 nm
(+29%)
Figure 12: Examples of pinching detections for dry and immersion lithography.
Figure 13: Examples of bridging detections for dry and immersion lithography.
∆Space =
14.9nm
(+26%)
∆Space =
6.3nm (+9%)
Contours: Dry lithography +120nm +4%,Immersion lithography +120nm +4%
Contours: Dry lithography +0nm +0%,
Immersion lithography +0nm +0%
4. Conclusion
To conclude, this study shows that PW modelling for immersion lithography is similar to PW modelling under dry lithography. The PW models built for both processes have equivalent accuracy on 1D and 2D data, they have comparable contour prediction accuracy for hard failure detection, and they have the same lack of precision on CD control across the process window. In terms of process performance, the number of printing issues on a single post-opc layout using contours simulation on the same PW is reduced by 95% using immersion lithography. For both processes, the errors come from the same design patterns. The dry and immersion processes are identical regarding to their wavelength, their NA and their illuminator. Both processes are thus filtering exactly the same frequencies in the Fourier space. But printing issues are less critical with immersion lithography, than with dry lithography (spaces or CDs are 10 to 20 nm bigger). This behaviour was also expected from the theoretical study as the DOF for the immersion lithography is doubled regarding to the dry process. From these conclusions and knowing that post-OPC layouts computed using dry lithography model is transferable to immersion lithography, it seems clear that the immersion process should be chosen as the production process for the 65 nm node. But these results have to be balanced by the fact that immersion lithography tools have to be improved to reduce their process defectivity. A solution has also to be found to enhanced the CD predictability across PW for these PW models.
5. References
[1] “Optical Imaging in Projection Microlithography”, A. K. Wong, SPIE press, chapter 9, p. 181, 2005.
[2] “Reconstructing 3-D light-microscopic images by digital image processing“, A. Erhardt, Applied Optics, vol. 24, No 2, 1985.
[3] “Assessment of different simplified resist models”, D. Fuard et al. Proc. of SPIE, Vol 4691, p 1266-1277, 2002.