HAL Id: hal-03110159
https://hal.archives-ouvertes.fr/hal-03110159
Submitted on 14 Jan 2021
HAL is a multi-disciplinary open access
archive for the deposit and dissemination of
sci-entific research documents, whether they are
pub-lished or not. The documents may come from
teaching and research institutions in France or
abroad, or from public or private research centers.
L’archive ouverte pluridisciplinaire HAL, est
destinée au dépôt et à la diffusion de documents
scientifiques de niveau recherche, publiés ou non,
émanant des établissements d’enseignement et de
recherche français ou étrangers, des laboratoires
publics ou privés.
Deuterium excess record from central Greenland over
the last millennium: Hints of a North Atlantic signal
during the Little Ice Age
Georg Hoffmann, Jean Jouzel, Sigfus Johnsen
To cite this version:
Georg Hoffmann, Jean Jouzel, Sigfus Johnsen. Deuterium excess record from central Greenland over
the last millennium: Hints of a North Atlantic signal during the Little Ice Age. Journal of
Geo-physical Research: Atmospheres, American GeoGeo-physical Union, 2001, 106 (D13), pp.14265-14274.
�10.1029/2000JD900585�. �hal-03110159�
JOURNAL OF GEOPHYSICAL RESEARCH, VOL. 106, NO. D13, PAGES 14,265-14,274, JULY 16, 2001
Deuterium
excess record from central Greenland
over the last
millennium' Hints of a North Atlantic signal
during the Little Ice Age
Georg Hoffmann and Jean Jouzel
Laboratoire des Sciences du Climat et de l'Environnement, Unitfi Mixte de la Recherche CEA/CNRS, Gif- sur-Yvette, France
Sigfus Johnsen
Science Institute, University of Iceland, Reykjavik
Abstract. A stacked water isotope record for Summit, central Greenland, has been established
covering
approximately
the last 900 years.
Measurements
of b•80 and bD in the GRIP deep
ice
core and the 230-m core, S93, allow the reconstruction of a millennial record of the deuteriumexcess
in a near-annual
resolution.
A short period of particularly high values of the Deuterium
Excess at the beginning of the fourteenth century may be associated with the medieval warm
period (MWP). The Little Ice Age (LIA) might be represented
by a 100-year
period of very low
excess
values
in the sixteenth
and
seventeenth
centuries.
Using
a simple
isotope
model,
b180
and
deuterium
excess
are interpreted
in terms of surface
temperature
variations
over central Greenland
and over the subtropical
North Atlantic, Greenland's
principal vapor source
region. An estimated
cooling of-0.7øC of subtropical sea surface temperatures (SSTs) during the Little Ice Age and a
warming of 0.6øC during the short warm period in the medieval is in agreement
with previous
studies.
Over periods
of about
100 years,
an antiphasing
between
gradually
decreasing
6•80 and in-
creasing deuterium excess is observed. Interannual-to-decadal -scale variability associated to theNorth Atlantic Oscillation may be responsible
for this anti-phase
relationship.
An alternative
explication is a North-South oscillation in North Atlantic sea surface temperatures associated with short-term changes in the thermohaline circulation.
1. Introduction
The quantitative
reconstruction
of climate along the last
few hundred
years has become a focus of much ongoing
research [CLIVAR, 1998]. Multiproxy data sets have been
used
to compare past climate variability with the global
warming
observed
during
the twentieth
century
[Bradley
and
Jones, 1993; Mann et al., 1998; Overpeck et al., 1997]. However, most of the high resolution records (i.e., at least decadal), such as tree ring widths or lake sediment records,
originate
from terrestrial
sites and reflect climate conditions
on land. Equivalent deep sea records are rare and on short timescales their exact dating and interpretation is not
straightforward
[Keigwin, 1996]. Some information from
coral records is now available, too [Boiseau et al., 1998; Cole et al., 1993] and in the future will certainly become
more important, although
with a spatial coverage
of coral
archives basically restricted to the tropics.
As long as our knowledge
of climate
variability
in the last
millenium is mainly based on continental records, an impor-
tant piece
in the climate puzzle
is missing. Whether
internal
variability
of the ocean-atmosphere
system
or rather external
Copyright 2001 by the American Geophysical Union. Paper number 2000JD900585.
0148-0227/0 !/2000JD900585509.00
factors such as solar luminosity or atmospheric aerosol con- centration drive centennial scale climate, variability is
difficult to determine without suitable marine information.
In the North Atlantic sector, two major climate variations in the last about thousand years are often discussed, the Little Ice Age (LIA) and the medieval warm period (MWP). Although uncertainties exist in both their exact timing and their spatial extent, these climatic episodes are seen as extremes in climate variability during the last 1000 years. Usually, the MWP is considered as a comparable warm period from approximately 900-1400 [Hughes and Diaz, 1994]. The LIA, originally associated with the observed advances of alpine glaciers, denotes cool conditions particularly during the seventeenth and nineteenth centuries. In western Europe, for instance, the more quantitative analysis of tree ring records show a transition to cooler summer conditions (~- 1.5øC compared to modern conditions)at about 1550 lasting until 1750, a recovery of climate to former conditions in the second half of the eighteenth century and again a reversal to the former cooler state during the nineteenth century [Bradley
and Jones, 1993].
For a long time these centennial temperature variations were not found in Greenland's ice cores. This is particularly surprising since the appearance of Viking settlements along Greenland's coast was often mentioned as suggesting milder conditions during the medieval. Consequently, the disap- pearance of this settlement at the beginning of the fiveteenth
century was interpreted as a hint for a change to colder condi- tions [Dansgaard et al., 1975]. Solely, the isotope record of the deep drilling at Camp Century in the far northwest of Greenland [Johnsen et al., 1970] documented local temperature variations in accordance with the described se- quence of warmer and cooler periods during the last millennium. Recently, results from a transec of shallow ice cores drilled in northern Greenland confirmed these early findings. Fischer et al. [1998] found an isotope signal docu- menting the LIA climate variation with a continuously increasing amplitude when moving from central Greenland toward northwest Greenland. Furthermore, numerical analysis of borehole temperature measurements in the Greenland ice core project (GRIP) record give evidence for a cooling of -1.5øC during the sixteenth, seventeenth, and nineteenth
centuries relative to the MWP even in central Greenland
[Dahl-Jensen et al., 1998]. This implies that there actually exists a LIA cooling also on the central Greenland ice sheet, but for some reason, it is not clearly recorded in most isotope
records.
In this study we present the isotope records of two ice cores from Summit (37ø37'W,72ø34'N, 3232 m above sea level (a.s.1.) elevation), central Greenland. Because of the
annual mean accumulation there, these records enable
sufficiently high temporal resolution for studies of inter- decadal variability over the last millennium. The isotopic
composition
(6•O, fiD)of polar ice cores is usually
inter-
preted as reflecting regional temperatures over the ice sheet [Dansgaard, 1964; Jouzel et al., 1987]. However, the second order parameter deuterium excess, defined by Dansgaard
[1964] as d=6D-8*6•O, offers an interesting
possibility to
work around the problem of missing quantitative information from the ocean. This second-order quantity depends less on condensation temperatures but reflects climate conditions at the sea surface when water vapor is formed [Jouzel et al.,
1982; Vimeux et al., 1999]. During evaporation, kinetic nonequilibrium processes take place affecting the relation-
ship between
the two water isotopes (H2•80, HDO) and
tagging the oceanic vapor with a deuterium excess signal, hereinafter referred to as d. At least in simple isotope models, designed for describing these fractionation processes, the deuterium excess in the final precipitation is a quite sensitive indicator of humidity and temperature at the sea surface.
The reason for this tagging mechanism by fractionation processes reads as thus: The colder and more humid the evaporative conditions are, the "slower" the evaporation occurs. Under such conditions the evaporation process is close to isotopic equilibrium, and the relation between the
two isotopes
(•O, D) mainly reflects
the ratio s of the equi-
librium fractionation
factors at (s=at•O/atD ~ 1/8). Conse-
quently, the influence of the kinetics is reduced and the deuterium excess of the corresponding water vapor, which reflects the deviation from the equilibrium slope s, is small. On the other hand, warm and dry conditions lead to a "faster" evaporation which is out of isotopic equilibrium and pro- duces a larger deuterium excess [Johnsen et al., 1989; Merlivat and Jouzel, 1979]. Also wind speed has a weak in- fluence with d going down by app. 1% if wind speed doubles [Merlivat and Jouzel, 1979]. Assuming the distribution of Greenland's vapor source regions has not significantly changed over the last millennium and that the relative humidity at the ocean surface stayed approximately constant, a higher deuterium excess would then indicate warmer condi-
tions at the ocean surface and, vice versa, a lower excess
cooler ocean conditions.
A recent modelling study [Armengaud et al., 1998] com- pared the results of such simple isotope models with an atmospheric general circulation model fitted with water iso- tope diagnostics. Both types of models showed a similar response of the deuterium excess in central Greenland on the seasonally varying conditions at the sea surface (temperature and relative humidity). On the basis of this outcome we interpret in this paper quantitatively the deuterium excess signal of two stacked ice cores from central Greenland using a simple isotopic rainout model.
2. Data
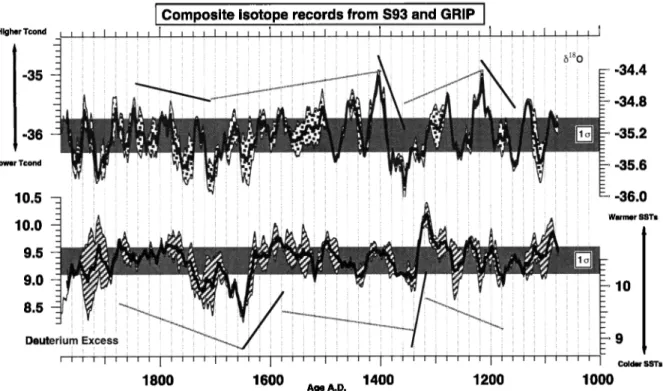
In Figure I we show
the isotope
records
(6•80 and d) of the
shallow core S93 and the upper part of the GRIP deep ice core [Dansgaard et al., 1993] together with their stacked records. The sample length of 55 cm of both cores corresponds to a temporal resolution of about 2-3 years. Stacking several ice cores helps to reduce postdepositional effects such as snow drifting or wind scouring of winter snow which impose a high noise level on the original signal [Fisher et al., 1985; White et al., 1997]. We find a signal to noise ratio between the two cores of 0.95 for the 6•80 and 0.3 for the deuterium excess signal. The lower correlation between both cores for d is mainly due to larger uncertainties as d results of two inde- pendent isotope measurements.
For further reducing the high noise level existing even in the stacked records (Figure 1) we calculated the 20-year running mean presented in Figure 2. For inferring a climate- related signal from Greenland's ice cores usually low-pass filtering from between 30 and 50 years are applied [Fisher et al., 1996]. Comparing the two composite signals once again demonstrates that the deuterium excess is a quantity inde- pendent of the actual isotope signal. In agreement with what
has been stated
before
this central Greenland
6•O signal
indicate s only slightly cooler conditions during the LIA. During the eighteenth and seventeenth centuries century the
6•O is, at least periodically,
about -0.4%0 lower than the
long-term mean value. However, if we would apply the
classical
spatial
relationship
for Greenland
between
6•O and
temperature of 0.69%o/øC on the maximal temperature amplitude reconstructed from bore hole temperatures (-
1.5øC),
a 1%o
decrease
of the {5•O signal should
be expected.
Even with a smaller gradient of 0.33%o/øC, as it was predicted for the last glacial-interglacial change [Cuffey et al., 1995; Dahl-Jensen et al., 1998], the observed response of the water isotopes remains weak and points to some peculiarities in the physics of the water isotopes that we will discuss later.
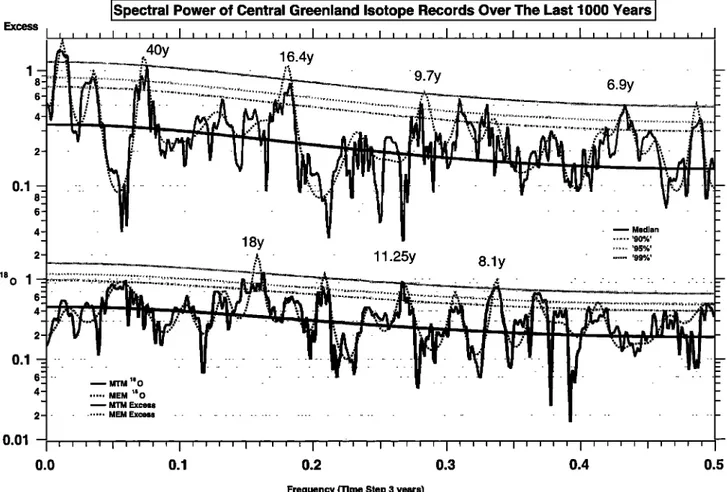
The spectral properties of both isotope series are analyzed using both the maximum entropy method (MEM) and the multi taper method (MTM). The latter allows a significance test of the found periodicities against a supposed red noise process (see Figure 3). Using, in this paper, just a subset of the isotope series available from the GRIP site (the Eurocore or S89 core 6•O data used in [Johnsen et al., 1998] are not considered here since the corresponding excess was not measured), we find nevertheless approximately the same frequencies in the stacked isotope series as discussed by Johnsen et al. [1998]: There is weak spectral power in our
HOFFMANN ET AL.: DEUTERIUM EXCESS 14,267 ,:'.-?:'•' :•.'. ... ... ß •.. ;... ... :::::::::::::::::::::::: . ___ _.•--.,. -- c.".•'.•i' -: :::::u,
.... r':':•,
.=.;::,
: • : 1i
'•':: .....__.
(!::.•.-::: .... - -::'..'::i,:....:• : ..L....• '"-- '"::) : __ ::.•..:...:::: : (:::::::::::::: --1M_ •, ...•.:::• __ .... • ....'.•) ß _ .. • --- .... ---•1•___: - • : :::::::::::::::m ß :... ... -7.. -' _ ....'...:::::; ß ...•:::. • ,. ß ... •- ... • ... : •:.'• J. 3•f..:.-:•- ß ß. _ ....:.• .. ... ... _ _ -- :::::• ... •.:'•,-- ..--.:...-... :::•. : ... ::::::::::::::::::::::::::::::: : • _ - ...•...], •::.•.•:: : ß .... -- _ .... • ... : ß tlmnm• -- r' ß _ i ' :::.'.• : ... '"7.'.• : -.."" _ • ,•,,,, ... •; ... • :. ß .rimmi. ' ... •: ...I Composite
isotope
records
from
S93
and
GRIP
]
Higher Tcond I • ! I ! t ! t ! I ! I ! • t ! I • • ! ! I ! I I ! ] ! ! I I I ! ! I I I I ! I ! ,!,,I
••
-34.4
!:':..'!/•. "•;i•;•;•i;•i;:•,•
-•'":•'
•'
• •:
...
;
...
•
. ,l•ir:•...•. .':1 .a...:. ... '. : ... - ... .:- ... .-:- -36 -35.2•i •
-35.6
10.5 --n : ; i • '•
! i • i ', i i
• :i ! ; i
i =. : :, : • :
-• :• ', i ! i i i i
-36.0
n n • V•.}?:•:-:'.'..?• ... : ... •':':"•.':•:::•,•4r•.'•::'• '. ... •>'::•; ... ::'":.'?:%:'"'-'• ... :. ... ?•?:,.:-T•"*:•?•?•'• •;:-"::": ... [•'":'•:;•:':•2">::':':'•:¾'h'% ... : ... ,":;:'-:-,'::':':'•;'•'•:i ... : ... I : = ; ß . • : : : . : : ; ß : : : : : : : : : : : • : : : : : : : : :I I ] I i [ I I I [ liii i l t Ill i/[ i ] / I [ /l ill ill [ I I i I t I I I I I Colder SSTs
1800 1600 1400 1200 1000
Age A.D.
Figure 2. Twenty
years
running
mean
of the stacked
isotope
records
(6•80, top panel,
and deuterium
excess
d,
bottom panel) of the GRIP and the S93 ice cores. We show the single records as an envelope curve around the composite records in order to give an estimate of the measurement precision. Linear regressions were calculated over certain periods defined by, alternately, increasing maxima and decreasing minima. The regressions are shown in the figure slightly displaced relative to the original data (axes for the regressions are
on the right for the excess
and on the left for the 6•O).
90% level only), 19 and 20 (99%), 11 and 12 (99%), and between 8 and 9 years (99%). Some of these frequencies (19
and 11 years) have also been found analyzing •øBe
in the
GRIP and •4C
in the Greenland
Ice sheet program
(GISP) core
[Stuiver et al., 1995], respectively. Since the distribution of these radioisotopes is primarily controlled by solar activity,
both 6180 peaks were tentatively associated
to variations
of
solar insulation. In the low-frequency range, p.eriodicities between 50 to 60 years, however, might rather be due to in- ternal oscillations of the coupled ocean/atmosphere/sea ice climate system. Analyzing the deuterium excess signal in the same manner reveals a similar sequence of periodicities; however, most of them significantly shifted relative to the
6180 signal: Among 30-40 (99%), 16- 17 (95%), 9- 9.5
years (95%), and 6-7 years, there is significant spectral power. The most striking differences between both st>ectra
certainly
is the different
low-frequency
behavior.
The 6•80
isotope record shows much less low frequency power than the
excess record.
Furthermore
the •80 record shows two gradual
cooling
cycles (from 1220 A.D. to 1360 A.D. and from 1400 A.D. to 1720 A.D.) both interrupted by quite abrupt warming events. In Figure 2 the sawtooth-like cooling cycles are sketched out by calculating the linear regression of both isotope series over certain periods (see Figure 2 caption for details). This sawtooth-like form has been noted previously [Johnsen et al., 1998]. This structure of gradual cooling followed by an abrupt warming can be found on a comparably short timescale (10-300 years) and on the long timescale (some
1000 years) of the warm interstadials during the last glacial period as well. We have no conclusive explanation for the apparent existence of such a climate pattern on different timescales. However, it might point to a common mechanism affecting the circum-Greenland climate such as a general asymmetry of the thermohaline circulation (THC)in the North Atlantic (this is a rather gradual slow down of the THC, but an abrupt intensification).
Interestingly, a similar but inverse pattern can be seen in the deuterium excess record. The long periods of gradual cooling over Greenland are accompanied by a slight gradual increase of the excess and thus following our interpretation based on simple isotope models, by a gradual warming of the source regions of Greenland's precipitation. These warming cycles are interrupted by quite rapid coolings that are leading the corresponding shifts to warmer conditions over Greenland by about 50 years. Two extremes in the stacked excess record can be identified both clearly exceeding the 1 o band: one rather short positive deviation (+0.5%•) from about 1290-1330 A.D. and a rather longer lasting negative one from 1630 to 1740 A.D. (maximal amplitude -0.9%•). We
associate these variations of d with the MWP and the LIA.
However, in the nineteenth century, often mentioned as the second phase of the LIA, there is no pronounced cool period in our records, and in the most modern part of the isotope records, there is no particular tendency possibly linked to a general warming.
Before discussing possible climate mechanisms that might link Greenland's climate and the conditions in its
HOFFMANN ET AL.: DEUTE• EXCESS 14,269
1
I. I I
]Spectral
Power
of Central
Greenland
Isotope
Records
Over
The
Last
1000
Years
I
i I I I I 0.1 o I 18y 11.25y 8.1y • Median ... '90%' ... '95%' ... '99%' 0.1 0.01 • MTM 18 O ... MEM 180 --- MTM Excess ... MEM Excess I [ [ [ [ I [ ] [ ] I ] ] [ [ I ] [ ' t I ] [ ] [ I [ [ [ [ I ] [ [ [ I ] [ [ [ I [ [ ] [ I [ ] 0.0 0.1 0.2 0.3 0.4
Frequency (Time Step 3 years)
Figure 3. Spectral
power
of the composite
deuterium
excess
and •O records
versus
frequency
(the highest
frequency corresponds to 1/(2'3 years). The original data were resampled with an equidistant interval of 3 years. The spectra were calculated using the maximum entropy method (MEM of the order of 40 corresponding to sample frequency of 256 data points) and the multi-taper method (number of tapers is 3). Statistical significance has been tested against a red noise spectrum using the MTM method. We used the spectral analysis $$A-MTM tool kit version 4.
water vapor source regions, we will try to better quantify both isotope series in terms of temperature variations by using a simple Rayleigh-type distillation model.
3. Modeling
The mixed cloud isotope model (MCIM) model [Ciais and Jouzel, 1994] describes in detail the fractionation processes during evaporation at the ocean surface and during phase changes among vapor, liquid, and solid cloud water. As with all of these types of plume models, it is limited by the basic assumption of a single source region from which vapor is transported to the site of precipitation without any further mixing with other air masses. Though this is a serious limi- tation, these models enable us quantifying both isotope
series
(6•O, d)simultaneously.
The simultaneity
is an im-
portant point since the isotopic composition, even in the most simple and conceptual Rayleigh model [Dansgaard, 1964], actually is sensitive to the temperature difference between the evaporation source and the site of condensation, both possibly varying independently. Therefore applying a constant isotope/condensation-temperature relation implicitly assumes not only a constant (seasonally and re- gionally) contribution of the vapor source regions to the
total precipitation but also that the climate conditions in the source regions have not changed significantly. However, using the deuterium excess we have access to information on
the climate conditions at the sea surface and are able to
correct
the interpretation
of the 6•O signal in terms of local
temperature variations by the simultaneous SST signal. Vice versa, the deuterium excess depends, though weakly, on the condensation temperatures too, mainly via the temperature
dependence
of both (6•O and 6D) equilibrium
fractionation
coefficients or. The objective of this section is therefore a
temperature
interpretation
of the 6•O record taking into
account the changes in the source region as documented by the deuterium excess and, vice versa, a simultaneous interpre-
tation of the excess in terms of climate variations at the sea
surface corrected by the condensation temperatures, i.e., the 6•O record.
The MCIM model calculates 6•O and d in polar
precipitation depending on the relative humidity RHse a, the wind velocity w, the temperature at the ocean surface Ts,, and the condensation temperature Tco.d. At the beginning of the hydrological cycle the vapor formed at the ocean surface is calculated under the assumption of a global closure condition
of the water
isotopes
[Merlivat and Jouzel, 1979]:
Here 15w.
p denotes
the isotopic composition
of the formed
vapor, et the equilibrium fractionation between vapor and liquid, h is the relative humidity above the sea surface and k is a kinetic fractionation that depends smoothly on the wind
regime
(k is about 6%0 for H2180 in a wide range of wind
speed). Subsequently, the vapor is cooled down to its condensation point from which on the coexistence of vapor, liquid and solid is taken into account by the MCIM model. An additional kinetic fractionation process becomes important at low temperatures during formation of ice crystals. In our model, this hardly investigated fractionation mechanism is parameterized by a temperature-dependent supersaturation function S according to Jouzel and Merlivat [1984] and Petit et al. [1991]. For polar sites this function describing the supersaturation of liquid in the appearance of ice is the most important tuning parameter. This mechanism is responsible for the approximately linear relation between the isotopes and the condensation temperatures even at very low temperatures (-20 ø --60øC) [Petit et al., 1991]. Since the supersaturation is hardly known from direct observations a simple linear parameterization by cloud temperatures, Tcona,
has been chosen. In our case the model is tuned to simulate
satisfyingly
the seasonal
cycle of 6•O and d at the Summit
site for the period from 1970 to 1980 by playing solely on the supersaturation function S which was tuned to S=l.003- 0.007*rcond ' For further details of the tuning process see Hoffmann et al. [1998]. In agreement with other similar studies [Johnsen et al., 1989] we identified the subtropical North Atlantic as the most important source region with a mean relative humidity of 79% and a mean temperature of
26.1øC.
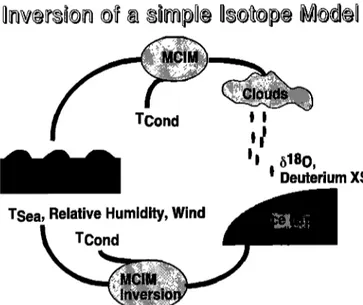
After this tuning process we perform a simple "inversion" of the MCIM model (see Figure 4). The model is modified to find by a simple trial and error algorithm for each pair of ob-
served
15•80
and
d the corresponding
Tse,,
and
Tco,,
• under
the
assumption
that the relative humidity (constant
79%), and
ß
nd f!
!1 6180,
I Deuterium
XS
TSea,
Relative
Humidity,
Wind
Figure 4. Scheme of our methodology to reconstruct sea surface temperatures and cloud condensation temperatures by means of a simple Rayleigh isotope model. Instead of using
this model in the "forward" mode it is here used to find for
each
pair of 15•O
and d a corresponding
solution
for the SSTs
and Tc•ou d given that no other changes affect the isotopic composition.
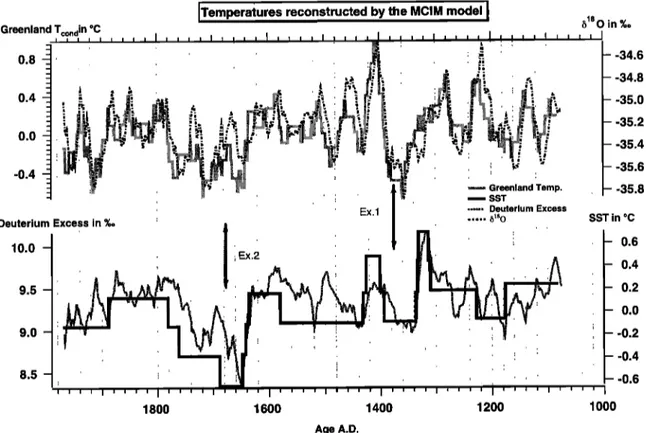
the wind speed (4 m/s) stayed unchanged in the source region. The step-like form of the temperature reconstruction
(see
Figure
5) is due to the measuring
errors
of 0.1%o
for 15•80
and
0.8%0
for d which define
when
a simulated
pair of 15•80
and dis close enough to the observations. This calculation gives a maximum cooling of -0.7øC in the estimated vapor source regions between about 1650 until 1750. As expected
from our discussion above, calculated condensation
temperatures
appear
to be determined
by the 15•80
signal,
whereas sea surface temperatures are determined by the deuterium excess. However, this is not strictly correct, as both isotopic signals also influence one another. For
instance,
a short
"warm" 15•O isotope
signal at around
1400
amplifies the synchronous Ts• a signal by about 0.2øC, thereby reducing the temperature gradient between Tcond and Tse a (see Example 1 in Figure 5). Otherwise, a very large gradient between the source and the precipitation site could not fit with both isotope records.
Another example (Example 2) for the nonlinearity of the temperature reconstruction by the MCIM model is the period of cold sea surface temperatures in the eighteenth and seven- teenth centuries. In fact, after being corrected for these anomalous low Tse,, the corresponding Tco,, d are comparably
cooler
than by just assuming
a constant
15•O/T gradient.
A
part of the problem that the LIA is not clearly seen in many Greenland ice core records might therefore be directly due to synchronous lower sea surface temperatures masking
somewhat
the isotope
signal
(15•O).
With the parameters chosen here for the MCIM model we
yield a mean
temporal
15•O/T
gradient
of 0.7%døC
over the
last 900 years, which is in good correspondence to the spatial gradient over Greenland (0.67%døC) [see Johnsen et a/.,1989] However, this result depends crucially on the validity of our basic assumptions: an unchanged vapor source region for central Greenland and a constant relative humidity over the subtropical North Atlantic. The isotopic signal we found here could alternatively be explained by variations of the relative humidity near the sea surface of the order of 5%.
For the climatic conditions (central Greenland) and the time
period (the last millennium) considered here this gives us roughly a sensitivity for the deuterium excess of-0.2%0/% for the relative humidity and 1.3%døC for the sea surface temperature. Our crude estimate of Ts•,, variations of about - 0.8øC during the LIA is, however, consistent with SST recon- struction for the northern Saragossa Sea being about-IøC cooler than today [Keigwin, 1969]).
4. Discussion
In the discussion we will mainly focus on two question: (1) What is the reason for the weak L/A signal in isotope records of central and southern Greenland? (2) Is the sawtooth-like structure of 15•O and d real and are they indeed anticorrelated? What could possibly be the mechanism linking the two records?
There might be several reasons for the astonishing fact that isotope records of central and south Greenland do not show a clear LIA (or MWP), whereas this signal becomes increasingly clear in ice cores from northwest Greenland. First, the most simple explanation is, of course, that central southern Greenland was indeed consistently warmer during
HOFFMANN
ET AL.: DEUTERIUM
EXCESS
14,271
Greenland 0.0 -0.4 Deuterium Excess in %o 10.0 - 915 -- 9.0 -- •s O in %øITempera{ures
reconstructed
by
the
MCIM
model
I
Tcondin øC I [ I I I [ I I I [ [ [ [ • I [ • [ • ] • ] [ , I • , • [ I • [ [ ] I ] • [ I [ [ ] • [ I • [ [ i ß s::.. ... •. ' ....
'
•[?½ •:•[[•[}•[•[•[
• •
...
•r•nland
T•mp.
I ' ß ... Deuterium Excess . • : : 8.5 -- - -34.6 i -3418 - -35,0 - -35.2 i -35.4 - -35.6 - -3518 Ex.1Ex.2 •:••lll•
--
., • :••_. i•
•.•.,
i •-x •_: ...-'i
k.
,
•
,
ß, .
• i • i i i : : i i I i i i i I i i i i i i i i I i i : i i : i i , I i i i i i ' i ' i l 1800 1600 1400 1200 1000 SST in øC - 0.6 0.4 0.2 0.0 -0.2 -0.4 -0.6 Age A.D.Figure
5. Twenty
years
running
mean
of 6:SO
(top
panel)
and
deuterium
excess
d (bottom)
from
the stacked
central
Greenland
ice cores
shown
with the reconstructed
anomalies
of the condensation
temperature
(top) and
the
corresponding
anomalies
of the
sea
surface
temperalure
(bottom).
The square
shape
form
of the temperature
reconstruction
originates
from
the experimental
uncertainties
of b:SO
(0.1%•)
and
d (0.8%•).
The inversion
procedure
of the MCIM model
calculates
solely
a new
pair of temperatures,
T•o,d
and T,,e,
•, when
the
corresponding
isotope
values
exit this interval
of uncertainties.
Example
1 (Exl) and
Example
2 (Ex2)
demonstrate
the nonlinear
temperature
reconstruction
of the MCIM discussed
in more
detail
in the text.
the LIA than the north and northwest. For the moment we
have no observation or theory that might explain such a
partial climatic decoupling
of both regions. Second,
since
central and south Greenland are more exposed to cyclonic
activity in the North Atlantic, the signal (in this case a
possible
cooling during
the LIA)to noise ratio might be
more favorable in the North. Third, northwest Greenland is located at the end of the distillation column which, typically
starting in the North Atlantic source regions produces
successively
more and more depleted
precipitation. The
temperature
sensitivity
of this process,
thus the •:sO/T
gradient,
becomes
increasingly
larger
at the very end of the
vapor
rainout
process
[Dansgaard,
1964]. This holds
though
the kinetic process
during
ice formation
mentioned
above
largely dampens
this steepening
of the isotope/temperature
relation [Jouzel and Merlivat, 1984]. In the work of
Rozanski et al. [1993] the authors gave for all nonpolar
stations
(with a mean annual
temperature
below 15øC) of the
global network
of isotopes
in precipitation
(GNIP) a mean
gradient
of 0.58%døC, for south and west Greenland
a
gradient
of 0.67%døC
and for East
Antarctica
0.79%døC.
In
north and northwest Greenland therefore a temperature
variation of the same amplitude might produce a larger
isotope
signal
due to a stronger
isotope/temperature
gradient
at a later stage of the distillation process. Fourth,
simultaneous
changes
in SSTs might slightly shadow
the
changes
in temperature,
as was shown
in our model
calcula-
tion above.
For the argument
being valid it requires
that the
vapor
sources
of north and
northwest
Greenland
are different
from those of the rest of Greenland and that they did notundergo
the same SST variations.
Indeed,
hints from
modeling
studies
exist confirming
that northwest
Greenland
is under
stronger
influence
of water vapor originating from
the Pacific ocean than central and south Greenland [Charles et al., 1994; Werner et al., 2000a].
However,
a completely
independent
argument
tells us that
we should take the GRIP isotope record as a reliable climate indicator even for the high-frequency oscillations (that
means
at least 100 years)
during
the Holocene.
In the work of
Willemse and Toernquist
[1999] the authors
showed
a very
good
agreement
between
the
GRIP
6:SO
signal
and
the paleo-
productivity
records
reconstructed
from
a near
coastal
lake in
the southwest of Greenland throughout the entire Holocene.This important
observation
excludes
the possibility
that we
are dealing here just with artefacts
of the water isotope
physics,
though a careful
analysis
might be needed
to
calculate from the isotope record the actual temperature signal.This discussion about the missing LIA signal in the water
isotopes
concerns
equally
the lack of any cool signal
in the
nineteenth
century
and of a warming
signal
over the last 100
years.
Partly,
this might
be due
to the extreme
noisiness
of
the excess
record
during
the most
recent
period
(see
Figure 2).
other. The ongoing global warming is regionally covered by circulation-driven temperature anomalies. Decadal-to-inter- decadal variability associated to the North Atlantic Oscillation (NAO) lead over certain periods to comparably cool conditions around Greenland (i.e., empirical orthogonal function (EOF) 1 for the global warming signal and EOF 3 for the NAO associated pattern in Figure 2 in the work of Mann et al. [1998]. However, even if such a cancelling effect is true for the twentieth century, it should not play any important role for the nineteenth century, which is docu- mented as particularly cool [Mann et al., 1998].
Obviously, the definition of the cooling cycles in Figure 2 is not straightforward. We need certainly longer time series of both isotopes to verify more quantitatively the discussed
6•O-d pattern. What mechanisms
might possibly be
responsible for that kind of anti-correlation between the excess (i.e., temperatures in the source regions of Greenland's precipitation) and the isotopes (i.e., local temperatures in central Greenland)?
1. Barlow et al. [1993] analyzed the isotope signal
(6•O and excess)
in the upper
part of the GISP2 core (central
Greenland as well) in a subannual resolution. Temporally, the core covers roughly the period for which direct meteorological observations are still abundant in the North Atlantic region, i.e. from 1840 to 1970. At least seasonally,
the authors found an anticorrelation between the excess and
the isotopes as in our record here though on a much shorter timescale. They explained such behaviour by analyzing meteorological data over the last 40 years during high and low phases of the NAO. During high phases of the NAO, i.e., during conditions of a particularly strong pressure gradient between Island and the Azores, Greenland's temperature are anomalously low, whereas Europe is warmer than normal. Simultaneously, stronger zonal winds amplify the wind- driven circulation in the North Atlantic and intensify the transport of comparably warm surface waters northward. This leads to a stronger temperature gradient between Greenland (colder than normal) and its source regions (warmer than normal). Conversely, during low phases of the NAO the temperature seesaw turns to the other side (Greenland warmer than normal and Europe colder), the zonal circulation weakens, thereby producing anomalously low SSTs between 40 ø and 30øN in the North Atlantic. Obviously, such a scenario could very well explain an anticorrelation between the excess linked to the SSTs and the isotopes controlled by local temperatures. Further arguments for this concept applied to the centennial timescale considered here comes from a paper by Keigwin and Pickart [1999]. Analyzing high-resolution sediment cores from the Laurentian fan (43 ø- 44øN, 56ø-54øW) and comparing these results with the former
ones from the Bermuda rise, the authors state that at least
during the last 2000 years there is a North Atlantic temperature seesaw into action. According to Keigwin and Pickart [1999] this seesaw turns around approximatel• 44øN and leads to temperatures out of phase north and south of this apparently critical latitude. Colder temperatures during the LIA, for example, are accompanied by warm anomalies (1ø- 2øC) north of it. To explain these results, the authors refer to the known interannual and decadal SST variability which was discussed by Barlow et al. [1993] as well and suggest an enhanced NAO variability during the LIA. However, as the
authors mention, this is in contradiction to results from
Greenland, indicating no exceptionally high phase of the
NAO during the LIA [Appenzeller et al., 1998]. Moreover, such a mechanism affects the temperatures (and the water isotopes) over the ocean and over Greenland nearly instanta- neously. It therefore seems to us not clear how it possibly has lead to such phase lags as were documented in our com-
bined •O-excess record.
2. Another reasonable mechanism linking both isotope signals, however, might be found in analyzing the variability of the THC. In its present mode of functioning the THC transports warm saline water toward high latitudes,
where it cools and forms Atlantic bottom water. This mecha-
nism represents the most effective way to redistribute heat in the ocean. A possible weakening of the THC during the LIA surely would shift the polar front southward and produce cooler conditions not only in Greenland but also in parts of Europe. The simultaneous blocking of warm water masses in the subtropics, under such conditions less effectively ad- vected to the North, would lead to a compensating warming in low latitudes. These processes fit well to the described
6•aO-d
pattern:
Periods
of gradually
descending
6•O isotope
values, this means local cooling over Greenland, are accom- panied by a correspondingly increasing deuterium excess, indicating a gradual warming of lowlatitudinal parts of the
Atlantic. A sudden reintensification of the thermohaline
circulation might explain the abrupt jump to cooler conditions in the source regions first, followed by a corre- sponding abrupt warming in high latitudes. During these small rapid events the excess signal leads the Greenland isotope record by approximately 40 years, possibly due to a certain inertia in the coupled ocean/atmosphere/sea ice system at the northern end of the THC.
External forcing factors, such as reconstructed solar activity [Lean et al., 1995] or the atmospheric dust content [Overpeck et al., 1997], which is largely controlled by volcanic eruptions, do not show any resemblance with the deuterium excess record. Even if these factors might have contributed to centennial scale climate variations (for example, the minimum of the excess record roughly coincides with the Maunder sunspot minimum), they seem not to have played a dominating role for the temperatures in the subtropical North Atlantic as given here by our recon-
struction from the deuterium excess.
More evidence for a possible role of the THC even on the comparably short centennial timescale came up recently in a paper of Broecker et al. [1999]. Analyzing various tracers in the deep Southern Ocean, the authors claim a mismatch between modern, comparable low rates of deep water formation and the actual state of the deep ocean appearing relatively "fresh" and well ventilated. In fact, the observations suggest a 3 times more intense average production of deep water in the Southern Ocean during the LIA. In their interpretation the North Atlantic has varied in- versely, forming therefore less deep water masses and trans- porting less heat from low to high latitudes during the same
time period.
Our tentative
interpretation
of the 6•80-d signal
from Greenland seems in general agreement with this hypothesis. However, we propose a compensating effect for the diminished heat transport to high latitudes already in low
latitudes of the North Atlantic, whereas Broecker et al.
[1999] suggest such a compensation rather in the Southern Hemisphere.
Some last remarks to the credibility of the isotopes as a climate indicator which might be biased by atmospheric
HOFFMANN ET AL.: DEUTERIUM EXCESS 14,273
circulation changes: An increasing number of available proxy records from different regions and a more rigorous interpretation of these records gave evidence that the simplifying idea of a globally uniform warm climate at the beginning of this millennium, thus the MWP, followed by a global cooling in the sixteenth and the seventeenth centuries, the LIA, is misleading [Hughes and Diaz, 1994; Mann et al., 1998]. Rather, we are faced with a temporally and spatially heterogeneous pattern of warming and cooling, both potentially influencing the Greenland isotope record: First, a strengthening or weakening of the seasonal cycle of temperature or precipitation amount strongly affects the water isotopes. Recently, it was demonstrated in numerical simulations of the last glacial maximum with atmospheric general circulation models (AGCM)that a shift of the polar front south of Greenland reduces considerably the amount of winter precipitation at Summit. This mechanism shifts the
water
isotopes
toward
higher
summer
i5•O values
and leads
to
a mismatch between real surface temperatures and recon- structed "isotope temperatures [Krinner et aI., 1997; Werner
et aI. 2000b]. Even on the shorter millennial timescale of our
study here such seasonal climate variations might bias our temperature reconstruction. Second, a further risk of our model calculation is a considerable change of the regional vapor sources of Greenland's precipitation. However, tag- ging experiments with AGCMs rather argue for a remarkable constancy of the contribution of the different source areas
[Werner et aI., 2000a]. The reconstructed sea surface
temperature variations must be seen in the light of these considerable uncertainties. Only a long-term simulation of a fully coupled ocean-atmosphere, model which is undergoing
LIA like centennial climate variations, and moreover is fitted
with water isotope diagnostics is able to address directly all these questions for the interpretation of the water isotopes.
Acknowledgments. This study has been funded by EEC within the MilEClim pro, ject, contract number 260504. We like to thank Michel Stievenard, Olivier Cattani, and Sonja Falourd for their assistance at
perIbrming the isotope measurements. Early versions of the
manuscript were improved a lot by the careful reading of Ulrich von Grafenstein, Valerie Masson, and three anonymous reviewers. We further like to thank the team of the SSA-MTM spectral analysis tool kit, in particular Pascal Yiou, for help and for making available this very helpful software.
References
Appenzeller, C., T. F. Stocker, and M. Anklin, North Atlantic oscillation
dynamics recorded in Greenland ice cores, Nature, 282, 446-449,
1998.
Armengaud, A., R.D. Koster, J. Jouzel, and J. Ciais, Deuterium Excess in Greenland snow: Analysis with simple and complex models, J. Geophys. Res., 103, 8947-8953, 1998.
Barlow, L.K., J.W.C. White, R.G. Barry, and P.M. Grootes, The North Atlantic oscillation signature in deuterium and deuterium excess in the Greenland ice sheet project 2 ice core, 1840-1970, Geophys. Res. Lett., 20(24), 2901-2904, 1993.
Boiseau, M., A. Juillet-Leclerc, P. Yiou, B. Salvat, P. Isdale, and M. Guillaume, Atmospheric and oceanic evidences of ENSO events in the south central Pacific Ocean from coral stable isotopic records over the past 137 years, Paleoceanography, 13,671-685, 1998. Bradley, R.S., and P.D. Jones, "Little Ice Age" summer temperature
variations: Their nature and relevance to recent global warming trends, The Holocene, 3,367-376, 1993.
Broecker, W. S., S. Sutherland, and T.-H. Peng, A Possible 20th-Century Slowdown of southern Ocean deep water formation, Science, 286,
1132-1135, 1999.
Charles, C.D., D. Rind, J. Jouzel, R.D. Koster, and R.G. Fairbanks, Glacial-interglacial changes in moisture sources for Greenland: Influence on the ice core record of climate, Science, 263,508-511, 1994.
Ciais, P., and J. Jouzel, Deuterium and oxygen 18 in precipitation: A new isotopic Model including Mixed Cloud Processes, J. Geophys. Res., 99, 16,793-16,803, 1994.
Climate Variability (CLIVAR), Initial Implementation Plan, WCRP 103,
1998.
Cole, J.E., R.G. Fairbanks, and G.T. Shen, Recent variability in the Southern Oscillation: Isotopic results from a Tarawa atoll coral, Science, 260, 17,690-17,693, 1993.
Cuffey, K.M., G.D. Clow, R.B. Alley, M. Stuiver, E.D. Washington, and R.W. Saltus, Large Arctic temperature change at the glacial-
Holocene transition, Science, 270,455-458, 1995.
Dahl-Jensen, D., K. Mosegaard, N. Gundestrup, G.D. Clow, S.J. Johnsen, A.W. Hansen, and N. Balling, Past temperatures directly from Greenland ice sheet, Science, 282, 271-281, 1998.
Dansgaard, W., Stable isotopes in precipitation, Tellus, 16, 436-468,
1964.
Dansgaard, W., S.J. Johnsen, N. Reef, N. Gundestrup, H.B. Clausen, and C.U. Hammer, Climatic changes, Norsemen and modern man,
Nature, 255, 24-28, 1975.
Dansgaard, W., et al., Evidence for general instability of past climate from a 250-kyr ice-core record, Nature, 364,218-220, 1993. Fischer, H., M. Werner, D. Wagenbach, M. Schwager, T. Torsteinsson,
F. Wilhelms, J. Kipfstuhl, and S. Sommer, "Little Ice Age" clearly recorded •n Northern Greenland Ice Cores, Geophys. Res. Lett., 25,
11749-11752, 1998.
Fisher, D.A., N. Reeh. and H.B. Clausen, Stratigraphic Noise in Time Series derived from Ice Cores, Ann. Glaciol., 7, 76-83, 1985. Fisher, D.A., R.M. Koerner, K. Kuivinen, H.B. Clausen, S.J. Johnsen,
J.P. Steffensen, N. Gundestrup, and C.U. Hammer, Intercomparison
of ice core •O and precipitation records from sites in Canada and
Greenland over the last 3500 years and over the last few centuries in detail using EOF Techniques, in Climatic Variations and Forcing Mechanisms of the Last 2000 Years, edited by P.D. Jones, R.S. Bradley, and J. Jouzel, pp. 297-328, Springer-Verlag, New York,
1996.
Hoffmann, G., M. Stievenaard, J. Jouzel, J.W.C. White, and S.J. Johnsen, The deuterium excess record from central Greenland: Modelling and observations, in International Symposium on Isotope Techniques in the Study oj •' Past and Current Environmental Changes in the Hydrosphere and the Atmosphere, pp. 591-602, Int. At. Energ. Agency, Vienna, Austria, 1998.
Hughes, M.K., and H.F. Diaz, Was there a 'Medieval Warm Period', and if so, where and when?, Clim. Change, 26, 109-142, 1994.
Johnsen, S.J., W. Dansgaard, H.B. Clausen, and C.C.J. Langway, Climatic oscillations 1200-2000 A.D., Nature, 227, 482-483, 1970. Johnsen, S.J., W. W.Dansgaard, and J.W.C. White, The origin of Arctic
precipitation under present and glacial conditions, Tellus Set. B, 41,
452-468, 1989.
Johnsen, S., et al., The 8•sO record along the GRIP deep ice core and
the problem of possible Eemian climatic instability, J. Geophys. Res., 102, 26,397-26,410, 1998.
Jouzel, J., and L. Merlivat, Deuterium and oxygen 18 in precipitation, modeling of the isotopic effects during snow formation, J. Geophys. Res., 89, 11,749-11,757, 1984.
Jouzel, J., L. Merlivat, and C. Lorius, Deuterium excess in an East
Antarctic ice core suggests higher relative humidity at the oceanic
surface during the last glacial maximum, Nature, 299,688-691, 1982. Jouzel, J., C. Lorius, J. Petit, C. Genthon, N.I. Barkov, V.M. Kotlyakov, and V.M. Petrov, Vostok ice core: a continuous isotope temperature •ecord over the last climatic cycle (160,000 years), Nature, 239,
403-407, 1987.
Keigwin, L.D., The little ice age and medieval warm period in the
Saragossa Sea, Science, 274, 1504-1508, 1996.
Keigwin, L.D., and R.S. Pickart, slope water current over the Laurentian fan on interannual to millenial time scales, Science, 286, 520-523, 1999.
Krinner, G., C. Genthon, and J. Jouzel, GCM analysis of local influences on ice core • signals, Geophys. Res. Lett., 24(22), 2825-
2828, 1997.
Lean, J., A. Skumanich, and O.R. White, Estimating the sun's radiative output during the Maunder minimum, Geophys. Res. Lett., 22, 3195-
Mann, M.E., R.S. Bradley, and M.K. Hughes, Global-scale temperature
patterns and climate forcing over the past six centuries, Science, 392,779-787, 1998.
Merlivat, L., and J. Jouzel, Global climatic interpretation of the deuterium-oxygen 18 relationship for precipitation, J. Geophys. Res.,
84, 5029-5033, 1979.
Overpeck, J., et al., Arctic environmental change of the last centuries, Science, 2 78, 1251 - 1256, 1997.
Petit, J.R., J.W.C. White, N.W. Young, J. Jouzel, and Y.S. Korotkevitsch, Deuterium excess in recent Antarctic snow, J. Geophys. Res., 96, 5113-5122, 1991.
Rozanski, K., L. Araguas-Araguas, and R. Gonfiantini, Isotopic patterns
in modern global precipitation, in Climate Change in Continental Isotopic Records, Geophys. Monagr. Set., vol. 78, edited by P.K.
Swart, K.C. Lohmann, J. MacKenzie, and S. Savin, pp. 1-37, AGU,
Washington, D.C., 1993.
Stuiver, M., P.M. Groates, and T.F. Braziunas, The GISP2 15•80 climate record of the past 16,500 years and the role of the sun, ocean and volcanoes, Quat. Res., 44, 341-354, 1995.
Vimeux, F., V. Masson, J. Jouzel, M. Stievenaard, and J.-R. Petit, Glacial-Interglacial changes in ocean surface conditions in the Southern Hemisphere, Nature, 398, 410-413, 1999.
Werner, M., M. I-teimann, and G. Hoffmann, Isotopic composition and origin of polar precipitation in present and glacial climate simulations, Tellus, Set. A, in press, 2000a.
Werner, M., U. Mikolayewicz, M. Helmann, and G. Hoffmann, Borehole versus Isotope Temperatures on Greenland: Seasonality does matter, Geophys. Res. Lett., 27(5), 723-726, 2000b.
White, J.W.C., L.K. Barlow, D.A. Fisher, P.M. Groates, J. Jouzel, SJ. Johnsen, M. Stuiver and H. Clausen, The Climate Signal in the Stable Isotopes of Summit, Greenland Snow: Results of Comparisons with Modern Clim•te Observations, J. Geophys. Res., 102 (C12), 26,425- 26,439, 1997.
Willemse, N.W., and T.E. Toernquist, Holocene century-scale temperature variability from West Greenland lake records, Geology, 27(7), 580-584, 1999.
G. Hoffmann and J. Jouzel, IPSL/LSCE Laboratoire des Sciences du Climat et de l'Environnement, UMR CEA/CNRS No. 1572, Orme
des Merisiers, 91191 Gif-sur-Yvette, France (hoffmann@lsce.
saclay.cea.fr).
S. Johnsen, Science Institute, University of Iceland, Reykjavik,
Iceland.
(Received March 1,2000; revised September 18, 2000; accepted September 19, 2000.)
![[PDF] Tutoriel pour Créer des applications AJAX RIA en JavaScript | Formation informatique](data:image/gif;base64,R0lGODlhAQABAIAAAP///wAAACH5BAEAAAAALAAAAAABAAEAAAICRAEAOw==)