HAL Id: hal-01578661
https://hal.univ-lorraine.fr/hal-01578661
Submitted on 20 Jan 2020HAL is a multi-disciplinary open access archive for the deposit and dissemination of sci-entific research documents, whether they are pub-lished or not. The documents may come from teaching and research institutions in France or abroad, or from public or private research centers.
L’archive ouverte pluridisciplinaire HAL, est destinée au dépôt et à la diffusion de documents scientifiques de niveau recherche, publiés ou non, émanant des établissements d’enseignement et de recherche français ou étrangers, des laboratoires publics ou privés.
Below-ground fine-scale distribution and soil versus fine
root detection of fungal and soil oomycete communities
in a French beech forest
Aurore Coince, Olivier Cael, Cyrille Bach, Juliette Lengelle, Corinne Cruaud,
Frédérick Gavory, Emmanuelle Morin, Claude Murat, Benoit Marçais, Marc
Buee
To cite this version:
Aurore Coince, Olivier Cael, Cyrille Bach, Juliette Lengelle, Corinne Cruaud, et al.. Below-ground fine-scale distribution and soil versus fine root detection of fungal and soil oomycete communities in a French beech forest. Fungal Ecology, Elsevier, 2013, 6 (3), pp.223-235. �10.1016/j.funeco.2013.01.002�. �hal-01578661�
Accepted 14 December 2012 Fungal Ecology, 6: 223-235 Doi: 10.1016/j.funeco.2013.01.002
Below-ground fine-scale distribution and soil versus fine root
detection of fungal and soil oomycete communities in a
French beech forest
Aurore Coince1, Olivier Caël1, Cyrille Bach1, Juliette Lengellé1, Corinne Cruaud2, Frédérick Gavory2, Emmanuelle Morin1, Claude Murat1, Benoît Marçais1,§, Marc Buée1,§,*
1 INRA, UMR1136 INRA Université de Lorraine "Interactions Arbres / Micro-organismes", IFR110 EFABA, Centre INRA de Nancy,
54280 Champenoux, France
2 CEA-Institut de Génomique, Génoscope, Centre National de Séquençage, 2, rue Gaston Crémieux, CP 5706, 91057 Evry cedex,
France
* Corresponding author. Marc Buée INRA, UMR1136, Route d’Amance, 54280 CHAMPENOUX, France. Tel: +33 383 39 40 72. Fax: +33 383 39 40 69. E-mail address: buee@nancy.inra.fr
§ Authors who equally lead the work
ABSTRACT
The use of next-generation DNA sequencing methods, which produce massive volumes of data, has transformed fungal molecular ecology. These technologies offer the opportunity to describe microbial communities in depth and to investigate fungal diversity at a large geographical scale. In particular, due to the emergence of studies conducted at a large scale (countries, continents), the definition of a compromise between the optimal and representative description of local diversity (plot scale) and the management of a greater number of sites for these studies is required. This work was performed to explore the local richness and the structure of the ectomycorrhizal (EcM) fungal and oomycete communities in a temperate beech plot using 454 pyrosequencing technology. The internal transcribed spacer (ITS-1) region was amplified and sequenced from fine roots and soil sampled from the two upper horizons. Our analyses suggested that soil could be a good substitute for fine roots in studying EcM fungi. The fungal assemblage exhibited a vertical distribution in the soil profile. Only four Pythiaceae were identified, which was insufficient to study the spatial distribution of this group. The fungal and particularly the ectomycorrhizal (EcM) richness was not correlated with any soil variable (pH, C, N or P), but the spatial structure was explained by the C:N ratio and phosphorus content. Our data reveal the importance of maintaining a minimal representative sampling at the plot scale for comparative geographical studies.
Keywords: spatial distribution, diversity, ectomycorrhizal fungi, oomycete, Phytophthora, soil, fine roots, Fagus
Introduction
Soil microorganisms are important components of forest ecosystems and can be intimately linked with forest trees through symbiotic, mutualistic or pathogenic interactions. Fungal microorganisms such as saprotrophic or mycorrhizal fungi are involved in important functions within the soil in relation to nutrient cycling (Smith & Read 2008; Courty et al. 2010), water dynamics and disease control that are essential for the health and growth of forest trees. In contrast, some soil microorganisms are pathogens, such as Phytophthora species belonging to the Pythiaceae (Stramenopiles kingdom). These species are involved in forest declines and dieback (Erwin & Ribeiro 1996), participating in tree selection and causing important economic losses. In general, soil microorganisms are highly diverse and are not randomly distributed at broad or local scales (Green et al. 2004). However, compared to plants and animals, little is known about the community structure and spatial distribution of microorganisms, mainly due to technological limitations. Indeed, morphological-based methods, such as fungal sporocarp monitoring (Buée et al. 2011), root-tip morphotype inventories (Tedersoo et al. 2003) and oomycete spore baiting (Hansen & Delatour 1999; Fichtner et al. 2007), require considerable expertise and time. Additionally, these methods may not be exhaustive, which could explain the relative underestimation of some microbial communities (Hibbett et al. 2011). This is particularly the case for Pythiaceae, which are important soil pathogens (Erwin & Ribeiro 1996; Hansen & Delatour 1999; Brasier 2009).
New sequencing techniques, such as high-throughput pyrosequencing (Margulies et al. 2005), provide a great opportunity to further investigate microbial communities at different scales. Recently, numerous studies have employed 454 sequencing to highlight the extraordinary fungal diversity in soil or on plant roots, including that of EcM fungi, which are found in the vicinity of tree roots (Öpik et al. 2009; Buée et al. 2009; Tedersoo et al. 2010, Tedersoo et al. 2011; Jumpponen et al. 2010; Wallander 2010; Kauserud et al. 2012). High-throughput sequencing represents an excellent tool for describing soil fungal communities and characterising their structure on a larger scale. However, pathogenic species belonging to the Pythium or Phytophthora genera are widespread and play important roles in natural ecosystems, but the available molecular methods for characterising their communities from environmental samples have not yet been seriously assessed (Arcate et
al. 2006; Cooke et al. 2007). A recent study reported the development of a molecular approach to detect Phytophthora species from soil samples using novel sets of genus-specific primers designed against internal
transcribed spacer (ITS) regions. However, attempts to detect Phytophthora species in numerous environmental samples remain unsuccessful (Scibetta et al. 2012). Moreover, oomycetes have not been well studied at the community level compared with fungi or bacteria (Rousk et al. 2010). Although baiting methods have provided some insight into the diversity of the Phytophthora communities in natural ecosystems, these techniques require a long time to implement, which strongly limits the ability to describe these communities (Hansen & Delatour 1999; Jung et al. 2000; Cooke et al. 2007; Balci et al. 2007). As a consequence, few studies have explored the distribution of the oomycete community in forest soils at the stand scale (Hansen & Delatour 1999; Gomez-Aparicio et al. 2012), and none of these investigations has used next-generation sequencing.
At a local scale, ectomycorrhizal (EcM) fungi may exhibit a discrete or extended patch distribution (Pickles
et al. 2010). The relative spatial distributions of sporocarps and fungal mycelia are known to differ significantly,
and has been particularly well studied among EcM fungi (Jansen & de Nie 1988; Peter et al. 2001). It is also reported that locally, the spatial distribution of EcM hyphae does not follow that of their mycorrhizas (Van Der Linde et al. 2009) and that the relative abundance of mycorrhizas and mycelia differs between fungal species (Kjøller 2006). There is also evidence that the mycelium and mycorrhiza of the same species are segregated vertically throughout the soil layers (Genney et al. 2006). In boreal forests, fungi are distributed in the vertical soil profile, with saprobes dominating in the litter and mycorrhizal fungi showing abundance in the humus layer (Lindahl et al. 2007).
Several factors may explain this heterogeneous spatial distribution of microorganisms, but such environmental factors are still poorly understood (Rousk et al. 2010). Ascomycetes have been suggested to respond to soil chemistry, water and resource concentrations at small scales, rather than to the type of land (Green & Bohannan 2006). Soil pathogens exhibit a spatial pattern that depends on the vegetation present and soil characteristics. For example, the soil water regime and soil texture, i.e., the proportion of sand, are major factors impacting the distributions of Phytophthora and Pythium species (Hansen & Delatour 1999; Jung et al. 2000; Gomez-Aparicio et al. 2012). However, the perception of the fungal community structure is largely dependent on the sampling effort and strategy applied, and characterisation of spatial patterns has proved to be difficult with small size samples (Withcomb & Stutz 2007). Indeed, undersampling has been stressed as biasing conclusions about the spatial scaling of microbial diversity (Green & Bohannan 2006).
A better understanding of the spatial distribution of filamentous soil microorganisms is essential both to gain knowledge about the ecology of these communities and to plan sampling for future studies (Taylor 2002). This point is particularly crucial for EcM fungi because their extramatrical structures are highly variable between different species (Agerer 2001). Moreover, while emergent large-scale studies require a multiple-stand
However, the sampling strategies applied at local scales differ greatly between studies comparing plots (Buée
et al. 2009, Lilleskov et al. 2004), and the development of a standardised sampling method is, therefore, of great
interest (Cox et al. 2010). Furthermore, for EcM communities, the handling of root tips (including washing and fastidious selection of living vs. dead or mycorrhizal vs. non-mycorrhizal specimens) remains a laborious component of studies that undermines the potential of high-throughput approaches. Examining soil could potentially be an alternative method for investigating the EcM community in particular. For oomycetes, baiting is classically performed directly in soil samples (Davison & Tay 2005).
The main aim of this study was to thoroughly explore the fungal (EcM) and oomycete community associated with beech trees in a relatively homogeneous plot to propose a compromise between sampling and sequencing efforts for high-throughput studies. For this purpose, we investigated the spatial (horizontal and vertical) distribution of these microorganisms in relation to a number of edaphic parameters and compared the fine root system against bulk soil as microbial reservoirs. We tested the following hypotheses: (1) the fungal and oomycete communities are not evenly distributed within the plot but instead show a spatial structure, possibly related to environmental factors; (2) sampling a limited set of trees enables the microbial community of a relatively homogeneous plot to be described; and (3) the soil fungal community is as effective as the fine root fungal community for describing ectomycorrhizal diversity using next-generation sequencing.
Materials and methods
Site description and sampling
The Lignéville (Vosges, France) forest is a temperate forest (48°07’32’’N, 5°59’51’’E) situated at 380 m elevation. The experimental plot was established in a 3500 m2 area dominated by 90% beech (Fagus sylvatica), along with a few oak and spruce trees. All of the contiguous beech trees in this area were selected for the study (n = 20 trees). The diameter of the trees at a 1.30 m height ranged from 30 to 80 cm. The litter was removed, and four soil cores (8 cm diameter) were collected at 1 m from the trunk base of each tree. The four cores were combined, with the upper (0 to 10 cm deep) and lower (10 to 20 cm deep, sandy loam) horizons kept separate. The samples were collected on 11 December 2009 and were kept frozen until processing. Soil analyses of sub-samples were carried out by the Laboratoire d’Analyse des Sols d’Arras (http://www5.lille.inra.fr/las) to determine the pH (water method), total carbon (C) and total nitrogen (N) contents (NF ISO 10694 and NF ISO 13878) and phosphorus (P) content (Duchaufour & Bonneau 1959).
The root system present in each sample was separated from the soil using a 5 mm sieve. The remaining soil was gently cleaned from the roots in tap water, and the coarse roots were discarded (diameter > 2 mm). The fine roots (including root tips and residual adhering soil) were then lyophilised and ground with a mortar and pestle. Total genomic DNA extraction was carried out using the DNeasy Plant Mini Kit (Qiagen) for fine root samples (50 mg of the homogeneous powder) and the Fast DNA Spin Kit for Soil (MPBio) for soil samples (500 mg of homogeneous wet soil). Approximately 15 mg of polyvinylpolypyrrolidone (PVPP) was first added to each sample, and the manufacturers’ instructions for the kits were then followed. The genomic DNA was then purified twice in PVPP columns.
PCR amplification, amplicon purification and library preparation
Upper and lower horizon samples were processed independently. The fungal ITS1 region (Schoch et al. 2012) was amplified from both the fine root and soil DNA with the ITS1F (CTTGGTCATTTAGAGGAAGTAA) and ITS2 (GCTGCGTTCTTCATCGATGC) primers (Gardes & Bruns 1993). ITS1F was chosen over ITS1 because the latter primer binds to plant DNA more easily (Gardes & Bruns 1993 and personal unpublished results), which could decrease the fraction of fungal reads. The oomycete ITS1 region was amplified only from the soil samples using nested PCR: the first round was performed with the ITS6 (GAAGGTGAAGTCGTAACAAGG) and ITS4 (TCCTCCGCTTATTGATATGC) primers (White et al. 1990), and the second round with the primer pair ITS6 and ITS7 (AGCGTTCTTCATCGATGTGC) (Cooke et al. 2000). For 454 Titanium pyrosequencing of multiplexed samples, the forward primer (ITS1F or ITS6) was linked to a 4-base multiplexed identifier (MID) and adaptor A (CGTATCGCCTCCCTCGCGCCATCAG), whereas the reverse primer (ITS2 or ITS7) was adjoined with adaptor B (CTATGCGCCTTGCCAGCCCGCTCAG).
The amplification mixture was prepared in a 20 µl volume, obtaining final concentrations of 0.4 X enzyme buffer, 1.5 mM MgCl2, 1.12 mg ml-1 BSA, 0.2 mM each dNTP, 0.2 µM each non-tagged primer (ITS6 and ITS4) or 0.8 µM each tagged primer (ITS1F and ITS2 or ITS6 and ITS7) and 0.05 U µl-1 Sigma Taq polymerase. The GeneAmp 9700 system was used with the following program for fungi: 5 min at 95°C, followed by 35 cycles of 30 sec at 95°C, 40 sec at 53°C and 45 sec at 72°C, with a final step of 7 min at 72°C. For nested PCR, the first round consisted of 5 min at 95°C, followed by 20 cycles of 30 sec at 95°C, 40 sec at 53°C and 1.5 min at 72°C,
with a final step of 7 min at 72°C. The first-round amplicons were diluted 10 times, and the second-round program was as follows: 5 min at 95°C, followed by 30 cycles of 30 sec at 95°C, 40 sec at 53°C and 10 sec at 72°C, with a final step of 7 min at 72°C.
Four 20 µl reactions were run in parallel for each sample, which were then pooled and purified on an MSNU030 MultiScreenHTS PCR Plate (Millipore Corporation), with two washes using 100 µl of H2O and solubilisation of the amplicons in 40 µl of H2O. The concentration of the purified tagged amplicons was measured three times with a NanoDrop® ND-1000 spectrophotometer, and equimolar pooling was carried out. In total, we obtained three independent libraries of 40 samples, corresponding to fine root-associated fungi, soil fungi and oomycetes from soil. Thus, three independent runs were conducted with 40 MIDs each, in equal proportions. The 454 pyrosequencing was performed by Génoscope (Evry, France). The raw data were deposited on the Sequence Read Archive website (http://www.ncbi.nlm.nih.gov/sra) under the project identifier PRJEB583 and the study accession ERP001914. The three libraries are under the following run accessions: ERR185063 (alias run_1.TCA.AQN_AOTS_GK5X8RX01 for soil microbes amplified with ITS1F-ITS2), ERR185064 (alias run_2.TCA.AQN_DOTS_GRD572402 for soil microbes amplified with ITS6-ITS7) and ERR185065 (alias run_5.TCA.AQN_BOTS_GJVVFSH05 for fine root-associated fungi amplified with ITS1F-ITS2).
Bioinformatics analysis
The sequences were sorted into different files according to their multiplex identifier (MID) using sfffile software, with no mismatches allowed for the MIDs, which were then removed. The sequences were cleaned (trimming and denoising) with trim.flows in Mothur version 1.20.1 with the default parameters (Schloss et al. 2009). The internal transcribed spacer 1 (ITS) was extracted using Fungal ITS extractor, version 2 (Nilsson et
al. 2010). After extraction of the ITS1 region, the sequences were filtered based on a minimal length of 100 bp.
Out of a total of 362 660 sequences, 212 285 (58.5%) corresponding to the three libraries, were retained for downstream analyses. Molecular operational taxonomic units (MOTUs) were generated after six successive clusterings using Uclust version 3.0 (Usearch version 5.2.32) with the parameter iddef = 2 (Edgar 2010) at a 97% similarity. The first clustering included all of the sequences, and subsequent clusterings were conducted with the batch of consensus sequences from the previous clustering. This allowed the redundancy of the MOTUs to be decreased (data not shown). Taxonomic assignation of a consensus sequence (available upon request) generated by Uclust was performed against a curated GenBank database (Feb 2012), excluding environmental sequences, using the Basic Local Alignment Search Tool algorithm Blastn version 2.2.23 (Altschul et al. 1990) with the filter turned off (i.e., segments of the query sequence with a low compositional complexity were not masked off). In addition, an R house script was used to assign MOTUs with the following selected criteria: e-value e-50, identity > 90 % for the genus and 97 % for the species level. Some synonyms were corrected using the online Species Fungorum database (http://www.speciesfungorum.org). The MOTUs assigned to the same species were subsequently grouped together, further reducing the total number of MOTUs. Unassigned MOTUs were considered to correspond to fungi because the applied ITS1F-ITS2 primer pair shows good specificity for the detection of Dikarya.
Statistical analyses
The two horizons were compared regarding their edaphic parameters with Student’s t-test, using the t.test function in R. To assess the suitability of the sequencing depth and sampling effort required to estimate microbial diversity, species accumulation curves were computed using the specaccum function of the vegan R package (R Core Development Team 2008; Oksanen et al. 2011). The rarefaction method was applied. Prior to rarefaction, one randomly chosen sequence per MOTU was discarded to eliminate singletons (MOTUs supported by only one sequence), as suggested by Unterseher et al. (2011). Four sequencing efforts were tested with respect to rarefaction accumulation trees, corresponding to 100%, 75%, 50% and 25% of the 210 134 retained sequences. Additional rarefactions were performed for each habitat independently (SS, soil from the superior horizon; SI, soil from the inferior horizon; RS, fine roots from the superior horizon; and RI, fine roots from the inferior horizon) considering the ITS1F-ITS2 dataset, because only this primer pair was used in all four habitats.
The term fungal community will be used to refer to the entire set of MOTUs. The MOTUs were categorised as EcM fungi if they were assigned to a genus or a species described as such or suggested to be a putative EcM fungus in the literature (Rinaldi et al. 2008; Smith & Read 2008; Tedersoo et al. 2010). The rarefied fungal richness was estimated with rarefaction curves (rarefy function from the vegan R package, singletons removed) including 7 600 fungal sequences per tree, which was the minimum sequencing depth available. Then, the rarefied EcM richness was determined by multiplying the rarefied fungal richness by the proportion of EcM sequences per sample. In addition, to compare the four habitats (SS, SI, RS, RI), the rarefied fungal and EcM
richnesses per sample were estimated when applicable at a depth of 1 100 sequences (ITS1F-ITS2 dataset only, >15 samples per habitat).
The community structure was analysed at two levels: (i) the plot level, consisting of the samples obtained by merging the samples from each tree (n=20); and (ii) the tree level, considering only the sequences from the ITS1F-ITS2 dataset, with samples from the four different habitats kept separate (n=80). As one sequence does not necessarily represent one individual and because abundance is biased in other respects (Amend et al. 2010), the binary matrices of the presence of non-singleton MOTUs were computed from the abundance matrices. The binary matrices were used to perform correspondence analysis (CoA) at the plot and tree levels with the dudi.coa function of the ade4 package (Dray & Dufour 2007). The MOTUs present in less than three unit samples, according to the level studied, were discarded to prevent distortion of the CoA analysis by rare MOTUs. The position of a tree or sample on a CoA axis will hereafter be used as a measure of the community composition.
From the binary matrix of MOTU presence at the plot level, a similarity matrix was computed using the Sørensen index, i.e., 2*J / (A+B), with J representing the shared number of species between two trees, and A and B representing the total number of species of each of the compared trees. For this calculation, the designdist function of the vegan R package was used. The matrix of Euclidean distance was computed from the coordinates with the dist function of the stats R package. Mantel’s tests and correlograms were performed using the vegan
mantel and mantel.correlog functions, respectively, with the Spearman method. The distance classes were
calculated following the Sturge equation, as stated by default in the mantel.correlog function. The bioenv function (vegan R package), with a Spearman model and Bray dissimilarity distances, was employed to determine the subset of environmental variables showing the best correlation with the fungal community dissimilarity at the plot level.
A variance analysis using the lm function of R was conducted to test for the effects of the horizon, (superior or inferior), the sample material, (soil or fine roots) and their interaction on the richness and community composition at the tree level. The correlations at the plot level between the estimated richness or the community composition and the edaphic parameters (mean values of the two horizons) were tested with a regression analysis, using the lm function in R.
Results
Microbial diversity
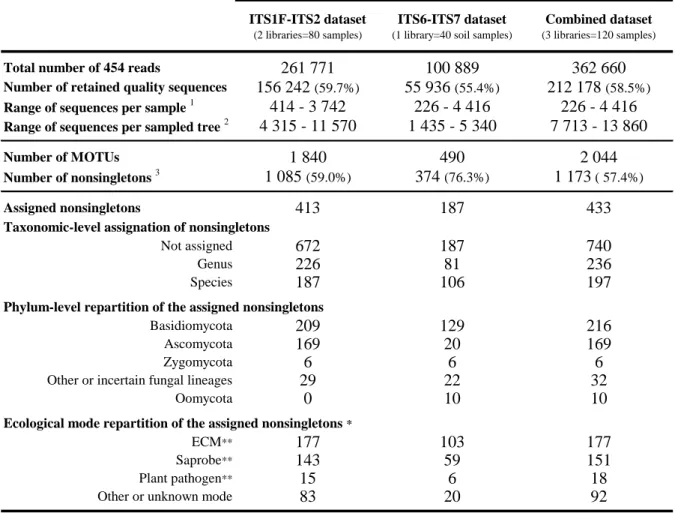
The mean number of sequences per sample after the cleaning steps was 1 768 (min: 226, max: 4 416, Table 1). Approximately 57% of the MOTUs were non-singletons. Only 36.9% of the non-singleton MOTUs could be assigned to a genus or a species. Among these MOTUs, 89% belonged to the Dikarya, and 41% were classified as EcM (Table 1). A total of 630 and 111 non-singleton MOTUs were found exclusively from the soil substratum using the ITS1F-ITS2 and ITS6-ITS7 primer pairs, respectively, while 263 MOTUs were detected by both pairs. Oomycetes were only detected with the ITS6-ITS7 primer pair and only in the soil samples. This primer pair was not as specific as suggested, as it amplified many basidiomycetes in particular (representing 129 of the 187 assigned MOTUs amplified with this primer pair) and even four plant taxa, which were removed from the dataset prior to conducing any analysis. The ITS6-ITS7 primer pair allowed the detection of three EcM MOTUs (Russula rubra, Russula sp18 and Cortinarius armillatus) that were not detected in the soil with ITS1F-ITS2, but these three MOTUs were detected in the fine root habitat with ITS1F-ITS2. The most abundant MOTU (14 321 sequences, abundance will hereafter refer to the number of sequences per MOTU) corresponded to a Saprolegniale (Oomycota, Saprolegniaceae). Only 463 sequences from Pythiaceae (i.e., 0.8% of the sequences from the ITS6-ITS7 dataset) were detected in the plot, representing only a few species: Phytophthora plurivora, an unidentified Phytophthora species from clade 7a (cf Blair et al. 2008), Pythium sylvaticum and an unidentified species of Pythium.
Analysis of the sequences obtained with ITS1F-ITS2 and ITS6-ITS7 primer pairs from the soil and fine root samples together revealed that the 20 most abundant MOTUs (overall number of sequences) were EcM fungi, including seven Russula species (R. brunneoviolacea, R. cyanoxantha, R. ochroleuca, R. vesca, R.
nigricans, R. sp1 and R. ionochlora), two Boletus species (B. pruinatus and B. erythropus), Cenococcum geophilum, Cortinarius sp1 and Elaphomyces sp1 (Table 2). Other abundant MOTUs included six non-assigned
MOTUs that were amplified only with ITS6-ITS7 and two Mortierella species (M. sp1 and M. humilis). There was a significant positive correlation between the log of abundance and the frequency (Fisher’s F = 2 149.5, p<0.001; the frequency refers to the number of trees or samples in which the MOTU was present). Among the MOTUs supported by more than 1 000 sequences, 74.4 % were present on more than 15 trees, while only 14 % where present on fewer than 10 trees. The abundant MOTUs present on less than 10 trees included Cortinarius sp1,
Russula sp1 and MOTU6. The community matrix, including the ecological mode for the identified MOTUs, is
available as a Supplementary Table.
Table 1: Number of sequences and number of MOTUs in the datasets. The number of MOTUs in the combined dataset was not the sum of the two datasets as they were redundant.
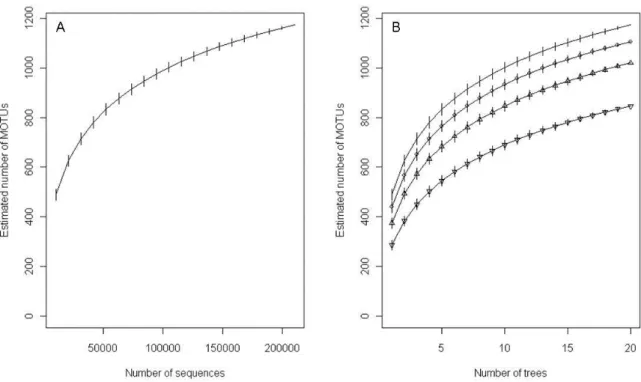
The rarefaction curves tended toward saturation (Fig 1A and 1B). A total of 90 % of the estimated plot richness was retrieved when only 15 out of the 20 trees were sampled with a sequencing effort of 10 500 sequences per sampled tree (Fig 1B). However, it was necessary to sample all 20 trees to achieve such a result if a sequencing effort of 7 880 sequences per sampled tree was employed (Fig 1B). An estimated richness of 1 020 MOTUs was similarly obtained when either 11 trees with 100% of the sequences or 20 trees with half of the sequences per tree were considered. When computed individually for each of the four habitats (fine roots or soil from the upper horizon and fine roots or soil from the lower horizon), the rarefaction curves also tended toward saturation (Fig 2A and 2B).
The fungal and EcM richness estimated from the rarefaction curves ranged from 196 to 308 non-singleton fungal MOTUs per tree (including unassigned MOTUs) and from 71 to 187 EcM MOTUs per tree. The rarefied fungal and EcM richness per tree were positively correlated (F = 4.44, p < 0.0494). The fungal richness was neither spatially structured (Mantel r = 0.0448, p = 0.34) across the plot nor linked to any edaphic parameter, or to the dry fine root biomass (Table 3). This was also true for the EcM richness (Table 3) (Mantel r = 0.0841, p = 0.192).
ITS1F-ITS2 dataset
(2 libraries=80 samples)
ITS6-ITS7 dataset
(1 library=40 soil samples)
Combined dataset
(3 libraries=120 samples)
Total number of 454 reads 261 771 100 889 362 660
Number of retained quality sequences 156 242 (59.7%) 55 936 (55.4%) 212 178 (58.5%)
Range of sequences per sample 1 414 - 3 742 226 - 4 416 226 - 4 416
Range of sequences per sampled tree 2 4 315 - 11 570 1 435 - 5 340 7 713 - 13 860
Number of MOTUs 1 840 490 2 044
Number of nonsingletons 3 1 085 (59.0%) 374 (76.3%) 1 173 ( 57.4%)
Assigned nonsingletons 413 187 433
Taxonomic-level assignation of nonsingletons
Not assigned 672 187 740
Genus 226 81 236
Species 187 106 197
Phylum-level repartition of the assigned nonsingletons
Basidiomycota 209 129 216
Ascomycota 169 20 169
Zygomycota 6 6 6
Other or incertain fungal lineages 29 22 32
Oomycota 0 10 10
Ecological mode repartition of the assigned nonsingletons *
ECM** 177 103 177
Saprobe** 143 59 151
Plant pathogen** 15 6 18
Other or unknown mode 83 20 92
2
sum of the four samples from the four different habitats (see 1 ) per tree
3
MOTUs supported by two sequences at least
* some species are classified as both saprobe and tree pathogen, thus counted twice
** true and putative are summed
1
an homogeneous sample of soil or fine-roots originating from four mixed cores, taken around a beech tree at 0-10 cm or 10-20 cm depth
Figure 1: Rarefaction curves accumulating sequences (A) or trees (B) obtained with the function ‘specaccum’ of the vegan R package. Sequences, obtained with ITS1F-ITS2 and ITS6-ITS7 primer sets, were clustered at 97% and one sequence per MOTU was removed, eliminating de facto the singletons. Four sequencing efforts are presented: 100%, 75% (circle), 50% (triangle) and 25% (inverted triangle) of the 210134 retained sequences.
Figure 2: Saturation curves for four distinct habitats: soil (closed symbols), root (open symbols), organo-mineral horizon (circles), and mineral horizon (triangles) accumulating sequences (‘accumresult’ function of the BiodiversityR R package) (A) or trees (‘specaccum’ function of the vegan R package) (B). Sequences, obtained with ITS1F-ITS2 primer set only, were clustered at 97%. One sequence was discarded per MOTU, eliminating de facto the singletons.
The rarefied fungal richness was significantly lower within the inferior horizon (F = 54.468, p < 0.001) and in the fine root samples (F = 12.299, p < 0.001). There was also a significant interaction between the two factors (horizon * material) (F = 20.815, p < 0.001). However, the rarefied EcM richness was different between the two horizons (F = 15.9351, p < 0.001) but not between the two types of material (F = 0.4939, p = 0.4846). A weak interaction between the two factors was observed (F = 4.4014, p = 0.0398).
Notably, the edaphic parameters (pH, C:N ratio and phosphorus) were significantly different between the two horizons (data not shown), and the fine root system was more abundant in the upper horizon than in the lower horizon, which presented mean dry fine root masses of 5.8 g / tree and 1.7 g / tree, respectively (t = 9.2675, p < 0.001).
Figure 3: Distribution of the twenty beech trees according to their associated fungal and oomycete community on a correspondence analysis (CoA). The CoA was done on presence / absence of 681 MOTUs obtained with ITS1F-ITS2 and ITS6-ITS7 primers (A). The percentages of variation explained by the first and second axis are 13.2 and 9.9 % respectively; the numbers are the tree numbers. Note that trees numbered 4, 11 and 12 are superimposed. Spatial distribution of the twenty beech trees on the experimental plot (B). Dot size was related to the first axis value on the CoA beside, i.e. small dots for negative values and large ones for positive values. The axis values on the CoA were used for statistical tests presented in Table 3.
Microbial structure at the plot level
The soil characteristics showed variability within the plot: the soil carbon content ranged from 26.4 to 59.8 g.kg-1, nitrogen ranged from 1.3 to 2.6 g.kg-1, the C:N ratio ranged from 19.9 to 24.5, phosphorus ranged from 0.08 to 0.10 g. kg-1, and the soil pH ranged from 4.0 to 4.3. The clay:sand ratio measured in the lower horizon was 0.24 ± 0.03.
The 681 MOTUs associated with at least three trees were retained for the CoA computed at the plot level (n = 20 trees) (Fig 3A). The trees in the studied plot were clearly separated on the first axis of the CoA (Fig 3A). The distribution of the trees in the CoA was not linked to the fungal lifestyle (EcM, pathogen or saprobe), as the MOTUs from these three groups were evenly dispersed in the CoA (data not shown). The first axis was positively correlated with one of the geographical coordinates of the trees, with the trees showing a high value on this axis being mainly distributed in the northern part of the plot (Table 3, Fig 3B). The second axis of the CoA was, however, not related to any geographical parameter (Table 3). The Mantel test also clearly indicated that the fungal community showed a spatial structure, with a significant autocorrelation being detected for samples within the 0-15 m distance class (Mantel statistic r = -0.4972, p < 0.05) (Fig 4). The same result was obtained when considering the EcM community alone (r = 0.3, p < 0.05).
The first axis of the CoA was linearly related to the C:N ratio and P content, while the second axis was only related to the P content (Table 3). When only the EcM fungi were considered in the CoA, similar results were observed (indicating a significant relationship between CoA axis 1 and the C:N ratio), although there was no significant relationship with the P content (Table 3). The model showing the best correlation between the environmental variables and the fungal or EcM community data combines two parameters: the C:N ratio and P content. These two variables were positively correlated with the latitude (F = 6.865, p = 0.0174 and F = 5.782, p = 0.0272 for C:N ratio and P soil content respectively).
The EcM fungi that presented a high value on the first axis of the CoA (over 1) were Amanita fulva, A.
porphyria, Cortinarius angelesianus, two unidentified Cortinarius species and Russula mairei. These fungi were
almost exclusively found associated with trees located in the northern part of the plot, where the soil exhibited both a higher phosphorus content and higher C:N ratio. Previously mentioned abundant EcM species, such as
Phytophthora clade 7a, Pythium sylvaticum and Pythium sp1 were associated with 4, 3, 1 and 2 non-adjacent
trees out of the 20, respectively.
Table 2: The twenty most abundant MOTUs in the plot. The abundance was the number of sequences and the frequency was the number of trees (max=20) around which the MOTU was found.
MOTU Abundance Frequence GI number Best BLAST hit Identity E-value
MOTU1 14321 19 323302256 Saprolegnia megasperma 90.3 1,00E-45
Russula brunneoviolacea 12069 17 91199853 Russula brunneoviolacea 98.4 2,00E-90
Russula cyanoxantha 11088 19 22024448 Russula cyanoxantha 99.3 2,00E-66
MOTU2 9257 16 No hit found
Boletus pruinatus 7833 20 61657552 Boletus pruinatus 98.9 3,00E-92
MOTU3 6964 19 323302256 Saprolegnia megasperma 87.8 4,00E-36
Cenococcum geophilum 6917 20 55832969 Cenococcum geophilum 97.8 3,00E-64
MOTU4 5220 20 150439140 Homobasidiomycete sp 90.5 3,00E-27
Mortierella sp1 5213 20 183013810 Zygomycete sp 93.3 6,00E-53
Russula ochroleuca 5193 19 308055381 Russula ochroleuca 100 2,00E-75
MOTU5 4761 18 323302256 Saprolegnia megasperma 89.2 3,00E-36
Mortierella humilis 4512 20 119444359 Mortierellales sp 98.1 3,00E-70
Russula vesca 3868 13 308055461 Russula vesca 100 9,00E-90
Cortinarius sp1 3733 7 57869258 Cortinarius cagei 99.4 6,00E-84
Russula nigricans 3541 15 91199858 Russula nigricans 99.2 8,00E-59
Boletus erythropus 3409 19 300387792 Boletus erythropus 97.9 7,00E-91
Elaphomyces sp1 3396 18 189306999 Elaphomyces cf. granulatus 91.8 2,00E-53
Russula sp1 3137 8 23393838 Russula rosea 96.9 1,00E-82
MOTU6 3013 9 48766839 Saprolegnia semihypogyna 88.5 6,00E-38
Russula ionochlora 2871 12 307159052 Russula ionochlora 97.5 2,00E-72
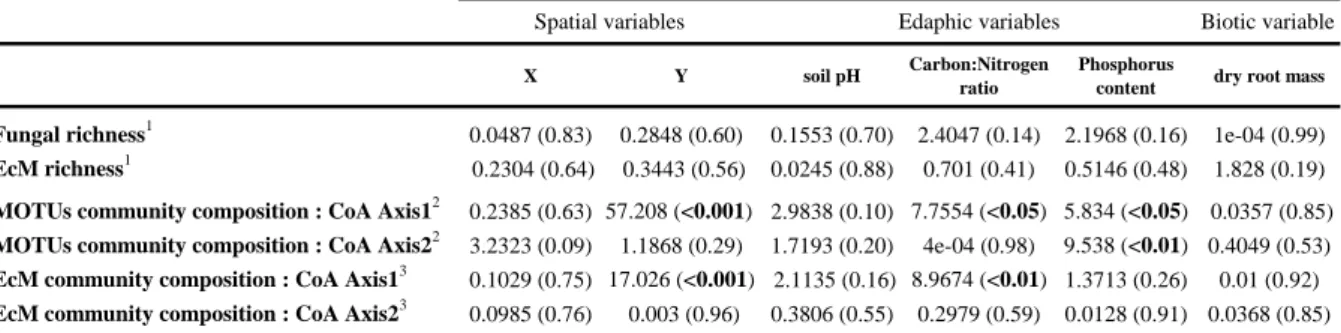
Table 3: Relationships between richness or community composition of MOTUs or of EcM species and environmental variables at the plot level (n=20).
Community composition was defined as the position of the tree on the CoA axis at the plot level (see Figure 3A for CoA with the MOTUs, CoA with EcM species not shown).
Fisher’s F statistics with the probability value into brackets.Significant values (p<0.05) in bold. Each variable was tested independently.
Structure of the fungal assemblage at the tree level
Among the 1 085 non-singleton MOTUs obtained, 681 (58.0%) were shared by the two horizons, whereas 340 (29.0%) were exclusively found in the upper layer, and 152 (13.0%) were exclusive to the lower layer (based only on data obtained with ITS1F-ITS2, as this was the only primer pair used for fine root samples). More than 66 % (118 / 177) of the EcM MOTUs were found in both horizons.
A total of 700 non-singleton MOTUs (64.5%) were shared by the fine root and soil samples, while 193 (17.8%) were exclusively found in the soil samples and 192 (17.7%) in the fine root samples. Among the MOTUs exclusively found in the fine root samples, only 28 (14.6%) were supported by at least ten sequences, and the
Biotic variable
X Y soil pH Carbon:Nitrogen
ratio
Phosphorus
content dry root mass
Fungal richness1 0.0487 (0.83) 0.2848 (0.60) 0.1553 (0.70) 2.4047 (0.14) 2.1968 (0.16) 1e-04 (0.99) EcM richness1 0.2304 (0.64) 0.3443 (0.56) 0.0245 (0.88) 0.701 (0.41) 0.5146 (0.48) 1.828 (0.19) MOTUs community composition : CoA Axis12 0.2385 (0.63) 57.208 (<0.001) 2.9838 (0.10) 7.7554 (<0.05) 5.834 (<0.05) 0.0357 (0.85) MOTUs community composition : CoA Axis22 3.2323 (0.09) 1.1868 (0.29) 1.7193 (0.20) 4e-04 (0.98) 9.538 (<0.01) 0.4049 (0.53) EcM community composition : CoA Axis13 0.1029 (0.75) 17.026 (<0.001) 2.1135 (0.16) 8.9674 (<0.01) 1.3713 (0.26) 0.01 (0.92) EcM community composition : CoA Axis23 0.0985 (0.76) 0.003 (0.96) 0.3806 (0.55) 0.2979 (0.59) 0.0128 (0.91) 0.0368 (0.85) 1
rarefied richness estimated for 7200 sequences per sampled tree 2
axis values of the CoA based on 681 MOTUs and 3 axis values of the CoA based on 107 EcM species
most abundant corresponded to an ericoid mycorrhizal fungus, Oidiodendron sp3 (116 sequences). Notably, 86 % of the EcM MOTUs found in the fine root samples were also retrieved in the soil samples (134 / 155). The EcM MOTUs that were not detected in the soil samples corresponded to six Cortinarius species including C.
delibutus, C. sp18, three Boletus (B. sp2, B. sp3), three Russula, two Cladophialophora, Cenococcum sp3, Exophiala sp2, Tuber puberulum, Hebeloma sp1, Hydnum sp1, Meliniomyces sp2 and Tomentella sp8. In
contrast, some EcM MOTUs were detected in the soil samples, but not in the fine root samples (22 / 156, or 14 %, corresponding to nine Cortinarius, four Russula, four Lactarius, Amanita sp5, Hebeloma radicosum, Hydnum
ellipsosporum, Inocybe lacera and Tomentella sp7).
Figure 4: Mantel correlogram for the MOTUs community at the plot level, based on the binary Sørensen similarity coefficient. Distance class index were the values delimiting distance classes. Negative Mantel statistics correspond to positive autocorrelation. Dark symbols indicate significant Mantel statistics (α=0.05).
Figure 5: Correspondence analysis for fungal (690 MOTUs) (A) or ectomycorrhizal (127 EcM MOTUs) (B) communities in four different habitats of a beech plot (n=80): soil (closed symbols), root (open symbols), superior horizon (circles), and inferior horizon (triangles). A presence/absence matrix of the MOTUs present in at least three samples was used for the correspondence analysis. All the MOTUs considered were obtained with ITS1F-ITS2 primers. The percentages indicate the variation explained by each axis.
The 690 MOTUs present in at least three samples were retained for the CoA. The four investigated habitats, i.e., fine roots or soil from the upper or lower horizon (n = 80), were distinct regarding the microbial
particularly the samples of the upper horizon (negative values of axis 1), from the samples of the lower horizon (positive values of axis 1) (F = 242.15, p < 0.001). There was a significant interaction between the horizon (superior or inferior) and material (fine roots or soil), with the difference between the horizons being far less pronounced for the soil material (F = 36.94, p < 0.001). The second axis explained 15.2% of the variation and was related to the material (F = 19.65, p < 0.001), but not to the horizon (F = 2.22, p = 0.14). The CoA computed only taking into account the 127 EcM fungi present in at least three samples showed a notably different pattern (Fig 5B). The distribution of the samples from the four habitats was different for the EcM MOTUs compared to what was observed for all of the fungal MOTUs. While the distribution on axis 1 was similar, with a significantly higher value observed for the lower horizon, (F = 53.86, p < 0.001) as well as a significant horizon * material interaction (F = 7.53, p = 0.0075), the distribution on axis 2 was different. Indeed, the fine roots and soil samples were not significantly different regarding their position on axis 2 (F = 0.78, p = 0.38). Only the horizon factor significantly influenced the position on axis 2 (F = 12.93, p < 0.001).
Discussion
A description of the fungal community at the plot level was achieved using 454 sequencing, which therefore allowed a sampling strategy to be outlined, including the corresponding sequencing effort required for future large-scale community studies where the plot is the basic unit. Remarkably, our work suggested that the soil habitat can be a good proxy for studying mycorrhizal assemblages. Additionally, this study was among the first to investigate oomycetes in forest soils using high-throughput sequencing, although these organisms are relatively difficult to detect compared to fungi. The fungal community observed in the present study showed spatial autocorrelation at a distance of < 15 m and exhibited a differentiated vertical distribution along the soil profile.
To study the microbial community at a plot level, a compromise was required between the number of samples and the sequencing depth per sample (Taylor 2002, Cox et al. 2010). Indeed, as the number of sequences or samples increased, the number of MOTUs increased, with a similar proportion of singletons being recorded. In our case, the number of sequences was sufficient to describe the fungal community at the plot level and at the tree level, for which the community was described in the four habitats separately (RS, SS, RI, SI). Hence, under our experimental conditions, we suggest that four soil cores (20 cm depth) and approximately 15 trees with a sequencing depth of 10 500 sequences per tree unit allowed a good description of the fungal community within our relatively homogeneous 3 500 m2 plot to be obtained. The large number of basidiomycetes observed may represent a bias due to the use of the ITS1F primer (Bellemain et al. 2010).
Our work suggested that the soil habitat was a good proxy for studying mycorrhizal assemblages. Our description of the EcM assemblage was based only on the taxonomically assigned MOTUs and the still incomplete literature addressing the ecological mode of fungi. Despite this limitation, our findings are in accordance with previous studies (Rosling et al. 2003; Landeweert et al. 2005). In particular, the EcM richness was not dependent on the type of material (fine roots or soil), and the CoA of EcM MOTUs was not able to separate the samples. Moreover, most of the MOTUs that were absent from the soil samples were supported by a low number of sequences (less than 120 / MOTU), and only 11% (21 / 192) were EcM MOTUs. Thus, the MOTUs that were not detected in the soil were not found at a high abundance in the fine roots. High-throughput sequencing appears to smooth out the niche differentiation between fine roots and soil, as we could detect almost all of the MOTUs found in the fine root samples in the soil samples as well. Nevertheless, this method allowed us to investigate the fungal community present on the fine roots more thoroughly and to detect rare MOTUs associated exclusively with fine roots. However, Dickie et al. (2002) thought it unlikely that the hyphae of a fungal species present on root tips in a sample could be totally from the surrounding soil. Additionally, Landeweert et al. (2005) did not detect any fungal species that were present on root tips but absent from soil. Some EcM species appear to be more frequent as mycelia in the soil than as mycorrhizal root tips (Kjøller et al. 2006), which was the case for many Tomentella species. In the present study, we indeed found that some EcM MOTUs were detected exclusively in the soil. However, this was not the case for Tomentella: T. sublilacina and
Pseudotomentella tristis were more frequent and more abundant in the fine root samples compared to the soil
samples. Other Tomentella MOTUs were similarly frequent in the fine root and soil samples, with a higher number of sequences in the fine root samples. Boletus spp. were also found as frequently in the soil as in the fine root samples, although this genus has been reported to be more frequent as mycelia in soil than as mycorrhizas (Kjøller et al. 2006). The findings reported in the literature are more conflicting for the Cortinarius. While Kjøller et al. (2006) retrieved some species from root tips, but not from the soil, Genney et al. (2006) detected extramatrical mycelia of Cortinarius more frequently compared to their presence at root tips. Our data confirmed these conflicting reports, as among the 39 Cortinarius MOTUs observed, nine were recorded exclusively from soil, while six were observed exclusively in the fine root samples. Cortinarius is probably the
largest agaricoid genus (Smith, 1973), and it is therefore not surprising that species with large differences in ecology can be found in this group.
As is commonly observed, rare MOTUs dominated the community, apart from a few abundant MOTUs. Among the most abundant EcM MOTUs, a number are generalists (C. geophilum, B. pruinatus), are species associated with acidoclines (e.g., R. ochroleuca, B. erythropus) or are preferentially present in deciduous forests (R. ionochlora under Fagus especially, R. nigricans, R. vesca). Other, less abundant, species were also recorded that are preferentially associated with beech trees (e.g., L. subdulcis, R. fellea, A. citrina, R. mairei) (Courtecuisse & Duhem, 1994). Additionally, the presence of young individuals of several other tree species on the plot could explain the detection of L. quietus, an oak-specific fungus, and Russula puellaris, which preferentially exists in interactions with coniferous species. Additionally, Oidiodendron sp., which was the most abundant MOTU found only in the fine root samples, forms ericoid mycorrhizas with Vaccinium species (Dalpé 1986), which were identified in our forest site.
To our knowledge, this study is the first to investigate oomycetes in forest soils using high-throughput sequencing. We detected only a few MOTUs of Pythiaceae species compared to those that are potentially present in beech forests, which include Phytophthora cactorum, P. cambivora, P. gonapodyides, P. inflata,
Pythium sylvaticum, P. acrogynum, P. inflatum and P. anandrum(Nechwatal & Osswald 2001; Jung et al. 2005; Brasier & Jung, 2006; Vettraino et al. 2008; Brasier 2009). However, Brasier (2009) estimated the number of potential Phytophthora species to be between 200 and 600, and 301 species of Pythium have been listed in the Index Fungorum to date. Compared to the 100 000 fungal species that have been described thus far (Hibbett et
al. 2011), the proportion of four Pythiaceae MOTUs for 2000 putative fungal MOTUs was therefore somewhat
expected. However, the Pythiaceae community is relatively difficult to detect (Scibetta et al. 2012) compared to fungi in general. Technical considerations could explain the small number of Pythiaceae detected. The specific primer sets used for nested PCR amplification (Cooke et al. 2000) were not as appropriate for environmental samples as for pure cultures. Indeed, a majority of the Dikarya were identified along with oomycetes within large (Achlya, Phytophthora, Saprolegnia, Pythium) and other unassigned MOTUs. New primers were recently reported for the detection of Phytophthora from soil and water samples that could improve the detection of these species in environmental samples (Scibetta et al. 2012). Furthermore, as for other fungi, we were not able to assign all of the MOTUs to the species level. Additionally, the sequences from Phytophthora clade 7a (approximately 230 bp) corresponded to P. alni subsp. uniformis, P. fragariae or P. cambivora reference sequences at a 97% identity and 100% coverage, and the sequences from Phytophthora plurivora (approximately 186 bp) also partially matched those of P. inflata. As few Pythiaceae species have been characterised thus far (Kroon et al. 2012) compared to EcM fungi, taxonomic affiliation remains a serious constraint in studying the Pythiaceae community. Improvements in technical and taxonomic methods for studying the Pythiaceae community are therefore clearly needed. From an ecological point of view, Phytophthora and Pythium have not been found to be widespread at a stand scale (Davison & Tay 2005). The trees in our study site were very healthy, showing no symptoms of decline, such as crown transparency or small or yellowish foliage, suggesting that they were not infested by pathogenic Phytophthora species. The plot conditions were moderately favourable for the presence of Phytophthora and Pythium. Fine and coarse sand represented more than 60% of the soil in the lower layer, and the soil pH range was between 4.0 and 4.3. Phytophthora have been found to be less frequent in acidic or sandy soils (Jung et al. 2000; Gomez-Aparicio et al. 2012). Furthermore, the date of sampling (beginning of December) was probably not the time when the highest load of Pythiaceae occurs in the soil habitat. However, the use of molecular techniques might have partly overcome this problem, as hard life stages and DNA may persist in the soil after the active season, as for fungi.
This study is among the few investigations to explore the spatial distributions of EcM species (Courty et
al. 2008) and Pythiaceae species (Davidson & Tay 2005; Gomez-Aparicio et al. 2012) in temperate forests. No
spatial structure could be found for Pythiaceae. The fungal community in our study was spatially autocorrelated at a distance of < 15 m., and autocorrelation has also been reported elsewhere (Lilleskov et al. 2004; Toljander
et al. 2006). Toljander et al. (2006) found that the EcM community structure varied along a nutrient gradient
characterised based on NH4, base saturation, C:N ratio and pH data, although they could not identify the relative importance of these factors. In the present study, the fungal and EcM communities were structured by the C:N ratio and phosphorus, but not by the pH, which was more homogeneous within the plot.
The vertical distribution of mycorrhizas has been reported in several studies in podzolic mixed and coniferous boreal forests (Tedersoo et al. 2003; Rosling et al. 2003; Lindahl et al. 2007), but it has also been explored rarely in temperate deciduous forests (Courty et al. 2008). At the plot level, the vertical abundance distribution was conserved, regardless of the examined material (fine roots or soil). In the present study, the dry fine root biomass, pH, C:N ratio and P were found to be confounding factors that varied with depth and that could be linked to the composition of the fungal community along the vertical profile. The higher fine root biomass observed in the upper organic horizon is in accordance with previous studies (Rosling et al. 2003; Bakker et al.
Tedersoo et al. (2003), who advocated sampling the mineral horizon in addition to the organic horizon. Similar to most previous reports, Cenococcum geophilum was abundant and ubiquitous in the two horizons investigated. Some groups were, however, more abundant in one of the two layers. Indeed, the Cantharellales, such as
Clavulina cristata, Hydnum rufescens, Craterellus tubaeformis and Botryobasidium subcoronatum, were more
abundant in the first 10 cm, where they could play a role in organic matter processing. Likewise, the Atheliaceae
Piloderma fallax, Byssocorticium atrovirens, B. sp1 and Tylospora asterophora, which were more abundant in
the upper layer, have previously been recorded in an organic substratum (Tedersoo et al. 2003). Tomentella
sublilacina was also mostly found in the organic layer (Courty et al. 2008), along with the several MOTUs
assigned to the Cladophialophora. Two Helotiales, Botrytis sp1 and Cudoniella sp1, were also recorded in this upper layer, which is not consistent with the previous observation of the presence of Cudoniella in deeper soil (Jumpponen et al. 2010), but both fungi have been reported to show a preference for wet conditions. In contrast to the above species, Armillaria sp1, Leotia lubrica, L. atrovirens and Microglossum sp1 were confined to the lower horizon.
CONCLUSION
Our results showed that in an apparently homogeneous plot comprising 20 beech trees, the fungal and EcM communities exhibited a spatial variability linked to the examined edaphic parameters. Consequently, a sufficient sampling effort at a local scale should be applied to fully capture the fungal diversity present. In our temperate beech forest plot, we estimated that approximately 15 trees should be sufficient for this purpose. However, the laboratory work could be facilitated by employing bulk soil as a good, easy-to-handle substitute for the fine roots to study EcM assemblages using the pyrosequencing technique, although the relative abundance was not similar. The fungal and EcM communities also exhibited a vertical soil distribution, which could be explained by differences in soil parameters between the lower and upper horizons. Sampling several soil horizons is, therefore, encouraged for analyses of diversity, although it could be difficult for studies conducted at a large geographical scale, which encompass samples from several soil types with structurally different profiles. Care should be taken in extrapolating these findings to other situations (especially in different forest types or under different host trees), as only one plot was studied in the present work, and additional studies are required to confirm our findings.
ACKNOWLEDGEMENTS
A.C’s scholarship was funded by grants from Biodiversity and Climate Change: A Risk Analysis (BACCARA) European Research Project and from the Region Lorraine. We thank the Office National des Forêts for permitting sampling in the Lignéville forest. The authors are grateful to M. Morelet and J. Garbaye for helping with the identification of fungal lifestyles and J. Aguayo, C. Husson, J.-P. Maurice, and F. Le Tacon for elements of the Discussion. The authors also thank F. Martin for access to the UMR1136 IAM computing resources and two anonymous reviewers for their constructive comments, which helped to improve the manuscript.
REFERENCES
Agerer R, 2001. Exploration types of ectomycorrhizae: A proposal to classify ectomycorrhizal mycelial systems according to their patterns of differentiation and putative ecological importance. Mycorrhiza 11:107–114.
Altschul SF, Gish W, Miller W, Myers EW, Lipman DJ, 1990. Basic local alignment search tool. Journal of Molecular Biology 215: 403-410.
Amend AS, Seifert KA, Bruns TD, 2010. Quantifying microbial communities with 454 pyrosequencing: does read abundance count? Molecular Ecology 19: 5555-5565.
Arcate JM, Karp MA, Nelson EB, 2006. Diversity of Peronosporomycete (Oomycete) communities associated with the rhizosphere of different plant species. Microbial Ecology 51: 36-50.
Balci Y, Balci S, Eggers J, MacDonald WL, Juzwik J, Long RP, Gottschalk KW, 2007. Phytophthora spp. Associated with Forest Soils in Eastern and North-Central U.S. Oak Ecosystems. Plant Disease 91:705-710.
Bakker MR, Turpault M-P, Huet S, Nys C, 2008. Root distribution of Fagus sylvatica in a chronosequence in western France. Journal of Forest Research 13: 176-184.
Bellemain E, Carlsen T, Brochmann C, Coissac E, Taberlet P, Kauserud H, 2010. ITS as an environmental DNA barcode for fungi: an in silico approach reveals potential PCR biases. BMC Microbiology 10:189.
Brasier CM, Jung T, 2006. Recent developments in Phytophthora diseases of trees and natural ecosystems in Europe. In Brasier CM, Jung T, Oßwald W (Eds), Progress in Research on Phytophthora Diseases of Forest Trees. Proceedings of the 3rd International
IUFRO Working Party 7.02.09 Meeting, Freising, Germany 11th –17th September 2004. Forest Research, Farnham UK, pp. 5-16.
Brasier CM, 2009. Phytophthora biodiversity: how many Phytophthora species are there? In: Goheen EM, Frankel SJ (tech. coords.), Phytophthoras in forests and natural ecosystems. Proceedings of the fourth meeting of the International Union of Forest Research Organizations (IUFRO) Working Party S07.02.09. General Technical Report PSW-GTR-221. Albany, CA: U.S. Department of Agriculture, Forest Service, Pacific Southwest Research Station, pp. 101-115.
Buée M, Reich M, Murat C, Morin E, Nilsson R H, Uroz S, Martin F, 2009. 454 Pyrosequencing analyses of forest soils reveal an unexpectedly high fungal diversity. New Phytologist 184: 449-456.
Buée M, Maurice J-P, Zeller B, Andrianarisoa S, Ranger J, Courtecuisse R, Marcais B, Le Tacon F, 2011. Influence of tree species on richness and diversity of epigeous fungal communities in a French temperate forest stand. Fungal Ecology 4: 22-31.
Cooke DEL, Drenth A, Duncan JM, Wagels G, Brasier CM, 2000. A molecular phylogeny of Phytophthora and related Oomycetes. Fungal Genetic Biolology 30: 17-32.
Cooke DEL, Schena L and Cacciola SO, 2007. Tools to detect, identify and monitor Phytophthora species in natural ecosystems. Journal of Plant Pathology 89: 13-28.
Courtecuisse R, Duhem B, 1994. Guide des champignons de France et d'Europe. Ed. Delachaux & Niestlé.
Courty P-E, Buée M, Diedhiou AG, Frey-Klett P, Le Tacon F, Rineau F, Turpault M-P, Uroz S, Garbaye J, 2010. The role of ectomycorrhizal communities in forest ecosystem processes: New perspectives and emerging concepts. Soil Biology & Biochemistry 42: 679-698.
Courty PE, Franc A, Pierrat JC, Garbaye J, 2008. Temporal changes in the ectomycorrhizal community in two soil horizons of a temperate oak forest. Applied and Environmental Microbiology 74: 5792-5801.
Cox F, Barsoum N, Bidartondo MI, Borja I, Lilleskov E, Nilsson LO, Rautio P, Tubbu K, Vesterdal L, 2010. A leap forward in geographic scale for forest ectomycorrhizal fungi. Annals of Forest Science 67: 200.
Dalpé Y, 1986. Axenic synthesis of ericoid mycorrhiza in Vaccinium angustifolium Ait. By Oidiodendron species. New Phytologist
103: 391-396.
Davison EM, Tay FCS, 2005. How many soil samples are needed to show that Phytophthora is absent from sites in the South-west of Western Australia? Australasian Plant Pathology 34: 293-297.
Dickie IA, Xu B, Koide RT, 2002. Vertical niche differentiation of ectomycorrhizal hyphae in soil as shown by T-RFLP analysis. New Phytologist 156: 527–535.
Dray S, Dufour AB, 2007. The ade4 package: implementing the duality diagram for ecologists. Journal of Statistical Software 22 : 1-20.
Duchaufour P, Bonneau M, 1959. Une nouvelle méthode de dosage du phosphore assimilable dans les sols forestiers. Bulletin de l’AFES
41:193-198.
Edgar RC, 2010. Search and clustering orders of magnitude faster than BLAST. Bioinformatics 26:2460-2461. Erwin DC, Ribeiro OK, 1996. Phytophthora diseases worldwide. APS Press, St Paul (Minnesota) pp. 562.
Fichtner EJ, Lynch SC, Rizzo DM, 2007. Detection, Distribution, Sporulation, and Survival of Phytophthora ramorum in a California Redwood-Tanoak Forest Soil. Ecology and Epidemiology. 97: 1366-1375.
Gardes M, Bruns TD, 1993. ITS primers with enhanced specificity for basidiomycetes - application to the identification of mycorrhizae and rusts. Molecular Ecology 2: 113-118.
Genney DR, Anderson IC, Alexander IJ, 2006. Fine-scale distribution of pine ectomycorrhizas and their extramatrical mycelium. New Phytologist 170: 381-390.
Gomez-Aparicio L, Ibanez B, Serrano MS, De Vita P, Avila JM, Perez-Ramos IM, Garcia LV, Sanchez ME, Maranon T, 2012. Spatial patterns of soil pathogens in declining Mediterranean forests: implications for tree species regeneration. New Phytologist 194: 1014-1024.
Green JL , Holmes AJ, Westoby M, Oliver I, Briscoe D, Dangerfield M, Gillings M, Beattie AJ, 2004. Spatial scaling of microbial eukaryote diversity. Nature 432: 747-750.
Green J, Bohannan BJM, 2006. Spatial scaling of microbial biodiversity. TRENDS in Ecology and Evolution 21: 501-507. Hansen E, Delatour D, 1999. Phytophthora species in oak forests of north-east France. Annals of Forest Science 56: 539-547.
Hibbett DS, Ohman A, Glotzer D, Nuhn M, Kirk PM, Nilsson RH, 2011. Progress in molecular and morphological taxon discovery in Fungi and options for formal classification of environmental sequences. Fungal Biology Reviews 25: 38-47.
Jansen AE, de Nie HW, 1988. Relations between mycorrhizas and fruitbodies of mycorrhizal fungi in Douglas fir plantations in the Netherlands. Acta botanica Neerlandica 37: 243-249.
Jumpponen A, Jones KL, Blair J, 2010. Vertical distribution of fungal communities in tallgrass prairie soil. Mycologia 102: 1027-1041. Jung T, Blaschke H, Oßwald W, 2000. Involvement of soilborne Phytophthora species in Central European oak decline and the effect
of site factors on the disease. Plant Pathology 49: 706-718
Jung T, Hudler GW, Jensen-Tracy SL, Griffiths HM, Fleischmann F, Oßwald W, 2005. Involvement of Phytophthora species in the decline of European beech in Europe and the USA. Mycologist 19: 159-166.
Kauserud H, Kumar S, Brysting AK, Nordén J, Carlsen T, 2012. High consistency between replicate 454 pyrosequencing analyses of ectomycorrhizal plant root samples. Mycorrhiza 22: 309-315.
Kroon LPNM, Brouwer H, de Cock AWAM, Govers F, 2012. The genus Phytophthora anno 2012. Phytopathology 102: 348-364. Landeweert R, Leeflang P, Smit E, Kuyper TW, 2005. Diversity of an ectomycorrhizal fungal community studied by a root tip and total
soil DNA approach. Mycorrhiza 15:1-6.
Lilleskov EA, Bruns TD, Horton TR, Taylor DL, Grogan P, 2004. Detection of forest stand-level spatial structure in ectomycorrhizal fungal communities. FEMS Microbiology Ecology 49: 319-332.
Lindahl BD, Ihrmark K, Boberg J, Trumbore SE, Högberg P, Stenlid J, Finlay RD, 2007. Spatial separation of litter decomposition and mycorrhizal nitrogen uptake in a boreal forest. New Phytologist 173: 611-620.
Margulies M, Egholm M, Altman WE, et al. 2005. Genome sequencing in microfabricated high-density picolitre reactors. Nature 437: 376-380.
Nechwatal J, Osswasld W, 2001. Comparative studies on the fine root status of healthy and declining spruce and beech trees in the Bavarian Alps and occurrence of Phytophthora and Pythium species. Forest Pathology 31, 257-273.
Nilsson RH, Veldre V, Hartmann M, Unterseher M, Amend A, Bergsten J, Kristiansson E, Ryberg M, Jumpponen A, Abarenkov K, 2010. An open source software package for automated extraction of ITS1 and ITS2 from fungal ITS sequences for use in high-throughput community assays and molecular ecology. Fungal Ecology 3: 284-287.
O’Brien HE, Parrent JL, Jackson JA, Moncalvo J-M, Vilgalys R, 2005. Fungal community analysis by large-scale sequencing of environmental samples. Applied and Environmental Microbiology 71: 5544-5550.
Oksanen J, Blanchet FG, Kindt R, Legendre P, Minchin PR, O'Hara RB, Simpson GL, Solymos P, Stevens MHH, Wagner H, 2011. vegan: Community Ecology Package. R package version 2.0-2. http://CRAN.R-project.org/package=vegan
Öpik M, Metsis M, Daniell TJ, Zobel M, Moora M, 2009. Large-scale parallel 454 sequencing reveals host ecological group specificity of arbuscular mycorrhizal fungi in a boreonemoral forest. New Phytologist 184: 424-437.
Peter M, Ayer F, Egli S, 2001. Nitrogen addition in a Norway spuce stand altered macromycetes sporocarp production and below-ground ectomycorrhizal species composition. New Phytologist 149: 311-325.
Pickles BJ, Genney DR, Potts JM, Lennon JJ, Anderson IC, Alexander IJ, 2010. Spatial and temporal ecology of Scots pine ectomycorrhizas. New Phytologist 186: 755-768.
Quince C, Lanzen A, Curtis TP, Davenport RJ, Hall N, Head IM, Read LF, Sloan WT, 2009. Accurate determination of microbial diversity from 454 pyrosequencing data. Nature Methods 6: 639-641.
R Development Core Team, 2011. R: A language and environment for statistical computing. R Foundation for Statistical Computing, Vienna, Austria. ISBN 3-900051-07-0, R version 2.13.1 (2011-07-08) http://www.R-project.org/.
Rinaldi AC, Comadini O, Kuyper TW, 2008. Ectomycorrhizal fungal diversity: separating the wheat from the chaff. Fungal Diversity
33:1–45.
Rousk J, Bååth E, Brookes PC, Lauber CL, Lozupone C, Caporaso JG, Knight R, Fierer N, 2010. Soil bacterial and fungal communities across a pH gradient in an arable soil. The ISME Journal 4: 1340-1351.
Rosling A, Landeweert R, Lindahl BD, Larsson KH, Kuyper TW, Taylor AFS, Finlay RD, 2003. Vertical distribution of ectomycorrhizal fungal taxa in a podzol soil profile. New Phytologist 159: 775-783.
Schoch CL, Seifert KA, Huhndorf S, Robert V, Spougea JL, Levesque AC, Chenb W, Fungal Barcoding Consortium, 2012. Nuclear ribosomal internal transcribed spacer (ITS) region as a universal DNA barcode marker for Fungi. Proceedings of the National Academy of Sciences 109: 6241-6246.
Scibetta S, Schena L, Chimento A, Cacciola SO, Cooke DEL, 2012. A molecular method to assess Phytophthora diversity in environmental samples Journal of Microbiological Methods 88: 356-368.
Schloss P. D., Westcott SL, Ryabin T, Hall JR, Hartmann M, Hollister EB, Lesniewski RA, Oakley BB, Parks DH, Robinson CJ, Sahl JW, Stres B,Thallinger GG, Van Horn DJ, Weber CF, 2009. Introducing mothur: open-source, platform-independent, community-supported software for describing and comparing microbial communities. Applied Environmental Microbiology 75: 7537-7541.
Smith AH, 1973. Agaricales and related secotioid gasteromycetes. In: Ainsworth GC, Sparrow FK, Sussman AS (Eds.), The fungi – An advanced treatise. Volume 4B. Academic Press, San Francisco, California.
Smith SE, Read DJ, 2008. Mycorrhizal Symbiosis, third ed. Academic Press,London p. .
Taylor AFS, 2002. Fungal diversity in ectomycorrhizal communities: sampling effort and species detection. Plant and Soil 244:19-28. Tedersoo L, Koljalg U, Hallenberg N, Larsson KH, 2003. Fine scale distribution of ectomycorrhizal fungi and roots across substrate
layers including coarse woody debris in a mixed forest. New Phytologist, 159: 153 - 165.
Tedersoo L, May TW, Smith ME, 2010. Ectomycorrhizal lifestyle in fungi: global diversity, distribution, and evolution of phylogenetic lineages. Mycorrhiza 20: 217-263.
Tedersoo L, Bahram M, Jairus T, Bechem E, Chinoya S, Mpumba R, Leal M, Randrianjohany E, Razafimandimbison S, Sadam A, Naadel T, Kõljalg U, 2011. Spatial structure and the effects of host and soil environments on communities of ectomycorrhizal fungi in wooded savannas and rain forests of Continental Africa and Madagascar. Molecular Ecology, 20: 3071-3080.
Toljander JF, Eberhardt U, Toljander YK, Paul LR, Taylor AFS, 2006. Species composition of an ectomycorrhizal fungal community along a local nutrient gradient in a boreal forest. New Phytologist 170: 873-884.
Unterseher M, Jumpponen A, Opik M, Tedersoo L, Moora M, Dormann CF, Schnittler M. 2011. Species abundance distributions and richness estimations in fungal metagenomics – lessons learned from community ecology. Molecular Ecology 20: 275–285. Uroz S, Buée M, Murat C, Frey-Klett P, Martin F, 2010. Pyrosequencing reveals a contrasted bacterial diversity between oak rhizosphere
Van Der Linde S, Alexander IJ, Anderson IC, 2009. Spatial distribution of sporocarps of stipitate hydnoid fungi and their belowground mycelium. FEMS Microbiology Ecology. 69: 344-352.
Vettraino A, M, Jung T, Vannini A, 2008. First Report of Phytophthora cactorum associated with beech decline in Italy. Plant Disease
92: 1708.
Wallander H, Johansson U, Sterkenburg E, Durling MB, Lindahl B, 2010. Production of ectomycorrhizal mycelium peaks during canopy closure in Norway spruce. New Phytologist 187: 1124-1134.
Whitcomb S, Stutz JC, 2007. Assessing diversity of arbuscular mycorrhizal fungi in a local community: role of sampling effort and spatial heterogeneity. Mycorrhiza 17: 429-437.
White TJ, Bruns T, Lee S, Taylor J, 1990. Amplification and direct sequencing of fungal ribosomal RNA genes for phylogenetics. In: Innis MA, Gelfand DH, Sninsky JJ, White TJ (Eds.), PCR Protocols: A Guide to Methods and Applications, Academic Press, San Diego, CA, pp. 315–322.