HAL Id: cea-01577760
https://hal-cea.archives-ouvertes.fr/cea-01577760v2
Submitted on 13 Sep 2019
HAL is a multi-disciplinary open access
archive for the deposit and dissemination of
sci-entific research documents, whether they are
pub-lished or not. The documents may come from
teaching and research institutions in France or
abroad, or from public or private research centers.
L’archive ouverte pluridisciplinaire HAL, est
destinée au dépôt et à la diffusion de documents
scientifiques de niveau recherche, publiés ou non,
émanant des établissements d’enseignement et de
recherche français ou étrangers, des laboratoires
publics ou privés.
products from γ-irradiated polyvinylchloride: influence
on Eu(OH)_3(s) solubility and Eu(III) speciation in
neutral to alkaline environment
Pascal E. Reiller, Elodie Fromentin, Muriel Ferry, Adeline Dannoux-Papin,
Hawa Badji, Michel Tabarant, Thomas Vercouter
To cite this version:
Pascal E. Reiller, Elodie Fromentin, Muriel Ferry, Adeline Dannoux-Papin, Hawa Badji, et al..
Com-plexing power of hydro-soluble degradation products from γ-irradiated polyvinylchloride: influence on
Eu(OH)_3(s) solubility and Eu(III) speciation in neutral to alkaline environment. Radiochimica Acta,
R Oldenbourg Verlag GMBH, 2017, 105 (8), pp.665-675. �10.1515/ract-2016-2691�. �cea-01577760v2�
Pascal E. Reiller*, Elodie Fromentin, Muriel Ferry, Adeline Dannoux-Papin, Hawa Badji,
Michel Tabarant and Thomas Vercouter
Complexing power of hydro-soluble degradation
products from γ-irradiated polyvinylchloride:
influence on Eu(OH)
3
(s) solubility and Eu(III)
speciation in neutral to alkaline environment
DOI 10.1515/ract-2016-2691
Received September 1, 2016; accepted January 27, 2017; published online March 22, 2017
Abstract: The complexing power of hydrosoluble
degrada-tion products (HDPs) from an alkaline hydrolysis of a 10 MGy γ-irradiated polyvinylchloride is studied. The compl-exation of Eu(III), as an analogue of lanthanide and acti-nide radionuclides at their + III oxidation state for oxygen containing functions, is evidenced both from the increas-ing of Eu(OH)3(s) dissolution, and from a complexometric titration by time-resolved luminescence spectroscopy. The dissolution of Eu(OH)3(s) in a simplified alkaline solution (0.3 M KOH/0.1 M NaOH) increases moderately, but signifi-cantly, with the HDPs concentration. The luminescence signal of the supernatant clearly indicates the presence of several complexed Eu(III) species. Performing a complexo-metric titration of Eu(III) from pH 6 by alkaline HDPs shows the formation of two different species with increasing HDPs’ concentration and pH. Operational complexation constants – based on dissolved carbon concentration – are proposed. The analyses of the spectra and luminescence decays seem to confirm the presence of two different species.
Keywords: Europium, lanthanides, actinides, irradiated
polymers, hydrosoluble degradation products, cementi-tious nuclear wastes.
1 Introduction
Polymers are widely used in the nuclear industry: gloves or windows of glove-boxes, bottles, O-rings. During their use, these materials are in contact with radionuclides and suffer from radiolytic degradation. At the end of their service life, they are to be stored in intermediate-level long-lived waste (ILLW) packages in nuclear waste geological repositories, depending on national strate-gies. These packages are often cemented. Within the French concept, the ILLW packages would be stored in a deep underground clayey geological repository with cement backfill. During storage, the polymers will suffer from degradation by two phenomena: radio-oxidation and alkaline hydrolysis. Polymers are degraded by radio-oxidation, because of the presence of radionuclides (radiolytic degradation) and dioxygen (oxidation) into the waste packages. After repository closure, water will penetrate the repository and it will reach the packages’ cores. This event is depending on the water permeabil-ity of the host rock. As the design of the repository and the waste packaging include an important amount of concrete, the water will become alkaline (around pH 13) when reaching the waste packages’ cores [1].
Because of radio-oxidation and alkaline hydroly-sis, organic hydro-soluble degradation products (HDPs) could be released in water. As an example, after γ irradia-tion of a plasticized poly(vinyl chloride) (PVC) under air up to 26 MGy, the identified HDPs obtained in alkaline water are largely additives, or degradation products from additives, such as phthalate ions, di-n-butyl phthalate, 2-ethylhexyl diphenyl phosphate and phenol [2]. In the same way, the HDPs from a radio-oxidized poly(ether urethane) were formed of alcohols, carboxylic acids and primary amines, as well as polyether oligomers with dif-ferent end groups (aldehyde, alcohol or double bond) [3]. It turned out that the more radio-oxidized the polymer, the higher the oxidation rate of HDPs and the lower their molar mass. When the absorbed dose tends to be very
*Corresponding author: Dr. Pascal E. Reiller, PhD, Den – Service
d’Etudes Analytiques et de Réactivité des Surfaces (SEARS), CEA, Université Paris-Saclay, F-91191 Gif-sur-Yvette CEDEX, France, E-mail: pascal.reiller@cea.fr
Elodie Fromentin and Muriel Ferry: Den – Service d’Etudes du
Comportement des Radionucléides (SECR), CEA, Université Paris-Saclay, F-91191 Gif-sur-Yvette CEDEX, France
Adeline Dannoux-Papin: Den – Service des Procédés de
Décontamination et d’Enrobage (SPDE), CEA, F-30207 Bagnols-sur-Cèze, France
Hawa Badji, Michel Tabarant and Thomas Vercouter: Den – Service
d’Etudes Analytiques et de Réactivité des Surfaces (SEARS), CEA, Université Paris-Saclay, F-91191 Gif-sur-Yvette CEDEX, France
high, the expected HDPs for such a polymer should be low molar mass carboxylic acids, aldehydes and formic acid ester [4]. A very recent work succeeded in charac-terizing HDPs released from an industrial radio-oxidized poly(ester urethane) [5] hydrolysed in water. Short-organic acids such as acetic, formic, oxalic, malonic, glutaric, succinic, and adipic acids were identified and quantified. Other molecules were identified such as esters, alcohols, diols, ketones and polyester oligomers, confirming previous results [3].
From the very scarce literature on this topic, it is worth noting that HDPs nature and concentration depend on the studied polymer, its nature and addi-tives. In addition, each study mentions that an appreci-able amount of the pool of organic substances was not identified. Thus, there is a strong need to identify HDPs from the different polymers that could be present in the nuclear wastes.
Among these organic pools, the possibility to generate complexing entities is susceptible to lead to modification of radionuclides solubility in cementitious environment. A striking example is the formation of isosaccharinic acid during cellulose alkaline hydrolysis [6–8]. Another is the radiolytic degradation of ion exchange resins, producing short-chained organic molecules and an unknown pool of ligand [9–11]. Nevertheless, from the known complexation properties of short-chained organic molecules [12–15], it is most unlikely that an influence on the solubility of actinides may occur under cementitious conditions. The adsorption properties of these short-chained molecules are also relatively weak in cement [16]. Only carbohy-drates, e.g. α-isosaccharinic acid, or polyaminocarboxy-lates, e.g. EDTA, could have an influence on actinides solubility in alkaline media [7, 15, 17, 18]. Phthalic acid, which is also known to form complexes in mildly acidic medium [19, 20], seems to form a mixed hydroxo complex with Eu(III), but the solid formed seems to be less soluble than Eu(OH)3(s) [21].
Our aim is to investigate the global behaviour of an alkaline solution of HDPs obtained from a radio-oxidized PVC – under γ irradiation afterward cited as γ-PVC-HDP. As a preliminary step, it is chosen to analyse HDPs’ inter-actions with europium(III), as a chemical analogue of trivalent lanthanides and actinides for oxygen contain-ing functions [22]. PVC was irradiated under air at 10 MGy by γ-rays, and hydrolysed in alkaline water. First, the obtained solution was put in contact with Eu(OH)3(s) under alkaline conditions and the solubility was meas-ured by time-resolved luminescence spectroscopy (TRLS) and inductively coupled plasma-optic emission spectroscopy (ICP-OES). Second, a mildly acidic Eu(III)
solution was titrated with the alkaline HDP solution to evidence by TRLS the potential Eu(III) complexation. The luminescence spectra and decays were analysed and discussed, and the global interaction constants were estimated. The implication of this complexing power on Eu(III) solubility in and out of a geological repository is then discussed.
2 Materials and methods
2.1 Chemicals
Additive-free PVC (grade K70) has been supplied in powder form by Plastunion (Bondy, France). Eu(OH)3(s) was syn-thesized by forced hydrolysis, of Eu(NO3)3·6H2O (Aldrich Co) in 10 − 2 M HNO
3. Solid Eu(OH)3 was precipitated with
KOH. The solid was dried at 60 °C for 2 days. The theo-retical solubility of Eu(OH)3(am) was calculated [23] – see thermodynamic data in Table S1 of the Supplementary Information (SI) –, and correction from non-ideality is made using the parameters from Kielland [24]. The limit-ing Eu(CO3)33 − complex [25] (Table S1 of the SI) is added to
the model. As there is possible artefacts in the account of Eu(OH)4 − [23], only the first three hydroxo complexes were
taken into account.
2.2 Preparation of γ-PVC-HDPs
Additive-free PVC was irradiated as received, under the form of films, at room temperature under air in open pill-boxes using γ-rays (60Co source) by IONISOS (Dagneux,
France). A glass crystallizer was placed on the top of each pillbox to prevent dust deposition on the samples, while allowing air to flow inside the container. Dosim-etry was performed using radiochromic (Red Perspex) dosimeters that were changed regularly. No electronic correction was made to account for the electronic density difference between water and additive-free PVC. The irra-diation dose was 10 MGy and the mean dose rate was about 0.54 kGy/h. Uncertainties on given doses were less than 6%. The obtained solid γ-irradiated polymer (γ-PVC) were then used for the complexing power study of the alkaline HDPs.
The study of the complexing power of γ-PVC-HDPs is not straightforward in representative cement-pore waters. The composition of these pore waters is complex [26]. Even if simplified artificial pore waters were proposed [27], they
comprise calcium, which was shown to be a competitor for e.g. Th(IV) complexation by α-isosaccharinic acid [17]. Even if Vercammen et al. [7] did not evidence any effect of Ca2 + on the complexation of Eu(III) by α-isosaccharinic
acid, it was decided to use an even simpler alkaline medium consisting of 0.3 M KOH and 0.1 M NaOH (pH ≈ 13.5) as a first step.
The alkaline extraction of γ-PVC-HDPs was done by contacting a weighed amount of approximately 1 g of solid γ-PVC in 10 g of 0.3 M KOH and 0.1 M NaOH pre-viously degassed solution, under inert atmosphere (Ar) at 60 °C for 2 weeks in order to increase the extraction/ hydrolysis kinetics. The obtained γ-PVC-HDPs solution was analysed in total organic carbon analysis (TOC-metre, Variotoc CUBE, Elementar) using weighed potas-sium hydrogenophthalate solutions as standards. After dilution by weighing, the carbon concentration of the γ-PVC-HDP solution was 21.1 ± 0.1 gC/kgw (211 gC/kgpolymer, 1.76 molC/kgw).
2.3 Dissolution of Eu(OH)
3(s) in the presence
of γ-PVC-HDPs
The pH value was measured using a combined glass elec-trode Inlab micro. The elecelec-trode was calibrated exter-nally with four points, using commercial buffer solutions (pH 4.01, 7.01, and 10.00) plus a portlandite – Ca(OH)2(s) – suspension filtered just before use, which theoretical pH value is 12.7 at 22 °C. The linearity of the electrode response was checked and gave uncertainties better than 0.06 (1σ).
Different organic solutions were used for the solubil-ity experiments. First, simulated solutions of varying total carbon concentration, consisting of four selected organic acids determined in HDPs, were used (Table 1). Phthalic
acid, which is representative of plasticizers in different polymers, was used in additional solutions of varying total organic carbon.
From the known complexation constants of the lan-thanides by these acids [12, 15, 19–21, 28–30], neither complexation of Eu(III) nor solubility enhancement of Eu(OH)3(s) at pH values relevant of cementitious envi-ronment are awaited. The account of other organic mole-cules recently evidenced [5] does not change the situation according to available thermodynamic data [31].
Second, weighed aliquots of 5 mg of Eu(OH)3(s) in 5 mg of the artificial alkaline water were placed in 10 mL centrifuge tubes. The synthetic solutions or γ-PVC-HDPs were added from weighed aliquots of the original solu-tions. After controlling the pH value, the tubes are closed under a flush of Ar. The solubility samples were placed under horizontal agitation for only one week in order to minimize CO2(g) contamination [32]. As the effect of ultra-centrifugation on γ-PVC-HDPs is not known, the separa-tion of phases was done by sedimentasepara-tion. The formasepara-tion of colloidal particles that could have stayed in the suspen-sions cannot be avoided, but is a common bias to every batch of these series.
2.4 Inductively coupled plasma-optic
emission spectroscopy
For some samples the dissolved Eu concentrations in supernatants were quantified by ICP-OES (Perking Elmer Optima 2000 DV Spectrometer). Eu concentrations were determined at 412.970 nm and 381.967 nm using five or six points calibration curves (0–10,000 ppm); the uncer-tainties were better than 5%. Some samples were diluted before analysis to meet the concentration range of the calibration curve.
Table 1: Composition of the different synthetic solutions with total carbon concentration variation.
Sample Concentration (mol/kgw)
S1 S2 S3 S4 S5 S6 S7 Acetic 1.53 10 − 4 5.09 10 − 4 1.53 10 − 3 5.09 10 − 3 1.53.10 − 2 3.06 10 − 2 7.64 10 − 2 Formic 4.13 10 − 4 1.38 10 − 3 4.13 10 − 3 1.38 10 − 2 4.13.10 − 2 8.26 10 − 2 2.07 10 − 1 Oxalic 3.55 10 − 4 1.18 10 − 3 3.55 10 − 3 1.18 10 − 2 3.55.10 − 2 7.09 10 − 2 1.77 10 − 1 Glutaric 7.58 10 − 5 2.53 10 − 4 7.58 10 − 4 2.53 10 − 3 7.58.10 − 3 1.52 10 − 2 3.79 10 − 2 TOC molC/kgw 1.81 10 − 3 6.02 10 − 3 1.81 10 − 2 6.02 10 − 2 1.81 10 − 1 3.83 10 − 1 8.91 10 − 1 Sample P1 P2 P3 P4 P5 P6 Phthalic 1.87 10 − 5 5.14 10 − 5 2.06 10 − 4 5.64 10 − 4 2.25 10 − 3 1.25 10 − 1 TOC molC/kgw 1.50 10 − 4 4.12 10 − 4 1.64 10 − 3 4.52 10 − 3 1.80 10 − 2 9.99 10 − 1
During the preconditioning for the typical ICP-OES analysis in 0.1 M HNO3, sedimentation of the γ-PVC-HDPs were observed – see picture in Figure S1 of the SI. These supernatants were calcined and dissolved in 0.1 M HNO3. Afterwards, it was decided to analyse the supernatants without acidification in ICP-OES by the standard addition method, and to double the analyses in TRLS in 3M K2CO3 [33], a medium which maintains the alkalinity of the solu-tion and enhances the luminescence of Eu(III) through the formation of Eu(CO3)33 − complex.
2.5 Time-resolved luminescence
spectroscopy
The experimental set-up, luminescence spectra acqui-sitions, luminescence decay times fitting, and fitting uncertainties estimations have been described elsewhere [34–36]. A 300 lines/mm grating (Princeton, Evry, France) was used. The luminescence signal was collected during a time gate width (W) of 300 μs, at an initial delay time (D) of 10 μs after the excitation laser pulse. To increase the signal-to-noise ratio, 300–1000 accumulations were performed for each spectrum. All measurements were carried on at room temperature (20 °C). The excitation wavelength was set in the 5L
6 ← 7F0 transition of Eu(III) (λexc = 393.7 nm) [37].
For each obtained spectrum a background correction was performed.
2.5.1 Eu(III) concentration analysis in the supernatants
For the Eu(III) concentration analyses, a weighed 1 mL aliquot was sampled into a 1 cm quartz cuvette, and the necessary amount of solid K2CO3 was weighed and added to the aliquot to provide the 3 M medium. The concentra-tion of Eu was determined using the standard addiconcentra-tion method. The standard was obtained from the dissolution of 99.99% Eu2O3 (Johnson Matthey, Roissy, France) in 3 M K2CO3 – all amounts were weighed. The area under the
5D
0 → 7F2 transition (trapezoid method) was plotted vs. the
added (weighed amounts of typically 10–100 μL) concen-trations of standard.
2.5.2 Eu(III) speciation in the presence of γ-PVC-HDP
Eu(III) spectra with increasing concentration of γ-PVC-HDP were obtained from an initial 10 − 6 M Eu
solu-tion at pH 6 in 0.1 M NaCl. This solusolu-tion was prepared from
a 10 − 3 M stock solution obtained after the dissolution of
99.99% Eu2O3 (Johnson Matthey, Roissy, France) in 3.5 10 − 3
M HCl. Weighed amounts of γ-PVC-HDP were added to a 1.5 mL aliquot of the 10 − 6 M Eu solution. Some solutions
were kept for at least 3 weeks and checked regularly for luminescence signal modification due to eventual precipi-tation of either Eu(OH)3(am) or EuOHCO3(cr).
3 Results and discussion
3.1 Solubility of Eu(OH)
3(s)
Results obtained by ICP-OES and TRLS are shown in Figure 1. As awaited from the already known complexa-tion constants from the “simple” organic molecules – vide
ante –, no significant increase of the Eu(OH)3(s)
solubil-ity is evidenced in 0.3 M KOH/0.1 M NaOH neither for the organic acids nor for phthalic acid. Nevertheless, a signifi-cant increase by one and a half order of magnitude of the Eu(III) concentration in the supernatant is observed for γ-PVC-HDP concentration higher than 1 molC/kgw, either from ICP-OES or TRLS results.
The determination of formation constants seems awkward considering our lack of knowledge of the types
– 8 – 7 – 6 – 5 – 4 – 3 log10([HDP]/molc/kgw) lg (C Eu /mol/kg w ) – 4 – 3 – 2 – 1 0
Figure 1: Dissolution of Eu(OH)3(s) in artificial alkaline solution (KOH 0.3/NaOH 0.1 M) at varying carbon concentration of synthetic solutions and γ-PVC-HDPs, analysed in ICP-OES (circles), and in TRLS (squares): blue symbols are the Eu dissolution with no organ-ics added, orange symbols are for γ-PVC-HDPs, white symbols are for the short-chained mix of acids, empty symbols are for phthalic acid; blue line is the theoretical solubility of Eu(OH)3(am) based on thermodynamic constants [23, 25] and blue zone is the calculated uncertainty on Eu solubility, red dotted line is the operational solu-bility curves considering the formation of Eu(OH)3(HDP) and green dashed line is the operational solubility curves considering the formation of Eu(OH)2(HDP)3, with the red and green zones being the same uncertainty as the blue zone.
of chemical functions that are engaged in complexa-tion reaccomplexa-tions and their amounts. Titracomplexa-tion experiments would be desirable, but were not performed up to now due to the very low amount of γ-PVC-HDPs’ solution available and the amount of products that is usually necessary for e.g. natural organic products [38–40]. It is nevertheless tempting to calculate an operational complexation constant, Kop, relative to the total carbon concentration in solution – omitting the charges of the complex because of our lack of knowledge on γ-PVC-HDP functionality. 3 2 3+ ( ) Eu H O HDP Eu(OH) HDP H E [ (OH) (HDP) [H ] [ ] [HDP u Eu ] n m n n m op m n m n K + + + + + + = (1) Unfortunately, the increase of the solubility is quite limited. Several hypotheses can be proposed combin-ing different values of n and m. First, as the major Eu(III) species at this pH value is Eu(OH)3(aq), one can propose the formation of Eu(OH)3(HDP). The dotted line on Figure 1 is obtained from the above operational equilibrium con-sidering that Eu(OH)3(aq) is major in solution under our conditions yielding Eu(OH)3(HDP), and that 1 mole of carbon from HDP is implied. The increase in Eu(OH)3(s) dissolution is poorly represented with an operational log10Kop = − 23.7 (r² = 0.429).
One can also consider that a lower hydrolysed species is forming a complex. As the increase in solubility seems to follow a slope of + 3, Eu(OH)2(HDP)3, a combination of two moles of H2O for three moles of carbon in HDPs (dotted line), would better represent the evolution in Figure 1, with an operational log10Kop = − 9.9 (r² = 0.743). From the low amount of available data, due to the low amount of available sample and the small increase in Eu(OH)3(s) sol-ubility, it is difficult to firmly discriminate one hypothesis from the other.
3.2 Luminescence of Eu(III) in the presence
of γ-PVC-HDPs
The Eu(III) luminescence spectra of the supernatant of solubility experiments of Eu(OH)3(s), and after 1 or 2 days in contact with γ-PVC-HDPs – before adding K2CO3 – are shown in Figure S2 of the SI. In addition to a remain-ing luminescence due to the γ-PVC-HDPs, the lumines-cence of solubilized Eu(III) can be clearly observed. The 5D
0 → 7F2 transition dominating the spectrum at
λmax approximately 615 nm indicates the formation of a complex.
3.2.1 Complexation of Eu(III) by γ-PVC-HDPs
The evolution of the luminescence of Eu(III) from pH 6 (0.1 M NaCl), by adding γ-PVC-HDPs is shown normalized to the area of the 5D
0 → 7F1 transition in Figure 2a, and
nor-malized to the 560–715 nm span in Figure S3 of the SI. The presence of the 5D
0 → 7F0 transition indicates the presence
560 5D 0 7F1 5D 0 7F0 5D 0 7F3 5D 0 0 molC/kgw 0,274 molc/kgw 7F 4 580 Fno rm (a. u.) 600 620 640 660 Wavelength (nm) 14 12 10 8 6 4 0 – 1 – 2 – 3 – 4 0 1 Hd 2 3 4 5 b a 680 700 log10([HDP]/molc/kgw) A( 5D 0 7F 2 )/A( 5D 0 7F 1 ) 5D 0 7F2
Figure 2: Evolutions with the γ-PVC-HDPs concentration (molC/kgw) of (a) the luminescence spectra of Eu(III) normalized to the area of the 5D
0 → 7F1 transition – from 0 blue thick line to 0.274 molC/ kgw red thick line –, and (b) the 7F
2/7F1 asymmetry ratio (circles) and solution pH (diamonds); [Eu] = 1 μM, D = 10 μs, W = 300 μs, λexc = 393.7 nm, I = 0.1 M NaCl; empty circles represent experiments for which decay time measurements are presented in Figure 4. Error bars represent 2σ of the 7F
2/7F1 asymmetry ratio using the trapezoid method.
of at least one species other than Eu3 +, although it may
be a minor species. The variation of the intensity of the
5D
0 → 7F0 transition in Figure S4 of the SI, issued from
Figure S3 of the SI, suggests that several mechanisms are taking place. First, an increase of the 5D
0 → 7F0 relative
intensity up to 3 10 − 3 mol
C/kgW suggests a loss of
centro-symmetry of the complex. Second, a further decrease of the 5D
0 → 7F0 relative intensity to values lower than the
original one at pH 6 and no carbon added suggests that the final complex is more centro-symmetric.
The complexation of Eu(III) by the γ-PVC-HDPs is also evidenced by the typical change in the area ratio
5D
0 → 7F2/5D0 → 7F1 transitions (Figure 2b), commonly
defined as the 7F
2/7F1 asymmetry ratio. The initial 7F2/7F1
ratio of 0.8 – instead of ca. 0.3 for Eu3 + – further
indi-cates that the initial Eu(III) signal cannot be only attrib-uted to Eu3 + [30, 34, 36]. The increasing asymmetry ratio
and the variation of the 5D
0 → 7F0 transition with the
γ-PVC-HDPs carbon concentration indicate changes in the symmetry of the complex(es). The full width at half height of the 5D
0 → 7F1 transition is gradually increasing,
and the 5D
0 → 7F2 is slightly blue-shifted. The 5D0 → 7F3
and 5D
0 → 7F4 transitions relative intensities are slightly
decreasing and red-shifted (Figure S3 of the SI).
The obtained spectra are clearly different from either Eu(III) hydroxo complexes but also from Eu(CO3)n3 − 2n
complexes [25, 41, 42]. The plot of the asymmetry ratio (Figure 2b) is typically showing the formation of at least one complex with increasing carbon concentration and pH. Speciation diagrams under different conditions are calculated in Figure S5 of the SI [23, 25]. Under our con-ditions, either Eu(OH)3(am) – if no CO2(g) is present in Figure S5a of the SI – or EuOHCO3(cr) – in an open system in Figure S5c of the SI – should precipitate under mildly alkaline conditions. In a closed system – as in spectro-scopic cuvettes, two volumes of air over one volume of water –, EuOHCO3(cr) should precipitate between pH 7 and 10.2, and then Eu(OH)3(am) should be in equilibrium with Eu(OH)3(aq) at higher pH values (Figure S5e of the SI). We did not observe any precipitation nor any change in the Eu(III) luminescence signal over the course of the experiments – the sample with γ-PVC-HDPs of the highest carbon concentration and at pH 11.2 was kept, and the TRLS signal and spectrum checked, for several weeks. The presence of a complex is in agreement with the enhanced Eu(OH)3(s) solubility observed previously at higher pH.
As stressed earlier, the determination of the formation constants can only be global without the knowledge of γ-PVC-HDPs functionality. Following the same reasoning, which has been used in solubility interpretation, and con-sidering the simple equilibrium between non-complexed
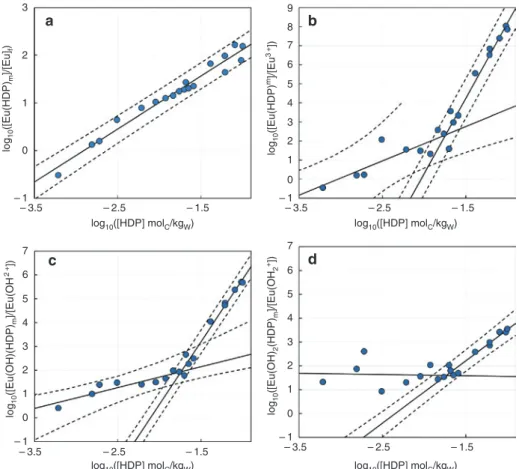
europium (Eunc) and γ-PVC-HDPs, one can write the fol-lowing operational equilibrium with associated opera-tional constant Kop. nc ,Eu nc E [Eu( u HDP Eu HDP) ] [Eu] [H (HDP D ] ) Pm m p m o m K = + (2) The plot of log10([Eu(HDP)m]/[Eu]nc) vs. log10[HDP] in Figure 3a gives a slope close to unity (Table 2) and
log10Kop,Eu = 3.23 ± 0.09 (1σ) at the intercept on the basis of
the carbon concentration of γ-PVC-HDPs.
This operational constant can also be plotted against the free ion Eu3 + concentration considering the hydrolysis
constants of Eu(III) [23, 25].
[ ]
[
3]
n 3 3 n nc 1 (Eu ) [Eu ] [H ] Eu Eu + + + + = + ∗β = α ∑
(3)The plot of log10([Eu(HDP)m/[Eu3 +]) vs. log
10[HDP] in
Figure 3b gives two straight lines: the first is showing a slope close to 2 (Table 2) with log10Kop,1,Eu3+ =5.5±1.1 1( )σ,
and the second slope is close to 8 with
3
10 ,2,Eu ( )
log Kop +=16.1 0 8 ± . 1σ. It is worth to notice that the uncertainty on the first straight line parameters is rather high, and that the high carbon concentration part is giving a high number of carbon implied in complexation.
The slope analyses can also be done considering the other hydroxo complexes. The calculation of the Ring-böm’s coefficients for the different hydroxo complexes – α(EuOH2 +), α(Eu(OH)
2 +), and α(Eu(OH)3(aq)) – are
recalled in the SI and the equivalent plots of equation (3) for each hydroxo complex is shown in Figure S6 of the SI. The slopes, log10Kop, and determination coefficient (r²) are reported in Table 2. First, it can be noted that all the plots of log10([Eu(HDP)n/[Eu(OH)n(3 − n) +]) vs. log
10[HDP] in Figure
S6 of the SI are showing a change in slopes at log10[HDP] approximately − 1.7, i.e. 0.02 molC/kgw, for every situation. This indicates that two species are likely to occur during the complexometric titration. Accounting for α(Eu(OH)3(aq)) is leading to non-sense negative slope in the first part of the isotherm and to a slope of 0 in the second part, which suggests that this species is not likely in interaction with HDPs. The interaction with Eu(OH)2 + is also unlikely in the
first part of the isotherm as a slope of 0 is obtained; a slope of 2.6 is obtained in the second part of the isotherm. The use of α(Eu(OH)2 +) (Figure 3c) is showing two slopes, the
first one being close to unity, and the second close to 5, with r² being slightly higher than for α(Eu3 +).
It is also possible to express these constants related to Eu3 +, using thermodynamic hydrolysis constants corrected
to 0.1 M NaCl [23, 24]. Interestingly, the value obtained rel-ative to the complexation of Eu(OH)2 + in the second part of
the isotherm is in very good agreement with the possible constant obtained in dissolution experiment using the for-mation of Eu(OH)2(HDP)3 on carbon concentration basis. One must here remind that these stoichiometries are based on the quantities of carbon involved in the complexation reaction. They do not give directly the stoichiometry of the functions implied in the complexation. It is also worthy
to notice that the pH dependence should also include the acid base properties of HDPs. The mixed hydroxo com-plexes of Eu(III) with natural organic matter was proven not to be necessary in the modelling [36]. Further works are needed to confirm these observations, and obtain complexation constants based on the functionality quan-tification. Hence, for further use of speciation calculation we would use the equilibria implying Eu(OH)(HDP) and Eu(OH)2(HDP)3. 3 a c d b 2 1 0 7 6 5 4 3 2 1 0 – 1 – 1 – 3.5 – 2.5 – 1.5 – 1 0 1 2 3 4 5 6 7 8 9 – 3.5 – 2.5 – 1.5 – 1 0 1 2 3 4 5 6 7 – 3.5 – 2.5 – 1.5 – 3.5 – 2.5 – 1.5 log10([HDP] molC/kgW) log10([HDP] molC/kgW) log 10 ([Eu(HDP) m ]/[Eu ]f ) log 10 ([Eu(HDP) m]/[Eu 3 +]) log 10 ([Eu(OH)(HDP) m ]/[Eu(O H 2 +]) log 10 ([Eu(OH) 2 (HDP) m ]/[Eu(O H2 +]) log10([HDP] molC/kgW) log10([HDP] molC/kgW)
Figure 3: Determination of the Eu(III)-HDP complexes’ stoichiometries – on molC/kgw basis – and apparent formation constants Kop from
TRLS results from Figure 2 considering (a) total non-complexed europium, (b) Eu3 + free, (c) EuOH2 +, and (d) Eu(OH)
2+ in solution using hydrolysis constants [23]; [Eu(III)]total = 10 − 6 mol/kgw, I = 0.1 M NaCl.
Table 2: Possible slope analyses of Figure 3 and Figure S6 of the SI. Charges are omitted because of the lack of knowledge on the
function-ality of γ-PVC-HDPs.
Equilibrium Slope r² log10Kop
Eu + HDP EuHDP 1.11 ± 0.05 0.9680 3.23 ± 0.09 Eu3 + + 2 HDP Eu(HDP) 2 1.8 ± 0.5 0.7108 5.5 ± 1.1 Eu3 + + 8 HDP Eu(HDP) 8 7.9 ± 0.5 0.9611 16.1 ± 0.8 Eu(OH)2 + + HDP Eu(OH)HDP Eu3 + + H 2O + HDP Eu(OH)HDP + H + 0.9 ± 0.2 0.8203 3.5 ± 0.4 − 4.3 ± 0.4 Eu(OH)2 + + 5 HDP Eu(OH)(HDP) 5 Eu3 + + H 2O + 5HDP Eu(OH)(HDP)5 + H + 5.3 ± 0.3 0.9799 11.1 ± 0.4 3.3 ± 0.4 Eu(OH)2+ + 3 HDP Eu(OH)2(HDP)3 Eu3 + + 2H 2O + 2HDP Eu(OH)2(HDP)3 + 2H + 2.6 ± 0.2 0.9536 6.1 ± 0.3 − 9.6 + 0.3
3.2.2 Decay time evolution
To help interpreting the slope analyses, the decay time evolutions of two particular points of Figure 2 – pH 8.85, log10[HDP] = − 1.68; and pH 11.21, log10[HDP] = − 0.56 – are presented in Figure 4 – time-resolved spectra in Figure S8 of the SI. The first striking feature is the presence of a bi-exponential decay for the two cases – correlation matri-ces in Table S2 of the SI. The values of τ1 are faster than Eu3 + (110 μs) [43]. If this feature is commonly observed
for natural organic complexes of Eu(III) [34–36, 44], this is to our knowledge the first observation for anthropo-genic organic samples. Faster than Eu3 +
mono-exponen-tial decays were also evidenced for hydroxybenzoic acids complexes [30, 45, 46]. The τ2 values are slower than that of natural organic complexes of Eu(III) [34–36, 44].
Applying the relationship from Kimura and Choppin [47] to the τ2 values, approximately 3.2 (Figure 2a) and 2.3 (Figure 2b) water molecules ( ± 0.5) remain in the first
hydration sphere of the Eu-HDP complex(es). Then, at the end of the complexation reaction – empty points in Figure 2b – only two water molecules are still in the first hydration sphere of Eu(III). Knowing that 8–9 water mole-cules are involved in the first hydration of Eu3 + [48], 6–7
positions should be occupied. As we only have access to the amount of carbon implied in the complexation process, it seems awkward to propose a denticity for Eu-HDP com-plexes. Moreover, the application of the relationship from Kimura and Choppin [47] has not been firmly established in the case of hydroxo complexes of Eu(III) [41]. Neverthe-less, from the concordant data on Eu(OH)2(HDP)3 one can await that the complexes have at least a certain degree of multi-denticity.
4 Implication on Eu(III) solubility
and speciation in the pH/C(γ-
PVC-HDP) studied domain
The solubility surfaces of total 0.01 M Eu(OH)3(am) as a function of pH and γ-PVC-HDP concentration can be drawn (Figure 5a), using the formation constants for Eu(OH)(HDP) and Eu(OH)2(HDP)3 given in Table 2. First, it appears clearly that important amount of γ-PVC-HDPs are needed as important carbon concentration are necessary to obtain a significant solubilisation of Eu(OH)3(s). The sol-ubility of Eu(OH)3(am) is seen noticeably enhanced at the lowest pH and highest γ-PVC-HDP concentration values, but seems limited to less than two orders of magnitude for ca. 1 molC/kgw – which was the amount of carbon concen-tration used here. Nevertheless, the calculated solubility is decreasing with pH – due to the dependence on [H +]n –,
which induces that the affinity of γ-PVC-HDP for Eu(III) increases when pH is decreasing. It means that the influ-ence of γ-PVC-HDP on lanthanides(III) or actinides(III) extends down to mildly alkaline pH media, such as argil-laceous host rock conditions [49–51].
In addition, the solubility surfaces of EuOHCO3(cr) with and without the γ-PVC-HDP at PCO2(g) = 10 − 3.5 atm –
limited in the pH span 6–9.5 – is drawn in Figure 5b. Here again the solubility of the phase is slightly enhanced at higher pH and more important at lower pH, as the solu-bility of EuOHCO3(cr) is increased by four orders of mag-nitude ca. pH 8.5 and 1 molC/kgw. The influence should be lower at PCO2(g) = 10 − 2 atm – as for typical
equiva-lent partial pressure for argillaceous rocks [50, 51], see Figure S7 of the SI –, as the increase is approximately two orders of magnitude at pH 8.5. 20 19 18 17 16 0 100 200 300 400 500 600 0 100 200 300 Delay (μs) τ1 = 55 ± 2 μs τ2 = 364 + 4 μs τ1 = 73 ± 4 μs τ2 = 277 ± 8 μs Delay (μs) Ln (F) Ln (F) 400 500 600 19 b a 18 17
Figure 4: Luminescence decays of Eu(III) at (a) 0.021 molC/kgw (pH 8.85, log10([HDP]/molC/kgw) = − 1.68) and (b) 0.274 molC/kgw (pH 11.21, log10([HDP]/molC/kgw) = − 0.56) of γ-PVC-HDPs. Calculated on the area of the 5D
0 → 7F2 transition, W = 300 μs, λexc = 393.7 nm; plain line is the bi-exponential decay composed of a fast (dotted) and a slow (dash-dot) component, and dashed line is the mono-exponen-tial decay. Uncertainties on decay times are fitting uncertainties.
5 Conclusions
From these experiments, it seems clear that the complex-ation of Eu(III) by γ-PVC-HDPs can occur under cementi-tious conditions, but also under more neutral conditions as in argillaceous host rocks. The slight but significant increase of Eu(OH)3(s) dissolution, the evolution of the
TRLS signal in the supernatant from dissolution experi-ments, the TRLS titration of Eu(III) by γ-PVC-HDPs, and the decay times analyses are all converging to this con-clusion. It seems that several complexes are occurring, but the exact stoichiometry is still difficult to assess. From our experiments, as awaited from the thermody-namic data available, the synthetic solutions do not seem to increase the dissolution of Eu(OH)3(s) in alkaline medium. The amount of HDPs, on carbon concentration basis, needed to have an appreciable effect on the solu-bility in high alkaline media, and the operational forma-tion constants (Kop), allow providing a global evaluation of the γ-PVC-HDPs impact, knowing their inventory in the wastes.
Further works are needed, particularly in the light of more recent identification of molecules in γ-PVC-HDPs [5] to ascertain the composition of these γ-PVC-HDPs, their functionality – particularly the organic moieties that are responsible of these complexation reactions – and to determine the variability of the complexing moieties as a function of the polymer and the γ-ray dose. The interac-tions of these organic moieties with cementitious phases [32, 52] should also be of interest to appreciate their retar-dation in cements before reaching the host rock.
Acknowledgements: Camille Auriault and Daniel Léonço
are acknowledged for their participation in the experi-mental dissolution and TRLS work. Soumaya Boughattas is acknowledged for the synthesis of Eu(OH)3(s). Dr. Nath-alie Macé is acknowledged for her support during the TOC analyses. This work was financed by AREVA, Andra, and CEA within the framework of the COSTO project from CEA. Dr. Christine Lamouroux-Lucas is acknowledged for her strong support.
References
1. Berner, U. R.: Evolution of pore water chemistry during degrada-tion of cement in a radioactive waste repository environment. Waste Manage. 12, 201 (1992).
2. Colombani, J., Herbette, G., Rossi, C., Joussot-Dubien, C., Labed, V., Gilardi, T.: Leaching of plasticized PVC: effect of irradiation. J. Appl. Polym. Sci. 112, 1372 (2009).
3. Dannoux, A.: Extrapolation dans le temps des cinétiques de pro-duction des produits de dégradation radiolytique : application à un polyuréthane (2007), PhD Thesis, Université Paris XI, Orsay, France, p. 270.
4. Dannoux, A., Esnouf, S., Amekraz, B., Dauvois, V., Moulin, C.: Degradation mechanism of poly(ether-urethane) Estane® induced by high-energy radiation. II. Oxidation effects. J. Polym. Sci., Part B: Polym. Phys. 46, 861 (2008). – 2 – 4 – 6 – 8 6 pH log10([HDP]/molC/kgW) log10([HDP]/molC/kgW) pH 6 – 8 – 6 – 4 – 2 b a 7 8 9 – 6 – 4 – 2 0 log 10 ([Eu]/mol/kg W ) log 10 ([Eu]/mol/kg W ) 8–4 –2 –5 –3 –4 –2 –2 –2 –2 –5 –3 –4 –4 –4 –4 –3 –3 –3 –3 –4 –6 –6 –6 –5 –5 –5 –5 –6 –4 –4 –5 –5 –4 –4 –2 –3 –3 –4 –5 –5 –5 –6 –6 –6 –6 –7 –7 –7 –7 10 12 – 6 – 4 – 2 0
Figure 5: Evolution of the solubility surfaces of [Eu]tot = 10 − 2 mol/ kgw as a function of pH and concentration of γ-PVC-HDP, on total carbon basis, using thermodynamic constants [23, 25] and forma-tion constants for Eu(OH)(HDP) and Eu(OH)2(HDP)3 in Table 2 of (a) Eu(OH)3(am) at PCO2(g) = 10 − 12 atm, and (b) EuOHCO
3(cr) at PCO2(g) = 10 − 3.5 atm.
5. Fromentin, E., Pielawski, M., Lebeau, D., Esnouf, S., Cochin, F., Legand, S., Ferry, M.: Leaching of radio-oxidized poly(ester urethane): water-soluble molecules characterization. Polym. Degrad. Stab. 128, 172 (2016).
6. Bourbon, X., Toulhoat, P.: Influence of organic degradation products on the solubilisation of radionuclides in intermedi-ate and low level radioactive wastes. Radiochim. Acta 74, 315 (1996).
7. Vercammen, K., Glaus, M. A., Van Loon, L. R.: Complexation of Th(IV) and Eu(III) by α-isosaccharinic acid under alkaline condi-tions. Radiochim. Acta 89, 393 (2001).
8. Glaus, M. A., Van Loon, L. R.: Degradation of cellulose under alkaline conditions: new insights from a 12 years degradation study. Environ. Sci. Technol. 42, 2906 (2008).
9. Van Loon, L. R., Hummel, W.: Radiolytic and chemical degrada-tion of strong acidic ion-exchange resins: study of the ligands formed. Nucl. Technol. 128, 359 (1999).
10. Van Loon, L. R., Hummel, W.: The degradation of strong basic anion exchange resins and mixed-bed ion-exchange resins: effect of degradation products on radionuclide speciation. Nucl. Technol. 128, 388 (1999).
11. Hummel, W., Van Loon, L. R.: The effect of degradation products of strong acidic cation exchange resins on radionuclide specia-tion: a case study with Ni2 +. Nucl. Technol. 128, 372 (1999). 12. Choppin, G. R., Dadgar, A., Rizkalla, E. N.: Thermodynamics of
complexation of lanthanides by dicarboxylate ligands. Inorg. Chem. 25, 3581 (1986).
13. Lajunen, L. H. J., Portanova, R., Piispanen, J., Tolazzi, M.: Critical evaluation of stability constants for alpha-hydroxycarboxylic acid complexes with protons and metal ions and the accompany-ing enthalpy changes – Part I: aromatic ortho-hydroxycarboxylic acids. Pure Appl. Chem. 69, 329 (1997).
14. Portanova, R., Lajunen, L. H. J., Tolazzi, M., Piispanen, J.: Critical evaluation of stability constants for alpha-hydroxycarboxylic acid complexes with protons and metal ions and the accompa-nying enthalpy changes – Part II: aliphatic 2-hydroxycarboxylic acids. Pure Appl. Chem. 75, 495 (2003).
15. Hummel, W., Anderegg, G., Rao, L. F., Puigdomènech, I., Tochiyama, O.: Chemical Thermodynamics 9. Chemical Thermodynamics of Compounds and Complexes of U, Np, Pu, Am, Tc, Se, Ni and Zr with Selected Organic Ligands (2005), North Holland Elsevier Science Publishers B. V., Amsterdam, The Netherlands, p. 1088.
16. Wieland, E., Jakob, A., Tits, J., Lothenbach, B., Kunz, D.: Sorption and diffusion studies with low molecular weight organic compounds in cementitious systems. Appl. Geochem. 67, 101 (2016).
17. Vercammen, K., Glaus, M. A., Van Loon, L. R.: Evidence for the existence of complexes between Th(IV) and α-isosaccharinic acid under alkaline conditions. Radiochim. Acta 84, 221 (1999).
18. Vercammen, K., Glaus, M. A., Van Loon, L. R.: Complexation of calcium by α-isosaccharinic acid under alkaline conditions. Acta Chem. Scand. 53, 241 (1999).
19. Wang, Z. M., van de Burgt, L. J., Choppin, G. R.: Spectroscopic study of lanthanide(III) complexes with carboxylic acids. Inorg. Chim. Acta 293, 167 (1999).
20. Thakur, P., Conca, J. L., Choppin, G. R.: Complexation studies of Cm(III), Am(III), and Eu(III) with linear and cyclic carboxylates and polyaminocarboxylates. J. Coord. Chem. 64, 3215 (2011).
21. Park, K. K., Jung, E. C., Cho, H. R., Kim, W. H.: Ternary complex formation of Eu(III) with o-phthalate in aqueous solutions. Spec-trochim. Acta, Part A 73, 615 (2009).
22. Pearson, R. G.: Hard and soft acids and bases. J. Am. Chem. Soc.
85, 3533 (1963).
23. Hummel, W., Berner, U., Curti, E., Pearson, F. J., Thoenen, T.: Nagra/PSI chemical thermodynamic data base 01/01 (2002), NAGRA, Report NTB 02-06, Parkland, FL, USA. p. 564. 24. Kielland, J.: Individual activity coefficients of ions in aqueous
solutions. J. Am. Chem. Soc. 59, 1675 (1937).
25. Vercouter, T., Vitorge, P., Trigoulet, N., Giffaut, E., Moulin, C.: Eu(CO3)33- and the limiting carbonate complexes of other M3 + f-elements in aqueous solutions: a solubility and TRLFS study. New J. Chem. 29, 544 (2005).
26. Berner, U. R.: Modeling the incongruent dissolution of hydrated cement minerals. Radiochim. Acta 44–45, 387 (1988).
27. Berner, U. R.: A Thermodynamic Description of the Evolution of Pore Water Chemistry and Uranium Speciation during the Degradation of Cement (1990), Nagra, Report PSI Bericht 62, Paul Scherrer Institut, Villigen, Switzerland, and TR-90-12, Wettingen, Switzerland. 28. Macero, D. J., Anderson, L. B., Malachesky, P.: Voltammetric
studies of Eu(III) in formate buffer – Formal potential of Eu(III)-Eu(II) system. J. Electroanal. Chem. 10, 76 (1959).
29. Pascual, E. G., Choppin, G. R.: The thermodynamics of compl-exation of lanthanides by o-phthalic acid. Lanthanide Actinide Res. 1, 57 (1985).
30. Moreau, P., Colette-Maatouk, S., Vitorge, P., Gareil, P., Reiller, P. E.: Complexation of europium(III) by hydroxybenzoic acids: a time-resolved luminescence spectroscopy study. Inorg. Chim. Acta 432, 81 (2015).
31. Wang, Z. M., van de Burgt, L. J., Choppin, G. R.: Spectroscopic study of lanthanide(III) complexes with aliphatic dicarboxylic acids. Inorg. Chim. Acta 310, 248 (2000).
32. Pointeau, I., Hainos, D., Coreau, N., Reiller, P.: Effect of organics on selenite uptake by cementitious materials. Waste Manage.
26, 733 (2006).
33. Berthoud, T., Decambox, P., Kirsch, B., Mauchien, P., Moulin, C.: Direct determination of traces of lanthanide ions in aqueous-solutions by laser-induced time-resolved spectrofluorimetry. Anal. Chim. Acta 220, 235 (1989).
34. Brevet, J., Claret, F., Reiller, P. E.: Spectral and temporal lumi-nescent properties of Eu(III) in humic substance solutions from different origins. Spectrochim. Acta, Part A 74, 446 (2009). 35. Reiller, P. E., Brevet, J.: Bi-exponential decay of Eu(III) complexed by
Suwannee River humic substances: spectroscopic evidence of two different excited species. Spectrochim. Acta, Part A 75, 629 (2010). 36. Kouhail, Y. Z., Benedetti, M. F., Reiller, P. E.: Eu(III)-fulvic acid
complexation: evidence of fulvic acid concentration depend-ent interactions by time-resolved luminescence spectroscopy. Environ. Sci. Technol. 50, 3706 (2016).
37. Carnall, W. T., Fields, P. R., Rajnak, K.: Electronic energy levels of trivalent lanthanide aquo ions. IV. Eu3 +. J. Chem. Phys. 49, 4450 (1968).
38. Dryer, D. J., Korshin, G. V., Fabbricino, M.: In situ examination of the protonation behavior of fulvic acids using differential absorb-ance spectroscopy. Environ. Sci. Technol. 42, 6644 (2008). 39. Janot, N., Reiller, P. E., Korshin, G. V., Benedetti, M. F.: Using
spectrophotometric titrations to characterize humic acid reactiv-ity at environmental concentrations. Environ. Sci. Technol. 44, 6782 (2010).
40. Yan, M., Dryer, D., Korshin, G. V.: Spectroscopic characterization of changes of DOM deprotonation–protonation properties in water treatment processes. Chemosphere 148, 426 (2016). 41. Plancque, G., Moulin, V., Toulhoat, P., Moulin, C.: Europium
spe-ciation by time-resolved laser-induced fluorescence. Anal. Chim. Acta 478, 11 (2003).
42. Vercouter, T.: Complexes aqueux de lanthanides (III) et actinides (III) avec les ions carbonates et sulfates. Etude thermodynam-ique par spectrofluorimétrie laser résolue en temps et spectro-métrie de masse à ionisation électrospray (2005), Université Evry-Val d’Essonne, Evry, France, p. 253.
43. Horrocks, W. D., Jr., Sudnick, D. R.: Lanthanide ion probes of structure in biology. Laser-induced luminescence decay constants provide a direct measure of the number of metal-coordinated water-molecules. J. Am. Chem. Soc. 101, 334 (1979). 44. Reiller, P. E., Brevet, J., Nebbioso, A., Piccolo, A.: Europium(III)
complexed by HPSEC size-fractions of a vertisol humic acid: small differences evidenced by time-resolved luminescence spectroscopy. Spectrochim. Acta, Part A 78, 1173 (2011). 45. Plancque, G., Maurice, Y., Moulin, V., Toulhoat, P., Moulin, C.: On
the use of spectroscopic techniques for interaction studies, Part I: complexation between europium and small organic ligands. Appl. Spectrosc. 59, 432 (2005).
46. Kuke, S., Marmodée, B., Eidner, S., Schilde, U., Kumke, M. U.: Intramolecular deactivation processes in complexes of salicylic acid or glycolic acid with Eu(III). Spectrochim. Acta, Part A 75, 1333 (2010).
47. Kimura, T., Choppin, G. R.: Luminescence study on determina-tion of the hydradetermina-tion number of Cm(III). J. Alloys Compd. 213, 313 (1994).
48. Marmodée, B., Jahn, K., Ariese, F., Gooijer, C., Kumke, M. U.: Direct spectroscopic evidence of 8- and 9-fold coordinated europium(III) species in H2O and D2O. J. Phys. Chem. A 114, 13050 (2010).
49. Pearson, F. J.: Opalinus Clay Experimental Water: A1 Type, Version 980318 (1998), Paul Scherrer Institut, Report Technical Report TM-44-98-07, Villigen, Switzerland.
50. de Craen, M., Wang, L., Van Geet, M., Moors, H.: Geochemistry of Boom Clay Pore Water at the Mol site (2004), SCK•CEN, Report SCK•CEN-BLG-990, Mol, Belgium. p. 181.
51. Gaucher, E. C., Blanc, P., Bardot, F., Braibant, G., Buschaert, S., Crouzet, C., Gautier, A., Girard, J.-P., Jacquot, E., Lassin, A., Negrel, G., Tournassat, C., Vinsot, A., Altmann, S.: Modelling the porewater chemistry of the Callovian-Oxfordian formation at a regional scale. C. R. Geosci. 338, 917 (2006).
52. Pointeau, I., Coreau, N., Reiller, P. E.: Uptake of anionic radio-nuclides Cl −, I −, SeO
32 − and CO32 − onto degraded cement pastes and competing effect of organic ligands. Radiochim. Acta 96, 367 (2008).
Supplemental Material: The online version of this article
(DOI: 10.1515/ract-2016-2691) offers supplementary material, available to authorized users.


![Figure 4: Luminescence decays of Eu(III) at (a) 0.021 mol C /kg w (pH 8.85, log 10 ([HDP]/mol C /kg w ) = − 1.68) and (b) 0.274 mol C /kg w (pH 11.21, log 10 ([HDP]/mol C /kg w ) = − 0.56) of γ-PVC-HDPs](https://thumb-eu.123doks.com/thumbv2/123doknet/13128949.387947/9.892.95.387.505.964/figure-luminescence-decays-iii-hdp-hdp-pvc-hdps.webp)
![Figure 5: Evolution of the solubility surfaces of [Eu] tot = 10 − 2 mol/](https://thumb-eu.123doks.com/thumbv2/123doknet/13128949.387947/10.892.74.426.96.801/figure-evolution-solubility-surfaces-eu-tot-mol.webp)
