HAL Id: tel-02457134
https://tel.archives-ouvertes.fr/tel-02457134
Submitted on 27 Jan 2020HAL is a multi-disciplinary open access archive for the deposit and dissemination of sci-entific research documents, whether they are pub-lished or not. The documents may come from teaching and research institutions in France or abroad, or from public or private research centers.
L’archive ouverte pluridisciplinaire HAL, est destinée au dépôt et à la diffusion de documents scientifiques de niveau recherche, publiés ou non, émanant des établissements d’enseignement et de recherche français ou étrangers, des laboratoires publics ou privés.
An Efficient Classification Model for Analyzing Skewed
Data to Detect Frauds in the Financial Sector
Sara Makki
To cite this version:
Sara Makki. An Efficient Classification Model for Analyzing Skewed Data to Detect Frauds in the Financial Sector. Data Structures and Algorithms [cs.DS]. Université de Lyon; Université libanaise, 2019. English. �NNT : 2019LYSE1339�. �tel-02457134�
N°d’ordre NNT : 2019LYSE1339
THESE de DOCTORAT DE L’UNIVERSITE DE LYON
opérée au sein de
L’Université Claude Bernard Lyon 1
Ecole Doctorale
N° 512Informatique et Mathématiques de Lyon (InfoMaths)
Spécialité de doctorat
:Discipline
: InformatiqueSoutenue publiquement le 20/12/2019, par :
Sara MAKKI
An Efficient Classification Model for
Analyzing Skewed Data to Detect Frauds
in the Financial Sector
Devant le jury composé de :
Mme. MURISASCO Elisabeth, Professeure, Université de Toulon Rapporteure Mme. SOULE-DUPUY Chantal, Professeure, Université Toulouse Rapporteure M. BOUCELMA Omar, Professeur, Aix-Marseille Université Examinateur Mme. ASSAGHIR Zainab, Prof. Associée, Université Libanaise Examinatrice M. TAHER Yehia, McF, Université de Versailles Examinateur Mme. SEBA Hamida, McF-HDR, Université Lyon 1 Examinatrice M. HACID Mohand-Saïd, Professeur, Université Lyon 1 Directeur de thèse M. ZEINEDDINE Hassan, Professeur, Université Libanaise Directeur de thèse M. HAQUE AKM Rafiqul, Directeur de recherche, Intelligencia Invité
Declaration of Authorship
I hereby declare that except where specific reference is made to the work of others, the contents of this dissertation are original and have not been submitted in whole or in part for consideration for any other degree or qualification in this, or any other university. This dissertation is my own work and contains nothing which is the outcome of work done in collaboration with others, except as specified in the text and Acknowledgements.
Sara A. Makki December 2019
Acknowledgements
I take this opportunity to express my sincere gratitude to my teachers, colleagues, friends, and family. It is my pleasure to acknowledge the roles of everyone who was helpful and supportive for the completion of my PhD research.
I would like to thank my supervisors Pr. Hassan Zeineddine in Lebanon and Pr. Mohand-Saïd Hacid in France, for their support, their trust in my abilities and their caring. I also want to thank Dr. Zainab Assaghir for the great help and guidance she provided since she started teaching me in my masters years. My PhD was also partly supervised by Dr. Yehia Taher from the University of Versailles and Dr. Rafiqul Haque from intelligencia to whom I will always be grateful.
Besides my advisors, I would like to thank the rest of my thesis committee: Pr. Elisabeth Murisasco, Pr. Chantal Soule-Dupuy, Pr. Omar Boucelma and Dr. Hamida Seba for their insightful comments and constructive feedback; and also for the great discussions that encouraged me to widen my research to various perspectives.
I am incredibly grateful to my friends, for the unforgettable and joyful moments we shared that made those three years much more easier. I specifically want to thank the friends that I literally couldn’t have made it without their continuous daily support, Ali Janbain, Mouhammad Ghader, Joseph Hadchiti, and my friend for almost eight years, Rayane Hashem. I want to thank the friends that I shared the best, the worst and the funniest moments of my life with, Ghina Nassredine, Lara Daw, Inès Abdallah, Nizar Obeid, Cihan Tunç, Mohammad Akil and Lania Hammoud. I would also like to thank Ali Masri and Khodor Hammoud for their help every time I needed it.
Finally, I want to thank my family for the unconditional love. I would not have made it this far without the huge support that my mother provided everyday. I want to thank my father and brother for being always by my side. I cannot thank enough my aunt Yamama Chreim, the inspiration to any strong independent woman; and my uncle Ali Makki for his love and caring. Finally, I want to thank my cousins Fayez-Rayan and David for always bringing joy and laughter to my heart.
Abstract
There are different types of risks in financial domain such as, terrorist financing, money laundering, credit card fraudulence and insurance fraudulence that may result in catas-trophic consequences for entities such as banks or insurance companies. These financial risks are usually detected using classification algorithms.
In classification problems, the skewed distribution of classes also known as class im-balance, is a very common challenge in financial fraud detection, where special data mining approaches are used along with the traditional classification algorithms to tackle this issue.
Imbalance class problem occurs when one of the classes have more instances than another class. This problem is more vulnerable when we consider big data context. The data sets that are used to build and train the models contain an extremely small portion of minority group also known as positives in comparison to the majority class known as negatives. In most of the cases, it’s more delicate and crucial to correctly classify the minority group rather than the other group, like fraud detection, disease diagnosis, etc. In these examples, the fraud and the disease are the minority groups and it’s more delicate to detect a fraud record because of its dangerous consequences, than a normal one. These class data proportions make it very difficult to the machine learning classifier to learn the characteristics and patterns of the minority group. These classifiers will be biased towards the majority group because of their many examples in the data set and will learn to classify them much faster than the other group.
After conducting a thorough study to investigate the challenges faced in the class im-balance cases, we found that we still can’t reach an acceptable sensitivity (i.e. good classification of minority group) without a significant decrease of accuracy. This leads to another challenge which is the choice of performance measures used to evaluate models. In these cases, this choice is not straightforward, the accuracy or sensitivity alone are misleading. We use other measures like precision-recall curve or F1- score to evaluate
this trade-off between accuracy and sensitivity. Our objective is to build an imbalanced vii
classification model that considers the extreme class imbalance and the false alarms, in a big data framework.
We developed two approaches: A Cost-Sensitive Cosine Similarity K-Nearest Neighbor (CoSKNN) as a single classifier, and a K-modes Imbalance Classification Hybrid Approach (K-MICHA) as an ensemble learning methodology. In CoSKNN, our aim was to tackle the imbalance problem by using cosine similarity as a distance metric and by introducing a cost sensitive score for the classification using the KNN algorithm. We conducted a comparative validation experiment where we prove the effectiveness of CoSKNN in terms of accuracy and fraud detection. On the other hand, the aim of K-MICHA is to cluster similar data points in terms of the classifiers outputs. Then, calculating the fraud probabilities in the obtained clusters in order to use them for detecting frauds of new transactions. This approach can be used to the detection of any type of financial fraud, where labelled data are available.
At the end, we applied K-MICHA to a credit card, mobile payment and auto insurance fraud data sets. In all three case studies, we compare K-MICHA with stacking using voting, weighted voting, logistic regression and CART. We also compared with Adaboost and random forest. We prove the efficiency of K-MICHA based on these experiments. We also implemented K-MICHA in a big data framework using H2O and R. We were able to process and analyse bigger data sets in a very short period of time.
Keywords: Financial fraud, Class imbalance, F1– score, Cost Sensitive Classification,
Cosine similarity, K-Nearest Neighbors, Ensemble learning, K-modes.
Résumé
Différents types de risques existent dans le domaine financier, tels que le financement du terrorisme, le blanchiment d’argent, la fraude de cartes de crédit, la fraude d’assurance, les risques de crédit, etc. Tout type de fraude peut entraîner des conséquences catas-trophiques pour des entités telles que les banques ou les compagnies d’assurances. Ces risques financiers sont généralement détectés à l’aide des algorithmes de classification. Dans les problèmes de classification, la distribution asymétrique des classes, également connue sous le nom de déséquilibre de classe (class imbalance), est un défi très commun pour la détection des fraudes. Des approches spéciales d’exploration de données sont utilisées avec les algorithmes de classification traditionnels pour résoudre ce problème. Le problème de classes déséquilibrées se produit lorsque l’une des classes dans les données a beaucoup plus d’observations que l’autre classe. Ce problème est plus vul-nérable lorsque l’on considère dans le contexte des données massives (Big Data). Les données qui sont utilisées pour construire les modèles contiennent une très petite par-tie de groupe minoritaire qu’on considère positifs par rapport à la classe majoritaire connue sous le nom de négatifs. Dans la plupart des cas, il est plus délicat et crucial de classer correctement le groupe minoritaire plutôt que l’autre groupe, comme la dé-tection de la fraude, le diagnostic d’une maladie, etc. Dans ces exemples, la fraude et la maladie sont les groupes minoritaires et il est plus délicat de détecter un cas de fraude en raison de ses conséquences dangereuses qu’une situation normale. Ces pro-portions de classes dans les données rendent très difficile à l’algorithme d’apprentissage automatique d’apprendre les caractéristiques et les modèles du groupe minoritaire. Ces algorithmes seront biaisés vers le groupe majoritaire en raison de leurs nombreux exem-ples dans l’ensemble de données et apprendront à les classer beaucoup plus rapidement que l’autre groupe.
Après avoir mené une étude approfondie pour examiner les défis rencontrés dans le cas de déséquilibre des classes, nous avons constaté que nous ne pouvons toujours pas atteindre une sensibilité acceptable (c.à.d. une bonne classification du groupe
minoritaire) sans une diminution significative du taux total de classification correcte. Cela conduit à un autre défi qui est le choix des mesures de performance utilisées pour valider les modèles. Le taux total de classification correcte ou la sensibilité seuls ne sont pas suffisants. Nous utilisons d’autres mesures comme la courbe de Precision-Recall ou le score F1 pour évaluer ce compromis entre précision et sensibilité.
Dans ce travail, nous avons développé deux approches : Une première approche ou classifieur unique basée sur les k plus proches voisins et utilise le cosinus comme mesure de similarité (Cost Sensitive Cosine Similarity K-Nearest Neighbors : CoSKNN) et une deuxième approche ou approche hybride qui combine plusieurs classifieurs uniques et fondu sur l’algorithme k-modes (K-modes Imbalanced Classification Hybrid Approach : K-MICHA). Dans l’algorithme CoSKNN, notre objectif était de résoudre le problème du déséquilibre en utilisant la mesure de cosinus et en introduisant un score sensible au coût pour la classification basée sur l’algorithme de KNN. Nous avons mené une expérience de validation comparative au cours de laquelle nous avons prouvé l’efficacité de CoSKNN en termes de taux de classification correcte et de détection des fraudes. D’autre part, K-MICHA a pour objectif de regrouper des points de données similaires en termes des résultats de classifieurs. Ensuite, calculez les probabilités de fraude dans les groupes obtenus afin de les utiliser pour détecter les fraudes de nouvelles observations. Cette approche peut être utilisée pour détecter tout type de fraude financière, lorsque des données étiquetées sont disponibles.
La méthode K-MICHA est appliquée dans 3 cas: données concernant la fraude par carte de crédit, paiement mobile et assurance automobile. Dans les trois études de cas, nous comparons K-MICHA au stacking en utilisant le vote, le vote pondéré, la régression logistique et l’algorithme CART. Nous avons également comparé avec Adaboost et la forêt aléatoire. Nous prouvons l’efficacité de K-MICHA sur la base de ces expériences. Nous avons également appliqué K-MICHA dans un cadre Big Data en utilisant H2O et R. Nous avons pu traiter et analyser des ensembles de données plus volumineux en très peu de temps.
Mots-clés: fraude financière, déséquilibre de classe, score F1, classification sensible aux
coûts, mesure de cosinus, K plus proche voisins, Apprentissage ensembliste, k-modes.
Table of Contents
Declaration of Authorship iii
Acknowledgements v
Abstract vii
Résumé ix
List of Figures xv
List of Tables xix
List of Abbreviations xxi
Glossary of Terms xxiii
List of Publications xxv
1 Introduction 1
1.1 Background . . . 1
1.2 Motivation . . . 6
1.2.1 Financial Impact of Fraud . . . 6
1.2.2 The Challenges of Fraud Detection . . . 7
1.3 Problem Description . . . 9
1.3.1 Class Imbalance Problem . . . 9
1.3.2 Selection of Performance Measures . . . 11
1.4 Research Goal & Objectives . . . 13
1.5 Contributions . . . 13
1.6 Research Scope . . . 15
Table of Contents
2 Literature Review 19
2.1 Introduction . . . 19
2.2 Fraud Detection Technologies . . . 20
2.2.1 Credit Card Fraud Analysis Approaches . . . 20
2.2.2 Telecommunication Fraud Analysis Approaches . . . 22
2.2.3 Financial Statements Fraud Analysis Approaches . . . 23
2.2.4 Securities Fraud Detection Approaches . . . 24
2.2.5 Insurance Fraud Analysis Approaches . . . 24
2.2.6 Anti-Money Laundering Systems . . . 25
2.2.7 Computer Intrusion Detection Systems . . . 26
2.2.8 Data Driven Fraud Detection Approaches . . . 27
2.2.9 Real-Time Fraud Detection Systems . . . 29
2.2.10 Ensemble Learning Approaches for Fraud Detection . . . 30
2.3 A Comparative Study . . . 32
2.3.1 Design of Experiment . . . 32
2.3.2 Results and Discussion . . . 33
2.4 Shortcomings of Existing Methods . . . 40
3 CoSKNN: Cost-Sensitive Cosine Similarity K-Nearest Neighbors Approach 41 3.1 Introduction to K-Nearest Neighbors . . . 42
3.1.1 Classification Using KNN . . . 42
3.1.2 Cost Sensitive KNN . . . 43
3.2 CoSKNN: Approach Theory and Implementation . . . 44
3.2.1 The Use of Cosine Similarity . . . 45
3.2.2 The Introduction of the Score Sy . . . 45
3.2.3 The Classification Using CoSKNN . . . 46
3.3 Validation Experiment . . . 47
3.3.1 Methods Results . . . 48
3.3.2 Discussion . . . 49
4 K-MICHA: K-Modes Imbalance Classification Hybrid Approach 51 4.1 Introduction to Ensemble Learning . . . 51
4.2 Examples of Ensemble Learning . . . 52
4.2.1 Simple and Weighted Voting . . . 52
4.2.2 Stacking . . . 54
4.2.3 Bagging and Boosting . . . 55
4.3 K-MICHA: Theoretical Framework and Implementation . . . 57 xii
Table of Contents
Phase I - Diversification: Training of N Methods . . . . 57
Phase II - Integration: The Combination of the N Methods . . . . 57
4.3.1 Clustering: The k-modes Algorithm . . . 60
4.3.2 Fraud Probabilities and Approach Validation . . . 63
4.3.3 Threshold Choice . . . 63
5 Evaluation of K-MICHA 65 5.1 Design of the Experiment . . . 66
5.2 Case Study 1: Credit Card Fraud Detection . . . 69
5.2.1 Data Description . . . 69
5.2.2 Implementation and Results . . . 71
5.2.3 Validation and Comparison . . . 78
5.3 Case Study 2: Mobile Payment Fraud Detection . . . 81
5.3.1 Data Description . . . 81
5.3.2 Implementation and Results . . . 83
5.3.3 Validation and Comparison . . . 90
5.4 Case Study 3: Auto Insurance Fraud Detection . . . 93
5.4.1 Data Description . . . 93
5.4.2 Implementation and Results . . . 97
5.4.3 Validation and Comparison . . . 106
5.5 Big Data Fraud Detection Using H2O Platform in R . . . 110
5.5.1 Introduction to H2O . . . 110
5.5.2 Application to Credit Card Fraud Data Set . . . 111
5.6 Discussion . . . 114
6 Conclusion and Future Work 117 6.1 Conclusion . . . 117
6.2 Future Work . . . 119
References 121 Appendix A Classification Methods for Fraud Detection 135 A.1 Machine Learning Classification Algorithms . . . 135
A.1.1 Decision Tree (C5.0) . . . 135
A.1.2 Support Vector Machines (SVM) . . . 136
A.1.3 Artificial Neural Network (ANN) . . . 137
A.1.4 Naïve Bayes (NB) . . . 137
A.1.5 Bayesian Belief Network (BBN) . . . 138 xiii
Table of Contents
A.1.6 Logistic Regression (LR) . . . 138
A.1.7 K-Nearest Neighbour (KNN) . . . 139
A.1.8 Artificial Immune Systems (AIS) . . . 139
A.2 Imbalanced Classification Approaches . . . 139
A.2.1 Random Oversampling (RO) . . . 140
A.2.2 One-Class Classification (OCC) . . . 140
A.2.3 Cost-Sensitive models (CS) . . . 141
Appendix B Variable Selection in Logistic Regression 143 B.1 Case Study 2: Mobile Payment Fraud Detection . . . 143
B.2 Case Study 3: Auto Insurance Fraud Detection . . . 144
List of Figures
1.1 The global trend of different types of frauds (Source[1]) . . . 7
1.2 An example of class imbalance situation . . . 10
2.1 BBN layout . . . 34
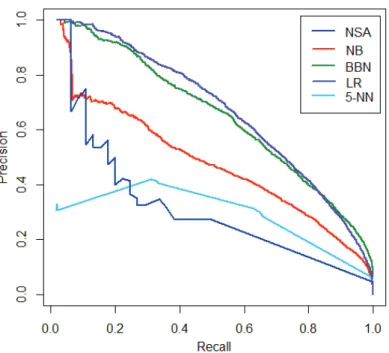
2.2 Comparing PR curves . . . 36
2.3 ANN plot . . . 38
2.4 AANN plot . . . 38
2.5 PR curves for C5.0 methods . . . 39
2.6 PR curves for SVM methods . . . 39
2.7 PR curves for ANN methods . . . 40
3.1 PR curves for all methods . . . 49
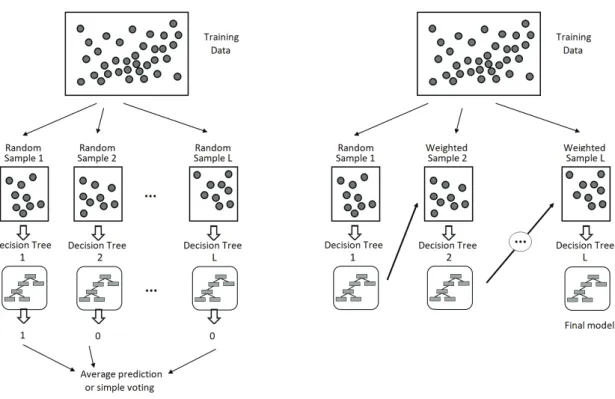
4.1 Example of voting . . . 53
4.2 Example of weighted voting . . . 54
4.3 Stacking diagram . . . 55
4.4 Bagging vs. Boosting . . . 56
4.5 K-MICHA framework diagram showing Phase I where the training of the N methods is done and Phase II where the integration is done using k-modes. An example is shown here with CART, KNN, ..., NB and ANN. The outputs of these methods form the second train set, where k-modes is applied to create clusters. Fraud probabilities are then calculated for each clusters using the target variable’s actual values. . . 59
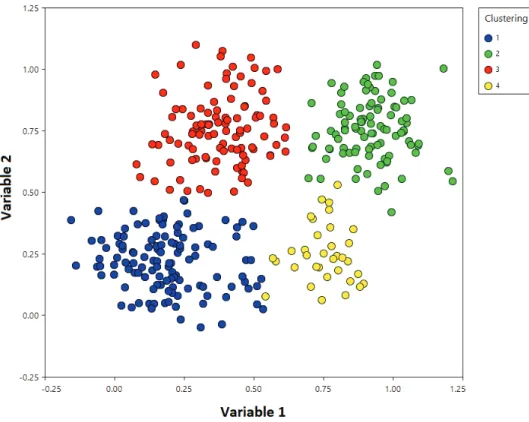
4.6 Example of clustering results . . . 60
4.7 Example of k-means or k-modes iterations[2] . . . 62
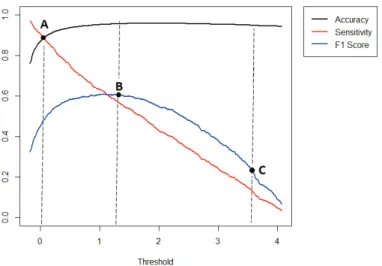
4.8 The change of accuracy, sensitivity and F1score with different thresholds 64 5.1 Histogram of balance . . . 70
5.2 Boxplot of balance . . . 70 xv
List of Figures
5.3 Scatter plot of balance against number of transactions . . . 71
5.4 Performance measures variations according to different thresholds - case study 1 . . . 72
5.5 ANN architecture - case study 1 . . . 74
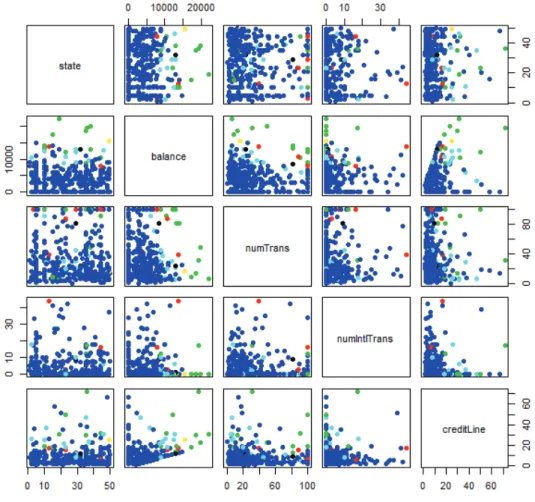
5.6 Pairs of the explanatory variables scatter plots colored by the clusters -case study 1 . . . 76
5.7 Scatter plot of creditLine against balance colored by the clusters . . . 77
5.8 Scatter plot of balance against numTrans colored by the clusters . . . 77
5.9 CART stacking tree - case study 1 . . . 79
5.10 Scatter plot of amount . . . 83
5.11 Performance measures variations according to different thresholds - case study 2 . . . 84
5.12 CART tree as single classifier - case study 2 . . . 86
5.13 Pairs of the explanatory variables scatter plots colored by the clusters -case study 2 . . . 88
5.14 Scatter plot of oldbalanceOrg against amount colored by the clusters . . . 89
5.15 Scatter plot of newbalanceDest against amount colored by the clusters . . 89
5.16 CART stacking tree - case study 2 . . . 91
5.17 Histograms of capital.gains and capital.loss . . . 94
5.18 Histograms of policy_annual_premium . . . 95
5.19 Boxplots of the claims amounts variables . . . 96
5.20 Scatter Plot of annual_premium against total_claim_amount . . . 97
5.21 Performance measures variations according to different thresholds - case study 3 . . . 98
5.22 Trees errors . . . 100
5.23 ANN architecture . . . 101
5.24 Scatter plot of policy_annual_premium against incident_severity colored by the clusters . . . 104
5.25 Scatter plot of total_claim_amount against injury_claim colored by the clusters . . . 104
5.26 Scatter plot of total_claim_amount against property_claim colored by the clusters . . . 105
5.27 Scatter plot of policy_annual_premium against vehicle_claim colored by the clusters . . . 105
5.28 CART stacking tree - case study 3 . . . 107
5.29 The H2O platform diagram . . . 111
List of Figures
A.1 SVM classification . . . 136
A.2 The multilayer perceptron model . . . 137
B.1 Pairs of scatter plot of variables with high VIF - case study 2 . . . 144
B.2 Pairs of scatter plot of variables with high VIF - case study 3 . . . 146
List of Tables
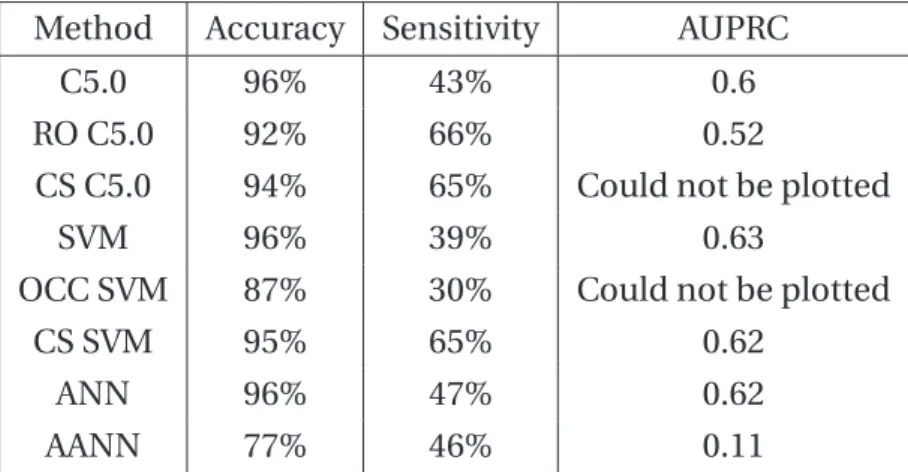
1.1 Different types of fraud . . . 3 1.2 Form of confusion matrix . . . 11 2.1 Performance of different methods . . . 34 2.2 Table summarizing the performance measures of imbalance approaches 39 3.1 Methods used in the comparison . . . 47 3.2 Table summarizing the performance measures . . . 48 3.3 Advantages and disadvantages of CoSKNN . . . 50 4.1 The created training set . . . 58 5.1 Description of the three case studies . . . 66 5.2 Ensemble learning methods compared with K-MICHA . . . 68 5.3 Statistical summary of numTrans,numIntlTrans and creditLine . . . 70 5.4 Data partition and thresholds for the methods - case study 1 . . . 72 5.5 VIF test results for LR - case study 1 . . . 73 5.6 LR coefficients - case study 1 . . . 73 5.7 The clusters characteristics - case study 1 . . . 75 5.8 VIF Test Results for LR Stacking - case study 1 . . . 78 5.9 LR Stacking Coefficients - case study 1 . . . 78 5.10 Methods importance according to CART stacking - case study 1 . . . 78 5.11 Variables importance according to RF - case study 1 . . . 80 5.12 The performance K-MICHA vs. other approaches - case study 1 . . . 80 5.13 Categories frequencies of the variable type . . . 81 5.14 Quantiles of the variable amount . . . 82 5.15 Data partition and thresholds for the methods - case study 2 . . . 84 5.16 VIF test results for LR - case study 2 . . . 85 5.17 LR coefficients - case study 2 . . . 85
List of Tables
5.18 Variables importance according to CART - case study 2 . . . 85 5.19 The clusters characteristics - case study 2 . . . 87 5.20 VIF Test Results for LR Stacking - case study 2 . . . 90 5.21 LR Stacking Coefficients - case study 2 . . . 90 5.22 Methods importance according to CART stacking . . . 91 5.23 Variables importance according to RF - case study 2 . . . 91 5.24 The performance of the methods - case stusy 2 . . . 92 5.25 Insured educational level frequencies . . . 93 5.26 Insured relationship status frequencies . . . 94 5.27 Statistical characteristics of the claims amounts variables . . . 96 5.28 Data partition and thresholds for the methods - case study 3 . . . 97 5.29 VIF test results for LR - case study 3 . . . 99 5.30 LR coefficients - case study 3 . . . 99 5.31 Variable importance according to CART - case study 3 . . . 100 5.32 The clusters characteristics - case stusy 3 . . . 103 5.33 VIF Test Results for LR Stacking - case study 3 . . . 106 5.34 LR Stacking Coefficients - case study 3 . . . 106 5.35 Methods importance according to CART stacking - case study 3 . . . 106 5.36 Variable importance according to RF - case study 3 . . . 108 5.37 The performance of the methods - case study 3 . . . 109 5.38 The clusters characteristics - H2O . . . 112 5.39 The performance of the methods - H2O . . . 113 5.40 Comparative table for ensemble learning methods . . . 115 B.1 New VIF test results for LR - case study 2 . . . 143 B.2 New VIF test results for LR - case study 3 . . . 145
List of Abbreviations
AANN Auto-Associative Neural Network
Adaboost Adaptive Boosting
AIS Artificial Immune System
ANN Artificial Neural Network
AUC Area Under the Curve
AUPRC Area Under the Precision-Recall Curve
BNN Bayesian Belief Network
C4.5 Decision Tree Algorithm
C5.0 Advanced version of the C4.5 Decision Tree Algorithm
CART Classification And Regression Tree
CHAID Chi-square Automatic Interaction Detector
CKNN Simple voting K-Nearest Neighbor using cosine similarity
CoS Cosine Similarity
CoSKNN Cost-Sensitive Cosine Similarity K-Nearest Neighbor
cp Complexity Parameter
CS Cost Sensitive
DCKNN Distance weighted K-Nearest Neighbor using cosine similarity DEucKNN Distance weighted K-Nearest Neighbor using euclidean distance
ESN Electronic Serial Number
EucKNN Simple voting K-Nearest Neighbor using the euclidean distance
FN False Negative
FP False Positive
FPR False Positive Rate
IT Information Technology
K-MICHA K-modes Imbalance Classification Hybrid Approach
KNN K-Nearest Neighbor
List of Abbreviations
LR Logistic Regression
MAE Mean Absolute Error
NB Naïve Bayes
NSA Negative Selection Algorithm
OCC One Class Classification
OCCoS Cosine Similarity based One Class Classification approach
PR Precision-Recall
RF Random Forest
RO Random Oversampling
ROC Receiver Operating Characteristic
SVM Support Vector Machine
TN True Negative
TP True Positive
TPR True Positive Rate
VIF Variance Inflation Factor
Glossary of Terms
Accuracy The percentage of correctly classified observations
from both classes.
Class imbalance Skewed distribution of the data where one class is dominant and present much more than the other class.
Cost Sensitive An imbalanced classification approach where
higher weights are assigned to the minority class. Ensemble Learning An approach developed by building one model
us-ing either several samples of the data or several al-gorithms.
Explanatory Variables The variables that are used as predictors for the ma-chine learning algorithms.
Fraud A criminal deception deliberately practiced by a
per-son in order to gain a financial profit illegally.
H2O An open source distributed in-memory prediction
platform for big data science.
In-memory computing The storage and process of information in the main random access memory (RAM) rather than in rela-tional databases operating on slow disk drives.
Mode The most frequently occurring value of a variable.
Negative The majority class (legitimate or non fraud cases). False Negative The number of actual positives wrongly classified
as negatives.
True Negative The number of correctly classified observations
from the majority class.
Observation Data set row.
One Class Classification An approach that uses data from one class only (usu-ally the minority class) and learns its characteristics.
Positive The minority class (fraud observations).
Glossary of Terms
False Positive The number of actual negatives wrongly classified as positives.
True Positive The number of correctly classified observations
from the minority class.
PR Curve Precision-Recall curve: A graph representing the
precision over the recall.
Precision The ratio of examples classified as positive that are truly positives.
Random Oversampling A Technique used to balance the classes by simply replicating observations as needed until balance between classes is reached.
ROC Receiver Operating Characteristic curve: A graph
representing the TPR over the FPR. Sensitivity - True Positive
Rate - Recall
The proportion of positives correctly classified as positives.
Target Variable The variable to be predicted representing the fraud. Variance Inflation Factor Multicolinearity test for explanatory variables. A VIF higher than 10 means that multicolinearity is present between the variables.
List of Publications
The following is a list of publications containing the work presented in this thesis: 1) Sara Makki, Rafiqul Haque, Yehia Taher, Zainab Assaghir, Gregory Ditzler,
Mohand-Saïd Hacid and Hassan Zeineddine, “Fraud Analysis Approaches in the Age of Big Data – A review of the State of the Art”, in proceedings of the 2nd IEEE International Workshops on Foundations and Applications of Self* Systems (FAS*): 243 - 250, 2017. 2) Sara Makki, Rafiqul Haque, Yehia Taher, Zainab Assaghir, Gregory Ditzler, Mohand-Saïd Hacid and Hassan Zeineddine, “Fraud Data Analytics Tools and Techniques in Big Data Era”, in proceedings of the International Conference on Cloud and Autonomic Computing (ICCAC): 186-187, 2017.
3) Sara Makki, Rafiqul Haque, Yehia Taher, Zainab Assaghir, Mohand-Said Hacid, Hassan Zeineddine, “A Cost-Sensitive Cosine Similarity K-Nearest Neighbor for Credit Card Fraud Detection”, in the 1s t International Conference on Big Data and Cybersecurity Intelligence (BDCSIntell): 42-47, 2018.
4) Sara Makki, Zainab Assaghir, Yehia Taher, Rafiqul Haque, Mohand-Said Hacid, Hassan Zeineddine, “An Experimental Study with Imbalanced Classification Approaches for Credit Card Fraud Detection” - IEEE Access 7, 93010-93022 2019.
5) Sara Makki, Zainab Assaghir, Yehia Taher, Rafiqul Haque, Mohand-Said Hacid, Hassan Zeineddine, “K-MICHA: K-modes Imbalance Classification Hybrid Approach for Financial Fraud Detection” - (In progress 2019).
Chapter 1
Introduction
1.1 Background . . . 1 1.2 Motivation . . . 6 1.2.1 Financial Impact of Fraud . . . 6 1.2.2 The Challenges of Fraud Detection . . . 7 1.3 Problem Description . . . 9 1.3.1 Class Imbalance Problem . . . 9 1.3.2 Selection of Performance Measures . . . 11 1.4 Research Goal & Objectives . . . 13 1.5 Contributions . . . 13 1.6 Research Scope . . . 15 1.7 Thesis Structure . . . 16
1.1
Background
Fraud is a criminal deception deliberately practiced by a person to gain a financial profit illegally. It can also occur solely to deceive another person or entity like providing false statements. Fraud is not a recent phenomenon unique to modern society. The fraudsters have been practicing fraudulent activities for more than decades[3]. Many factors can facilitate fraudulent activities such as help from bank’s employees especially to access the bank’s Information Technology (IT) systems, client’s database, and personal information. This is better known as Internal Fraud which usually occurs when internal personnel of
Introduction
an organization such as employee, manager, or executive commits fraud against his or her employer. Even if no financial profit was gained, the act of violating the privacy of the bank’s clients is considered a fraud itself. Online and mobile banking services also facilitate fraud activity, giving more opportunities to fraudsters to access critical systems. In contrast, External Fraud is committed by external third-parties. For instance, stealing proprietary information of an organization by the supplier or other stakeholders. In[4], the authors characterized the multifaceted phenomenon fraud include the follow-ing: uncommon, imperceptibly concealed, time-evolving and often carefully organized crime which appears in many types of forms. These characteristics are summarized in [3]:
• Uncommon: Independent of the exact setting or application, only a minority of the involved population of cases typically concerns fraud, of which furthermore only a limited number will be known to concern fraud. Also, the fraudsters mask fraudulent activities with the non-fraudulent ones – which is another cause of fraud being uncommon.
• Imperceptibly Concealed Behaviour: The behavior of fraudsters is not distinguishable from the others. They keep the behavior normal to go unnoticed and to remain covered by non-fraudsters. This effectively makes fraud imperceptibly concealed, since fraudsters do succeed in hiding by well considering and planning how to precisely commit fraud.
• Time Evolving: The fraudsters continuously change their method because their ob-jective is to remain undetected as much as possible. This means the techniques and tricks the fraudsters use evolve in time along with or better ahead of fraud detection mechanisms.
• Organized and barely isolated: The fraudsters organize fraudulent activities very carefully like other organized crimes. Very often they do not operate independently rather they associate with the others. Some forms of fraud involve complex structures that are set up to commit fraud in an organized manner. This makes fraud not to be an isolated event.
These characteristics foster an enormous challenge to the industries mainly the financial industry to detect fraudulent activities such as fraudulent transactions made through a credit card or a check. Furthermore, Fraudulent activities differ depending on sectors, methods, severity, complexity, and difficulty of detection or prevention. As previously mentioned, fraud is not limited to attacks on banks. In some cases, banks or finan-cial institutions are the fraudsters themselves like in finanfinan-cial statements fraud cases,
1.1 Background
or sometimes in money laundering cases. Insurance companies, telecommunication companies, or investors are sometimes victims of fraud. There is an exhaustive list of frauds described in a large body of literature such as[5] and [6]. Table 1.1 summarizes a non-exhaustive and refined list depicting different types of frauds.
Table 1.1 Different types of fraud
Fraud Type Description
Credit Card Fraud It is defined as unauthorized use of a credit card account. It occurs when the cardholder and the card issuer are not aware that the card is being used by a third party. Therefore, fraudsters can obtain goods without paying, or gain illegal access to funds from an account[7].
Insurance Fraud It can be described as an attempt to misuse or take advan-tage of an insurance policy. Insurance is made to cover losses and to protect against risks. Fraud occurs when the insured use the insurance contract as a tool to gain illegal profit[8].
Money Laundering Money laundering is the scheme in which criminals try to disguise the source, and destination of money gained through illegal activities, intending to make it seem legiti-mate[9].
Telecommunication Fraud
In the telecommunication area, fraud is characterized by the abuse of any carrier services without the intention of paying. There could be other motivations like political or personal motivations, etc.
Financial Statement Fraud
Financial statement fraud is also known as accounting fraud is defined as intentional misstatements of financial statements to mislead the reader especially investors and creditors to create a false impression of an organization’s financial strength[10].
Securities fraud It is also known as financial markets fraud or investment fraud refers to deceptive practices in connection with the offer and sale of securities [11]. High yield investment fraud is a very common type of securities fraud. Very known examples are Pyramid schemes, Ponzi schemes, affinity fraud, etc.
Introduction
In addition to the above, there are many other types of fraud including counterfeit, product warranty fraud, click fraud, identify theft, tax evasion, etc. Each of these fraud types has distinctive characteristics and consequence which is usually catastrophic. Therefore, fraud detection and fraud prevention are the most critical components of an effective strategy of fighting against fraudsters. Fraud detection refers to the ability to recognize or discover fraudulent activities, whereas fraud prevention refers to measures that can be taken to avoid or reduce fraud[12].
Expert-Based Fraud Detection
The most widely used approach for detecting fraud is called Expert-based Approach. It is a classical approach built on the experience, intuition, and business or domain knowledge of the fraud analyst[3]. An expert-based approach typically involves a manual investigation of a suspicious case, which may have been signaled, for instance, by a customer complaining of being charged for transactions he did not do. Such a disputed transaction may indicate a new fraud mechanism to have been discovered or developed by fraudsters, and therefore requires a detailed investigation for the organization to understand and subsequently address the new mechanism[12].
Data-driven Fraud Detection
Over the last ten years, the world has experienced an unprecedented growth of data. More than 2.5 exabytes data are generated every day which will accumulate to 175 Zettabyte data by 2025[13]. According to IBM, 90% of the data in the world today has been created in the last eight years[14]. These data stem from everywhere: sensors, social media sites, digital images and videos, and purchase transactions, cell phones, GPS signals to name a few. These data have been characterized into the following: massive-scale, fast-moving, and diverse which are better known as volume, velocity, and variety respectively. These characteristics have given the rise to the notion of Big Data and data-driven applications especially the analytics which leverages the profound power of data to extract intelligence and make a better decision with high precision. Although classic expert-based fraud-detection approaches are still in widespread use and represent a good starting point and complementary tool for an organization to develop an effective fraud detection and prevention system, a shift is taking place toward data-driven fraud analytics[3]. Today, data-driven analytics is the de facto solutions for all data-intensive industries including banking. The banking industry is exploring the opportunities and challenges of different types of analytics including Fraud Analytics
1.1 Background
that is empowered by extremely scalable and high-performance advanced Big Data technologies.
Fraud analytics has become the emerging tool of the twenty-first century for detecting anomalies, red flags, and patterns within voluminous amounts of data that is sometimes quite challenging to analyze[15]. The techniques of criminals and fraudsters and their shenanigans are savvier due to technology and the means they use to hide fraudulent activities [12]. While the extreme digital transformation has opened a multitude of interfaces that have increased the opportunities to commit fraud, at the same time it is also playing a key role in developing new methods to detect and prevent fraud[15]. In the past, the spreadsheet was the master of fraud analytics. However, data-driven fraud analytics has taken the industry by force—new strategies, machine learning and statistical techniques, and powerful Big Data tools.
The data-driven fraud analytics is a highly promising approach for three apparent reasons explained[3]. These reasons are summarized in the following:
• Precision: Most organizations only have a limited capacity to have fraud cases checked by an auditor to confirm whether or not a case effectively concerns fraud. This human-driven approach is risk-prone. In contrast, good quality data is vital to increase the precision and accuracy of an analysis. The goal of data-driven fraud analytics is to make the most optimal use of the limited available inspection capacity, or in other words to maximize the fraction of fraudulent cases among the inspected cases (and possibly, besides, the detected amount of fraud)[3]. A system with higher precision, that is potential to be delivered by data-based methodologies, directly translates in a higher fraction of fraudulent inspected cases.
• Operational Efficiency: Data-driven fraud analytics are built using advanced tech-niques from various domains including machine learning, statistics, mathematics, deep learning. Also, advanced tools such as in-memory analytics engine are used to implement the analytic techniques. This significantly increases operational efficiency which is critically important for many fraud scenarios. For instance, when evaluating a transaction with a credit card, an almost immediate decision is required concerning approve or block the transaction because of suspicion of fraud. This needs real-time analysis and decision making - which can be done with data-driven fraud analytics tools and technologies.
• Cost Efficiency: Developing and maintaining an effective and lean expert-based fraud-detection system is both challenging and labor-intensive. A more automated and, as
Introduction
such, a more efficient approach to develop and maintain a fraud-detection system, as offered by data-driven methodologies, is a more cost-effective approach.
In light of the above discussion, it is evident that data-driven fraud analytics have several benefits over the traditional expert-based approach for fraud detection. However, various challenges in data-driven approaches must be tackled to strengthen the fraud detection system to fight against fraudsters. This research focuses on the extremely critical class imbalance problem data-driven fraud analytics.
1.2
Motivation
Different facets are the driving factors of this research. The financial impact of fraudulent activities is mostly catastrophic. A large number of organizations and individuals are victimized by fraudsters every day. Unfortunately, this trend is increasing every year. This, by extension, has a socio-cultural impact. Therefore, the financial impact of fraudulent activities is the key factor that drove this research initiative. Moreover, there are several challenges remained unsolved for building efficient fraud analytics. These challenges are critical barriers that must be solved to fight against the fraudsters. This is the other important factor that motivated this research.
This section describes the financial impact and challenges in detail to provide a com-prehensive view of the significance of this research in the real world and the domain of science.
1.2.1
Financial Impact of Fraud
Fraudulent activities have disastrous financial consequences. They are costing the banking industry around 67 billion dollars per year, as estimated by the association of certified fraud examiners in 2014[16]. In reality, it can also be higher because many cases were not referred to the external authorities and solved internally to avoid bad publicity [16]. According to the 2019 Identity Fraud Study from Javelin Strategy & Research, in the United States of America, the number of consumers who were victims of identity fraud fell to 14.4 million in 2018, down from a record high of 16.7 million in 2017. However, identity fraud victims in 2018 bore a heavier financial burden: 3.3 million people were responsible for some of the liability of the fraud committed against them, nearly three times as many as in 2016. Moreover, these victims’ out-of-pocket fraud costs more than doubled from 2016 to 2018 to 1.7 billion Dollars [17]. In the United Kingdom, unauthorized financial fraud losses across payment cards, remote banking, and cheques
1.2 Motivation
totaled £844.8 million in 2018, an increase of 16 percent compared to 2017; In addition to this, in 2018 UK Finance members reported 84,624 incidents of authorized push payment scams with gross losses of £354.3 million[18].
Furthermore, Fraudulent activities are increasing every day. A global survey was con-ducted by KPMG in 2018. The survey of KPMG found that 61 percent of respondents indicated that the total volume of external fraud had increased and 59 percent said the value had increased[1]. It was also found that the trend of most of the fraud types is increasing. Figure 1.1 shows the trend of different types of fraud in different geographical locations.
Fig. 1.1 The global trend of different types of frauds (Source[1])
Based on the above discussion, it is evident that current fraud detection systems have shortcomings which are allowing the fraudsters to continue their criminal acts. Also, these activities must be stopped or reduced to diminish the impact of fraud - which needs an efficient solution.
1.2.2
The Challenges of Fraud Detection
Although fraud-detection approaches have gained significant power over the past years by adopting potent statistically-based methodologies and by analyzing massive amounts of data to discover fraud patterns and mechanisms, still fraud remains enormously challenging to detect[3].
Introduction
Researchers applied different methods and algorithms to detect fraud in financial or telecommunication sectors, or money laundering operations. However, we identified a few issues that make fraud detection more challenging and difficult. In the following, we briefly describe these issues.
• Dynamic patterns of fraud are highly challenging specifically for the systems that rely on supervised learning models. These systems can only detect fraud patterns based on the training data set that consists of patterns occurred in the past. However, the fraudsters never stop producing new fraudulent ways and strategies to overpower the systems. Such variation of fraudulent activities cannot be dealt with with the supervised learning-based system since the training data sets do not contain the new fraud patterns. This is frequently referred to learn new classes in machine learning [19].
• Real-time fraud detection is an ideal solution for financial institutes, because, real-time systems may save huge financial loss. However, detecting fraudulent activities in real-time fosters different challenges to the system. The three main challenges which we identified in our study include the followings: (i) the speed at which data flows today is difficult to process and analyze, (ii) the computational complexity of fraud analytics is huge, and (iii) building a high-performance algorithm for data-intensive applications is non-trivial.
• Integrating large volume data with variety introduces a huge challenge. One of the critical advantages of Big Data is that it enables the users to collect data from a wide variety of sources including financial sources and other resources such as hospital records, financial markets activities, messages between brokers, etc. These sources constitute a huge volume of data sets containing many attributes and records. Furthermore, these sources rely on different data models; consequently, data arriving from a variety of sources fosters integration challenges for the fraud analysis system. • Skewed class distribution is one of the most crucial issues in fraud detection. Typi-cally, the ratio of fraud : legitimate is very small in the data which are used to train the models[8]. These proportions are very challenging because they do not allow the learners to understand the dynamics of minority groups (fraud). This problem is more vulnerable to the classification algorithms that are implemented within a Big Data framework. Since Big Data technologies such as Hadoop breaks data into (chunks), the small portion of data in the samples becomes much smaller. Consequently, the characteristics of the minority class become harder to detect, the classification be-comes more difficult, and in fact, the information is lost whereas the goal is to extract the maximum value from large-scale data.
1.3 Problem Description
• Performance measure is another challenge that is caused by skewed data distribu-tion. The accuracy rate (correctly classified observations) is the one used for a typical classification problem. This measure may not be always appropriate for fraud detec-tion[20]. For example, if the data contains 1% fraud observations, an accuracy rate below 99% is unacceptable. The reason is straightforward: the system can classify all records as legitimate and still give an accuracy rate of 99%. This leads to consider cost-sensitive performance measures that take into account the wrongly classified observations, without raising many false alarms, that would waste a huge amount of time and resources to be investigated. Such statistics, that are recommended to be considered in fraud detection analysis, including accuracy, F-score, sensitiv-ity, Area Under the Curve (AUC), and Matthew’s correlation coefficient. Moreover, Computational costs must also be considered.
The challenges explained in the above motivate to initiate this research project, as the problem lies in the heart of real-world scenarios, yet there are challenges that to be fixed.
1.3
Problem Description
Fraud is a longstanding problem for the industries. A broad spectrum of solutions are available however nothing could stop fraudulent activities and fraudsters. It is essentially a loop of actions between fraudsters and fraud detection experts. Fraudsters never stop developing new methods to commit fraud and the experts aim to detect every possible method for fraudulent activities. There are several challenging issues — that I identified through literature – discussed in the previous section. Based on my study, I believe that the issues previously mentioned must be solved to develop effective and efficient fraud detection systems.
Fraud analysis is of critical importance to the banking sector – as well as many others – since fraudulent activities are becoming a more frequent occurrence that leads to a disastrous impact on the organizations, society, and individuals. In our work, we focused on the skewed data distribution also known as class imbalance problem.
1.3.1
Class Imbalance Problem
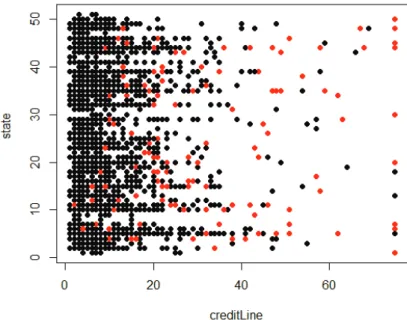
The class imbalance problem is one of the most critical challenges of all. This problem is defined as having an extremely imbalanced and highly skewed distribution of the data [21]. In other words, the ratio of fraudulent or criminal activities is considerably smaller than the legitimate and genuine ones. Figure 1.2 illustrates a class imbalance problem
Introduction
found in one of our experiments where the imbalance ratio is 5.96%. Figure 1.2 shows an imbalance situation in our data set according to two features. The red dots in the figure represent the fraud cases that have a much lower frequency than the other cases.
Fig. 1.2 An example of class imbalance situation
Class imbalance promotes a huge challenge in detecting the characteristics of fraudu-lent activities and extracting fraud patterns. Due to the dominance of one class, most of the optimization steps (concerning accuracy) performed by the classification algo-rithm, aim to correctly classify the dominant class while ignoring the others. These minority observations like the fraud observations are the most critical to be classified correctly. If the classification algorithm is unable to detect fraud patterns, the illegal transactions are considered as legal, thus causing severe financial damage to individuals and organizations.
Many research studies have been dedicated to the imbalanced classification problem. Several solutions have been proposed in the literature (e.g.,[22–24]) which, to the best of our knowledge, are built on machine learning and data mining algorithms. However, class imbalance remained an unsolved issue[25, 26]. An experimental study that we conducted[27], revealed that the approaches normally used to solve imbalance prob-lems may have unpleasant consequences. These approaches improve sensitivity yet the improvement leads to an increase in the number of false alarm. The problem is summarized as follows: using imbalanced classification approaches, the number of false alarms generated is higher than the number of frauds that are more detected. The
1.3 Problem Description
results of this experimental study greatly motivated us to explore the other methods that focus on detecting the hidden patterns of fraud, with a minimum misclassification rate.
1.3.2
Selection of Performance Measures
Typically, accuracy is the most common performance measure in a classification prob-lem. However, in our case accuracy is not adequate because we are tackling imbalanced classification and using it alone as a measure of performance is misleading.
The fraud percentage in our case studies range between 5% and 12% of total cases. This means that a classification’s accuracy rate less than 95% or 88% respectively is not acceptable, simply because a random classifier is capable of achieving high accuracy in an imbalance classification case. Fraud detection may not be achievable by gaining a high accuracy rate. Therefore, we will consider other performance measures, specifically the sensitivity, Area Under the Precision-Recall Curve (AURPC) and the F1score. We
provide details of our selection process.
To evaluate the methods presented in this thesis, confusion in the matrix of the form presented in Table 1.2 is calculated using test sets by comparing the prediction of the method with the actual value.
Table 1.2 Form of confusion matrix
Predicted Actual
Legitimate (0) Fraud (1)
Legitimate (0) True Negative (TN) False Negative (FN)
Fraud (1) False Positive (FP) True Positive (TP)
– TN: represents the number of correctly classified observations from the majority class. – TP: represents the number of correctly classified observations from the minority class. – FN: represents the number of actual positives wrongly classified as negatives.
– FP: represents the number of actual negatives wrongly classified as positives.
The accuracy rate represents the percentage of correctly classified observations from both classes:
Accuracy in percentage= T P+T N
T N+F N +T P +F P ×100
Introduction
According to this formula presented above, we remark that in the case of imbalance, the accuracy is biased towards the majority group, specifically the TN.
The sensitivity which is also known as True Positive Rate (TPR) and recall, represents the proportion of positives correctly classified as positives. This parameter is critically important and will be considered as a performance measure along with accuracy. This is defined as follows:
Sensitivity= T P T P+F N
Note that, considering the sensitivity alone is also misleading, it allows to ignore a large number of false positives. We aim to find a balance between those two parameters. We need to obtain a high fraud detection rate (sensitivity), with the highest possible accuracy. To handle this issue, we consider “trade-off” measures like the AUPRC and the F1score.
In a typical classification problem, the Receiver Operating Characteristic (ROC) curve is commonly used as a performance measure. It is essentially a graph that presents the diagnostic ability of a binary classifier system as its discrimination threshold is varing1. It is created by plotting the TPR over the False Positive Rate (FPR). However, in imbalanced classification, this curve can mask poor performance. To the best of our understanding, the Precision-Recall (PR) curve is relatively a better measure because it is more sensitive to the class imbalance than the ROC curve[20]. This curve is defined by plotting precision rate over the recall rate. The use of precision instead of FPR which is used in ROC curve allows capturing the effect of large negative observations on the algorithm’s performance. The precision represents the ratio of examples classified as positive that are true positives. These two measures are defined as:
Precision= T P
T P+F P and F P R=
F P T N+F P
In the PR curve, the quality of the model is determined by the proximity of the curve to the upper-right-hand corner. The closer the curve is to the upper-right-hand corner the better the model is. This can be measured with the AUPRC. Moreover, it is not always straightforward to find the class probabilities, so we will also use sometimes the F1score.
The higher this score is better. F1score is defined as follows:
F1score = 2×
Precision×Recall Precision+Recall 1http://www.ashukumar27.io/roc-auc/
1.4 Research Goal & Objectives
It is worth noting that each of these performance measures is interpreted differently. Also, each of these measures cannot be used alone to confirm the competitive quality of the methods.
1.4
Research Goal & Objectives
Practically speaking, eliminating fraud wholly might not possible by using technologies because there are issues (e.g., cross-border access to the financial system) that could not be dealt with technology; these issues need strategic and political directives. In this thesis, we aim to tackle the technological aspect.
In fraud analysis, efficiency remains an important issue that should be focused on to achieve a high fraud detection rate. Efficiency guarantees the performance of the fraud detection models, even an increase of 1% accuracy rate is crucial because it will have a huge impact in detecting fraudulent activities and fraudsters.
The goal of this thesis is to design and develop a fraud analytics framework that deals with the most critical yet unsolved class imbalance problem to enhance the efficiency of the fraud analytics systems.
This goal is decomposed into three objectives that are listed in the following:
• Objective 1: Design and develop a solution that enables to analyze fraud labeled data set collected from banks and financial institutions from different sectors.
• Objective 2: Design and develop a solution that enables to explore the hidden patterns of fraud by learning from fraud examples, using supervised cost sensitive machine learning algorithms.
• Objective 3: Design and develop a solution that enables to find a trade-off between the accuracy and sensitivity of the model. In other words, achieving the highest fraud detection rate with minimal false alarms.
1.5
Contributions
There are different contributions made in this thesis– are categorized into primary and secondary contribution. We present these contributions in this section.
Introduction
Primary Contributions
In this thesis developed two approaches: a Cost-Sensitive Cosine Similarity K-Nearest Neighbor (CoSKNN) as a single classifier, and a K-modes Imbalance Classification Hybrid Approach (K-MICHA) as an ensemble learning methodology. Our contributions can be summarized as follows:
– CoSKNN: Cost-Sensitive Cosine Similarity K-Nearest Neighbor:
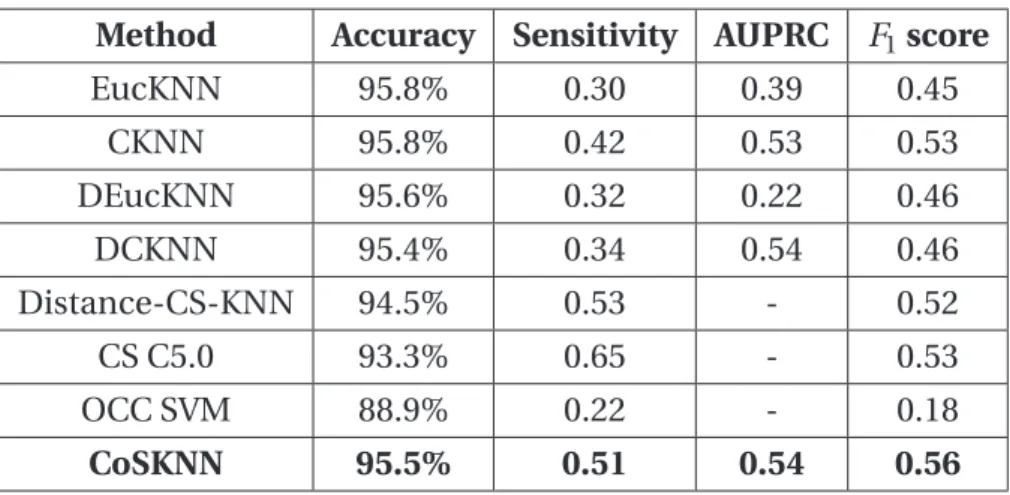
We introduced a Cost-Sensitive KNN approach detailed in Chapter 3. We aimed to tackle the imbalance problem by using cosine similarity as a distance metric and by introducing a score for the classification. To improve the method’s performance in terms of imbalance, we also studied the choice of the score’s thresholds and the number of neighbors to consider. We conducted a validation experiment where we compare the performance of simple voting KNN using both euclidean distance and cosine similarity, a distance weighted KNN also using both euclidean distance and cosine similarity, a cost-sensitive KNN approach that was introduced by Qin et al. [28], a decision tree approach, a one-class classification Support Vector Ma-chine (SVM) and CoSKNN. The comparison was done by applying these methods to an example of credit card fraud data set with imbalance, using multiple perfor-mance measures, mostly relying on AUPRC and F1 score. This experiment shows
that CoSKNN is outperforming all the other methods. (See Chapter 3 for more details.) – K-MICHA: K-modes Imbalance Classification Hybrid Approach:
We introduced a hybrid diversification approach using the k-modes clustering algo-rithm detailed in Chapter 4. We also applied it to (1) a credit card, (2) mobile payment and (3) auto insurance fraud data sets that we present in Chapter 5. K-MICHA aims to cluster similar data points in terms of the outputs of the classifiers. Then, calculating the fraud probabilities in the obtained clusters to use them for detecting frauds of new transactions. For case study 1, the credit card fraud detection, we combined Logistic Regression (LR), Artificial Neural Network (ANN), a cosine similarity cost-sensitive K-nearest neighbor approach (CosKNN) that we developed and a one-class classification approach also using cosine similarity (OCCoS). For case study 2, the mobile payment transactions fraud data set, we combined the two approaches based on cosine similarity previously mentioned OCCoS and CoSKNN with LR, decision tree (CART) and Naïve Bayes classifier (NB). In case study 3, the auto insurance fraud case, we combined five algorithms, CosKNN, LR, CART, NB, and ANN. In all three case studies, we compare K-MICHA with stacking using voting, weighted voting, logistic
1.6 Research Scope
regression, and CART. We also compared it with Adaboost and random forest. Even though the last two algorithms only use one classifier and they do not consist of combining multiple algorithms, we are interested in comparing their performance with our combination approach. In the end, based on the experiments, we prove the efficiency of K-MICHA.
Secondary Contributions
In addition to the main contributions discussed in the above, I conducted an experi-mental study and a survey of literature concerning fraud detecting solution. These are essentially strongly connected (or related) with the primary contribution. The studies are briefly explained below:
• Survey: A rigorous survey of the literature was conducted mainly to identify the strength and shortcomings of existing solutions. The survey covered all classical and advanced approaches such as data-driven approaches and produced a comprehen-sive report on fraud analytics approaches. A paper of this survey was published in 2017. Chapter 2 presents the results of the survey.
• Experimental Study: The literature review was not sufficient to verify the efficiency of the existing technologies. Hence, an experimental study was conducted with the key technologies including support vector machine (SVM), C5.0, Artificial Neural Network (ANN) that are widely used in today’s advanced fraud detection system. This experimental study was very effective in understanding the genuine weaknesses of existing solutions concerning class imbalance issues. The results of this experimental study were included in an article published in 2019. This experimental study is presented in Chapter 2.
1.6
Research Scope
The primary scope of this research is three-fold: data processing and predictive analytic, and data visualization. These scopes are briefly presented in the following.
• Data processing: Data processing is a common task and the most critical tasks in any type of data analytics. Data processing techniques are applied to produce a high-quality dataset that is vital to extract meaningful intelligence from data. This research focuses on techniques for fraud data cleaning, pre-processing, outliers detection, and oversampling or undersampling. The objective was to explore the existing techniques and identify the best-suited ones for financial data processing.
Introduction
• Data Analysis: This is the main focus of this thesis. The main target was to discover, design, and develop a solution for prediction and classification of observations. The machine learning algorithms were heavily investigated, and used to achieve the goal of this thesis.
• Data Visualization: Data visualization has two facets: (i) data are visualized during the descriptive or exploratory study to have a comprehensive visual representation and a better understanding of data. Also, the final results are visualized, specifically in the combination algorithm K-MICHA to relate to the original datasets used to interpret the results. In this research, I explored the visualization patterns and used the most suitable ones to visualize the data and results.
Anything outside of the above scope (yet concerns fraud analytics) has not been covered in this thesis. Some technologies, for instance, data storage technologies are used in this thesis; however, such technologies are considered outside of the scope of this research because there was no contribution concerning the storage. Neither scalability nor performance of the storage were investigated. Furthermore, anything related to data security is outside of the scope of this research.
1.7
Thesis Structure
This thesis consists of five chapters apart from the introductory Chapter 1, where we describe the general context of financial fraud and our research problem, the class imbalance.
In Chapter 2, we present studies that were conducted for financial fraud detection. We list them according to the different financial sectors (credit card, telecommunication, money laundering, etc.), and different technologies or strategies like real-time detection, big data analytics and ensemble learning. In this Chapter, we also present an experimental study [27], where we investigate the exciting solutions of class imbalance, and we investigate their limitations.
Chapter 3 presents our first contribution, the Cost Sensitive Cosine Similarity K-Nearest Neighbor approach (CoSKNN) as a single classifier. We provide the approach theory, along with the different steps of the model. Moreover, we discuss the results of the validation experiment we conducted to prove the model’s efficiency.
In Chapter 4, we introduce K-MICHA, a hybrid approach that we develop using k-modes clustering algorithm with the aim to evaluate fraud probabilities. This approach is an ensemble learning technique based on clustering similar data points in terms of the
1.7 Thesis Structure
classifiers outputs, then calculating fraud probabilities in each cluster. Different exam-ples of ensemble learning are presented in this chapter, along with the implementation of K-MICHA.
In Chapter 5, we present the results of the application of K-MICHA in the financial sector. Three case studies concerning credit card fraud, mobile payment fraud and insurance fraud are used. The purpose of these studies is to prove the efficiency of K-MICHA by comparing it to other single classifiers and to other ensemble learning methods. We also provide the results of the implementation of K-MICHA in H2O and R in this chapter. Finally, we provide a conclusion for the work done in this thesis, and gives perspectives for further research and work.
Chapter 2
Literature Review
2.1 Introduction . . . 19 2.2 Fraud Detection Technologies . . . 20 2.2.1 Credit Card Fraud Analysis Approaches . . . 20 2.2.2 Telecommunication Fraud Analysis Approaches . . . 22 2.2.3 Financial Statements Fraud Analysis Approaches . . . 23 2.2.4 Securities Fraud Detection Approaches . . . 24 2.2.5 Insurance Fraud Analysis Approaches . . . 24 2.2.6 Anti-Money Laundering Systems . . . 25 2.2.7 Computer Intrusion Detection Systems . . . 26 2.2.8 Data Driven Fraud Detection Approaches . . . 27 2.2.9 Real-Time Fraud Detection Systems . . . 29 2.2.10 Ensemble Learning Approaches for Fraud Detection . . . 30 2.3 A Comparative Study . . . 32 2.3.1 Design of Experiment . . . 32 2.3.2 Results and Discussion . . . 33 2.4 Shortcomings of Existing Methods . . . 40
2.1
Introduction
The automated fraud detection systems have gained enormous popularity especially within financial institutions. These systems analyse complex events or actions over