RESEARCH OUTPUTS / RÉSULTATS DE RECHERCHE
Author(s) - Auteur(s) :
Publication date - Date de publication :
Permanent link - Permalien :
Rights / License - Licence de droit d’auteur :
Bibliothèque Universitaire Moretus Plantin
Dépôt Institutionnel - Portail de la Recherche
researchportal.unamur.be
University of Namur
The importance of phospholipids combined with long-chain PUFA in formulated diets
for pikeperch (Sander lucioperca) larvae
Lund, Ivar; El Kertaoui, Najlae; Izquierdo, Marisol S.; Dominguez, David; Hansen, Benni W.;
Kestemont, Patrick
Published in:
British Journal of Nutrition
DOI:
10.1017/S0007114518001794
Publication date:
2018
Document Version
Publisher's PDF, also known as Version of record
Link to publication
Citation for pulished version (HARVARD):
Lund, I, El Kertaoui, N, Izquierdo, MS, Dominguez, D, Hansen, BW & Kestemont, P 2018, 'The importance of
phospholipids combined with long-chain PUFA in formulated diets for pikeperch (Sander lucioperca) larvae',
British Journal of Nutrition, vol. 120, no. 6, pp. 628-644. https://doi.org/10.1017/S0007114518001794
General rights
Copyright and moral rights for the publications made accessible in the public portal are retained by the authors and/or other copyright owners and it is a condition of accessing publications that users recognise and abide by the legal requirements associated with these rights. • Users may download and print one copy of any publication from the public portal for the purpose of private study or research. • You may not further distribute the material or use it for any profit-making activity or commercial gain
• You may freely distribute the URL identifying the publication in the public portal ?
Take down policy
If you believe that this document breaches copyright please contact us providing details, and we will remove access to the work immediately and investigate your claim.
The importance of phospholipids combined with long-chain PUFA
in formulated diets for pikeperch (Sander lucioperca) larvae
Ivar Lund
1*†, Najlae El Kertaoui
2† Marisol S. Izquierdo
3, David Dominguez
3, Benni W. Hansen
4and
Patrick Kestemont
21
Technical University of Denmark, DTU Aqua, Section for Aquaculture, The North Sea Research Centre, PO Box 101, DK-9850 Hirtshals, Denmark
2Research Unit in Environmental and Evolutionary Biology, University of Namur, Rue de Bruxelles, 61-5000 Namur, Belgium 3Grupo de Investigación en Acuicultura (GIA), Instituto Universitario Ecoaqua, Universidad de Las Palmas de Gran Canaria, Crta. Taliarte s/n, 35214 Telde, Spain
4Department for Science and Environment, Roskilde University, 4000 Roskilde, Denmark
(Submitted 15 December 2017– Final revision received 31 May 2018 – Accepted 1 June 2018 – First published online 30 July 2018)
Abstract
Dietary phosphoglycerides and n-3 long-chain PUFA (LC-PUFA) play important functions in the development of pikeperch (Sander lucioperca) larvae. This study aimed to determine optimal dietary levels of soyabean lecithin (SBL)-derived phospholipids (PL) in starter feeds for pikeperch larvae 10–30 d post-hatch (DPH) and examine performance and ontogeny by additional supplementation of n-3 LC-PUFA in the form of Algatrium DHA 70 (glyceride product; 660–700 mg/g DHA; EPA 60–75 mg/g). In total, six isoproteic and isoenergetic extruded diets were formulated with increasing levels of PL (3·7, 8·3 or 14·5 % wet weight (w.w.), respectively); however, three of the diets were supplemented with three levels of Algatrium DHA 70 (0·6, 2·0 or 3·4 %, respectively). Liver proteomic analyses of larvae at 30 DPH were included for effects of PL and primarily DHA on performance, physiological expression and interactions in larval proteins. In addition, bone anomalies, digestive enzymatic activity, candidate gene expression and skeleton morphogenesis were examined. Results confirmed the importance of dietary PL levels of at least 8·2 % w.w., and an additional beneficiary effect of supplementation with DHA plus EPA. Thus, combined supplementation of SBL (up to 14·51 % w.w. PL) and n-3 LC-PUFA (1·004 % DM DHA and 0·169 % DM EPA) in the form of TAG resulted in highest growth and lowest incidence of anomalies, improved digestive enzyme activity and had differential effect on liver proteomics. The results denote that essential fatty acids can be supplemented as TAG to have beneficial effects in pikeperch larvae development.
Key words:Sander lucioperca: Phospholipids: Long-chain PUFA: DHA: Performance: Proteomic expression: Abnormalities
Pikeperch (Sander lucioperca) is a freshwater species of high commercial interest in aquaculture with an increasing produc-tion in intensive recirculaproduc-tion systems(1). Tailored commercial starter feeds have yet to be formulated for this species and among challenges in larval rearing are specific dietary fatty acid (FA) requirements during early ontogenetic development. Thus, dietary n-3 long-chain PUFA (LC-PUFA), such as EPA (20 : 5n-3) and DHA (22 : 6n-3), play critical roles in perfor-mance, neurological development and stress resilience of pikeperch larvae and fry; dietary DHA deficiency provokes shock syndromes and large mortalities(2–4). Although other percid fishes, such as the close relative walleye (Sander vitreus), seem to have a comparative lower LC-PUFA require-ment(5) and Eurasian perch larvae (Perca fluviatilis) possess
some capability to elongate and desaturate 18-C n-3 PUFA to EPA and DHA(6), recent research has indicated no such ability in pikeperch larvae and the necessity of a dietary supple-mentation of DHA. Hence, recent in vivo (1-C14) FA incubation studies in pikeperch larvae with the use of labelled 18 : 3n-3 and EPA concluded that most of the n-3 elongation/desaturation products are consistent with the elongation of very long-chain FA, directly producing, respectively, 20 : 3n-3 from 18 : 3n-3 and 22 : 5n-3 and 24 : 5n-3 from EPA (R Covadonga, unpublished results). An observedΔ6 desaturase enzyme activity was also consistent with a significant production of 18 : 4n-3 from 18 : 3n-3; however, no further or any desaturation activity over EPA was evident, precluding the expression ofΔ5 or even Δ4 desaturases in the larvae.
Abbreviations: DPH, days post-hatch; ER, endoplasmic reticulum; FA, fatty acids; Grp94, glucose-regulated 94; LC-PUFA, long-chain PUFA; PC, phosphatidylcholine; PDI, protein disulphide-isomerase; PI, phosphatidylinositol; PL, phospholipids; SBL, soyabean lecithin; SCP2, sterol carrier protein 2. * Corresponding author: I. Lund, email [email protected]
† These authors contributed equally to this work.
© The Authors 2018
https://www.cambridge.org/core
. FUNDP-BUMP
, on
21 Oct 2019 at 08:44:34
, subject to the Cambridge Core terms of use, available at
https://www.cambridge.org/core/terms
.
The essentiality of phosphoglycerides (phospholipids (PL)) has been demonstrated since decades, exerting beneficial effects on growth, survival, stress resistance, enzymatic activity and performance offish larvae or fry in a variety of marine and freshwater species(7–17). Also in pikeperch, an increase in dietary PL improves growth and intestinal brush border mem-brane enzymatic activity, modulating expression of selected genes in liver(2,18). The optimal dietary PL levels for this species has been suggested to be at least 9·5 % DW(2)
, which is in the range of those reported in experimental trials for other fresh-water and marine carnivorous species (5–12 % of dietary lipids)(12,16,19). Dietary inclusion of PL is typically in the form of soyabean lecithin (SBL)(20,21), but marine lecithins(22) and, occasionally, egg yolk have also been used(23). Consequently, the content and proportion of lipid classes and LC-PUFA may vary(16,24,25) and affect the optimal inclusion in the diet for a given species(19,23,26,27). SBL contains typically 65–75 % PL(28), with about 20–25 % each of the major phos-phoglycerides: phosphatidylcholine (PC), phoshatidylethano-lamine and phosphatidylinositol (PI). These are formed by
L-glycerol with two FA esterified on positions 1 and 2, the
second one typically with an unsaturated FA(16). SBL contains no LC-PUFA but up to 50–55 % of 18 : 2n-6, and 4 % of 18 : 3n-3, together with 8–11 % each of 16 : 0, 16 : 1 and 18 : 1, depending on the commercial product(29).
Despite a general consensus about the positive influence of either dietary n-3 LC-PUFA or PL during pikeperch larval ontogeny, the optimal supplemented levels and the combined effects of dietary PL and n-3 LC-PUFA during exogenous feeding are still controversial. Thus, growth improvement of pikeperch larvae has been related to the positive effect of dietary levels of PL independently of LC-PUFA levels(2,30). This observation is in agreement with studies on larvae of the freshwater carp (Cyprinus carpio) and the amphidromous ayu (Plecoglossus altivelis) where SBL, despite lacking n-3 LC-PUFA, were as effective or even more effective than marine lecithins rich in n-3 LC-PUFA(10,31). In other studies, conducted with marinefish larvae, PL were superior to neutral lipids (NL) as a source of EFA(24), and fish larvae reared on PL rich in n-3 LC-PUFA showed further enhanced growth, digestion and absorption, as well as an increased lipid transport and uptake into larval membranes(11,27,32). The provision of n-3 LC-PUFA, as preformed intact PL (i.e. wild live preys such as copepods, marine lecithin and so on) or as NL or TAG (i.e. enriched cul-tured live preys such as rotifers, microdiets and so on), is probably a plausible explanation for the higher efficiency of the former in sustaining growth, survival and skeletal and ontoge-netic development(19,32–37). Ingested LC-PUFA are hydrolysed and emulsified in bile salts and passively transported over the enterocytes as monoacylglycerol (MAG) or free fatty acid and re-esterified or re-acylated to TAG or PL mainly on the sn-2 position. Although PL can be effectively synthesised by the enterocyte mainly by the glycerol-3-phosphate pathway, as well as by the MAG pathway, the efficiency of these pathways can be markedly impaired by dietary lipids(38). Moreover,fish larvae have a poor development of enterocytes, and this may further reduce the ability to synthesise PL de novo(39)and a low PL:TAG ratio is found to accumulate lipid droplets in the enterocytes(37)
by inhibiting the assembly of lipoprotein particles (chylomi-crons and VLDL) or transport mechanisms out of the entero cytes and consequently cause TAG to accumulate in the intestinal epithelium(20,36,40).
In the present study, we hypothesise that an increase in dietary PL in the presence of supplemented DHA (as TAG) may increase both the de novo PL synthesis and the incorporation of LC-PUFA (especially DHA) into the tissue molecules of both TAG and PL for optimal development and performance of pikeperch larvae during early larval development. Thus, the main objective was to determine optimal levels of SBL-derived PL in formulated extru-ded starter feeds and the additional effects of n-3 LC-PUFA TAG on performance and development of larval pikeperch. As an increased dietary PL may reduce bone malformations(27,31,41)and liver proteomic studies can help to understandfish metabolism responses to dietary changes(42,43), to better understand the physiological mechanisms implied in the effect of PL and n-3 LC-PUFA on larval performance, studies on hepatic proteomics, expression of lipid metabolism related genes, digestive enzymes activity and skeleton morphogenesis were also conducted.
Methods
Experimental conditions
Fertilised eggs of pikeperch were obtained from Aquapri Inno-vation, Egtved, Denmark and transferred in oxygenated plastic bags to DTU Aqua at the North Sea Research Centre, Denmark. Eggs were incubated until hatching in upflow McDonald type incubators with a flow-through system. Freshwater heated at 17·5°C from a temperature-controlled 10 m3reservoir was con-stantly supplied. Hatched larvae were distributed into two 0·5 m3 fibreglass tanks and kept until 10 d post-hatch (DPH) at 19·5– 20·3°C and constant low-intensity light. From 3 to 10 DPH, larvae were fed newly hatched non-enriched Artemia nauplii (strain MC460; INVE, kept at 5°C after hatching) for 2× 8 h through a peristaltic pump (longer pumps, BT300-2J; Langer Instruments Corp.) to make sure that live Artemia nauplii were always present ad libitum (i.e. 1–3 individuals/ml) in the tanks. At 10 DPH, all larvae were mixed and moved to another temperature-controlled freshwater flow-through larval system consisting of eighteen conical tanks of 46 litre. Pikeperch larvae were manually dis-tributed into these tanks at a density of seventeen larvae per litre and fed one of the six experimental dry diets until 30 DPH under a water temperature of 20–20·5°C and at dimmed light (30–40 lux at water surface) provided by electrical LED bulbs. Daily, theflow rate was adjusted at 15 litres/h per tank, and oxygen (7·8 (SD
0·4) mg/l) and temperature (20·2 (SD0·1)°C) were monitored by a
hand-held oxymeter (OxyGuard).
In total, six isonitrogenous and isoenergetic diets (Table 1) were formulated to contain three PL levels (PL1, PL2 and PL3), adding 3, 10 and 19 % SBL, and these same PL levels combined with increased DHA levels (PL1H1, PL2H2 and PL3H3) adding 0·55, 2 and 3·4 % Algatrium DHA70. Supplementation with SBL replaced olive oil in the diets. Olive oil with a high oleic acid content was used (>81 % wet weight) and with a limited n-6 and n-3 PUFA content. Experimental diets were manufactured by SPAROS. All powder ingredients were initially mixed and
https://www.cambridge.org/core
. FUNDP-BUMP
, on
21 Oct 2019 at 08:44:34
, subject to the Cambridge Core terms of use, available at
https://www.cambridge.org/core/terms
.
ground in a micropulveriser hammer mill (SH1; Hosokawa-Alpine). Subsequently, the oils were added, diets humidified with 25 % deionised water and agglomerated by a low-shear and temperature-controlled extrusion process (P55; Italplast). The resulting pellets (0·8 mm) were dried in a convection oven for 3 h at 40°C (OP 750-UF; LTE Scientifics), crumbled (103; Neuero Farm) and mechanically sieved (Eco-Separator; Russell-Finex) to particle size ranges (400–600 and 800 µm).
From 10 to 17 DPH, triplicate groups of larvae were co-fed one of the six experimental dry feeds together with newly non-enriched Artemia nauplii (INVE) from 08.00 to 22.00 hours. During this period, Artemia feeding was daily postponed by 1 h. From 10 to 17 DPH, larvae were fed a diet with a pellet size
of 400–600 µm (initially further ground in a mortar to 200– 250µm), which was gradually increased to 600–800 µm during the 2nd week. A mixture of these two size ranges was applied for the remaining experiment until 30 DPH. Dry feed was daily administered by eighteen programmable automatic feeders (screw feeders; made by DTU Aqua), which allowed very small quantities to be fed at short specific time intervals (approxi-mately 15 min) during the entire feeding period. Dry feeds were administered at 25 % of expected larval biomass in the 1st weeks and 10–15 % during the last week. Larvae were not fed 12 h before sampling for analytical purpose to ensure an empty gut. Tank bottom was daily vacuum-cleaned to remove uneaten feed and to count dead larvae.
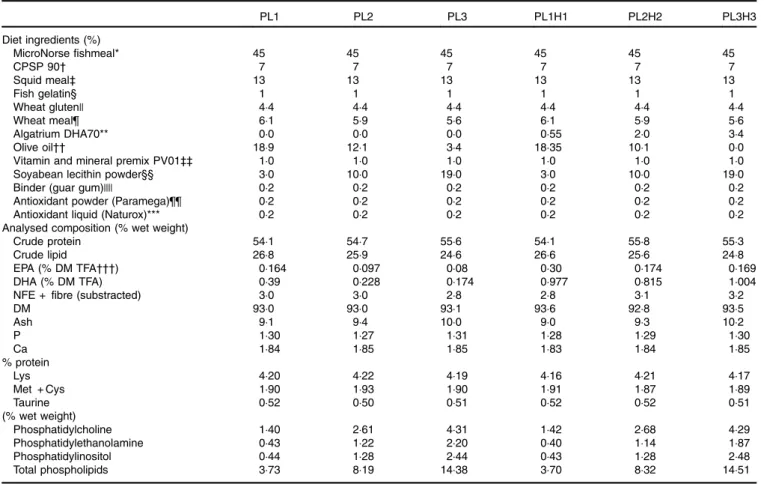
Table 1. Feed formulation and proximate analysis of the six experimental diets
PL1 PL2 PL3 PL1H1 PL2H2 PL3H3 Diet ingredients (%) MicroNorse fishmeal* 45 45 45 45 45 45 CPSP 90† 7 7 7 7 7 7 Squid meal‡ 13 13 13 13 13 13 Fish gelatin§ 1 1 1 1 1 1 Wheat gluten|| 4·4 4·4 4·4 4·4 4·4 4·4 Wheat meal¶ 6·1 5·9 5·6 6·1 5·9 5·6 Algatrium DHA70** 0·0 0·0 0·0 0·55 2·0 3·4 Olive oil†† 18·9 12·1 3·4 18·35 10·1 0·0
Vitamin and mineral premix PV01‡‡ 1·0 1·0 1·0 1·0 1·0 1·0
Soyabean lecithin powder§§ 3·0 10·0 19·0 3·0 10·0 19·0
Binder (guar gum)|||| 0·2 0·2 0·2 0·2 0·2 0·2
Antioxidant powder (Paramega)¶¶ 0·2 0·2 0·2 0·2 0·2 0·2
Antioxidant liquid (Naturox)*** 0·2 0·2 0·2 0·2 0·2 0·2
Analysed composition (% wet weight)
Crude protein 54·1 54·7 55·6 54·1 55·8 55·3
Crude lipid 26·8 25·9 24·6 26·6 25·6 24·8
EPA (% DM TFA†††) 0·164 0·097 0·08 0·30 0·174 0·169
DHA (% DM TFA) 0·39 0·228 0·174 0·977 0·815 1·004
NFE + fibre (substracted) 3·0 3·0 2·8 2·8 3·1 3·2
DM 93·0 93·0 93·1 93·6 92·8 93·5 Ash 9·1 9·4 10·0 9·0 9·3 10·2 P 1·30 1·27 1·31 1·28 1·29 1·30 Ca 1·84 1·85 1·85 1·83 1·84 1·85 % protein Lys 4·20 4·22 4·19 4·16 4·21 4·17 Met + Cys 1·90 1·93 1·90 1·91 1·87 1·89 Taurine 0·52 0·50 0·51 0·52 0·52 0·51 (% wet weight) Phosphatidylcholine 1·40 2·61 4·31 1·42 2·68 4·29 Phosphatidylethanolamine 0·43 1·22 2·20 0·40 1·14 1·87 Phosphatidylinositol 0·44 1·28 2·44 0·43 1·28 2·48 Total phospholipids 3·73 8·19 14·38 3·70 8·32 14·51
TFA, total fatty acids; NFE, N-free extract.
* MicroNorse Fish Meal: 71 % crude protein and 9·8 % crude fat; Tromsø Fiskeindustri AS.
† Soluble fish-protein concentrate (CPSP 90): 84 % crude protein and 12 % fat; Sopropêche. ‡ Squid meal: Super prime squid meal: 80 % crude protein and 3·5 % crude fat; Sopropêche.
§ Fish gelatin: 88 % crude protein, 0·1 % crude fat; LAPI Gelatine SPA.
|| Wheat gluten: VITAL 83·7 % crude protein and 1·4 % crude fat; Roquette Frères.
¶ Wheat meal: 11·7 % crude protein and 1·6 % crude fat; Casa Lanchinha.
** Algatrium DHA70: Brudy Technologies. †† Olive oil: Henry Lamotte Oils GmbH.
‡‡ PVO40.01 premix for marine fish (Premix Lda); vitamins (per kg diet): 100 mgDL-α tocopherol acetate, 25 mg sodium menadione bisulphate, 20 000 IU retinyl acetate, 2000 IU
DL-cholecalciferol, 30 mg thiamin, 30 mg riboflavin, 20 mg pyridoxine, 0·1 mg B12, 200 mg nicotinic acid, 15 mg folic acid, 1000 mg ascorbic acid, 500 mg inositol, 3 mg biotin,
100 mg calcium panthotenate, 1000 mg choline chloride and 500 mg betaine; minerals (per kg diet): 2·5 mg cobalt sulphate, 1·1 mg copper sulphate, 0·2 g ferric citrate, 5 mg
potassium iodide, 15 mg manganese sulphate, 0·2 mg sodium selenite, 40 mg zinc sulphate, 0·6 g magnesium hydroxide, 1·1 g potassium chloride, 0·5 g sodium chloride and 4 g
calcium carbonate.
§§ Soya lecithin powder: Lecico P700IPM; LECICO GmbH. |||| Binder (guar gum): HV109; SEAH International. ¶¶ Antioxidant powder: Paramega PX; KEMIN EUROPE NV. *** Antioxidant liquid: NATUROX; KEMIN EUROPE NV. ††† TFA, thirty-four analysed.
https://www.cambridge.org/core
. FUNDP-BUMP
, on
21 Oct 2019 at 08:44:34
, subject to the Cambridge Core terms of use, available at
https://www.cambridge.org/core/terms
.
Larval sampling
A representative number of larvae (2× 100) were sampled at hatching (0 DPH) and 10 DPH for FA analysis andfifty larvae sampled for initial weight measurement. At 30 DPH, 2× 10 larvae per replicate tank were sampled for PL and FA analysis. In all, ten larvae per tank were sampled for analysis of digestive enzymes at 30 DPH. In addition, 2× 10 larvae per replicate were sampled for proteomics at 30 DPH. All larvae were killed by an overdose of benzocaine and immediately frozen and kept at–80°C until analysis. At 30 DPH, an additional ten larvae per tank were sampled for larval organ and skeleton development for specific staining of bone and cartilage and stored in 10 % phosphate-buffered formaldehyde. To quantify the gene expression involved in skeletal development, ten larvae per replicate were sampled and stored in RNA-later overnight and frozen at−80°C until analysis.
Larval survival and growth
Daily mortality was assessed by the number of registered dead larvae, whereas the total number of alive larvae manually counted at the end of the trial was considered as thefinal sur-vival in each tank. Growth was determined by individually weighing 100 randomly sampled larvae at 10 DPH and thirty-five larvae per replicate tank at 30 DPH. Each anaesthetised larva was wiped to remove excess water (medical care tissue
cloth) and weighed to the nearest 0·01 mg on a Mettler Toledo AT200. Mean larval weight at 10 DPH was 1·95 (SD0·31) mg wet weight and 0·56 (SD0·09) mg DM. Specific daily
growth rate (SGR) (% per d) was calculated according to the following equation: SGR = (ln (final average body weight of sampled larvae)− ln (initial average body weight of sampled larvae))× 100/feeding days.
Biochemical analysis
Representative samples of the six diets were homogenised using a Krups Speedy Pro homogenizer 244 and analysed for DM and ash (NMKL, 1991), crude protein 245 (ISO 2005; crude protein; Kjeldahl N× 6·25) and crude lipid(44). N-free extract (NFE) was calculated as DM minus the sum of crude protein, crude lipid and ash. The proximate composition of the diets was similar in terms of protein, lipid, NFE and ash content and with almost identical values of the essential amino acids, lysine, methionine and cysteine and the sulphur-containing non-pro-tein amino acid taurine (Table 1).
The FA composition in diets (Table 2) and larvae (Table 3) was determined by lipid extraction with a chloroform–methanol mixture(45)and either sonicated in an ultrasound cleaner, model Branson, 2510, or homogenised (larger larvae) by a tissue-tearor probe with a diameter of 4·5 mm (Biospec Products, Inc.). Trans-esterification of the lipids was performed by acetyl chloride in methanol at 95°C. The FA methyl esters were
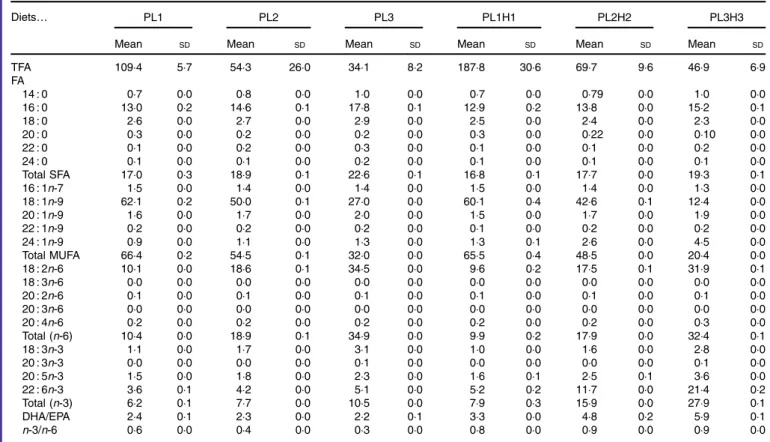
Table 2. Analysed total fatty acids (TFA) content (mg/g DM) and fatty acid (FA) composition (% of TFA) of the six experimental diets* (Mean values and standard deviations, n 2)
Diets… PL1 PL2 PL3 PL1H1 PL2H2 PL3H3
Mean SD Mean SD Mean SD Mean SD Mean SD Mean SD
TFA 109·4 5·7 54·3 26·0 34·1 8·2 187·8 30·6 69·7 9·6 46·9 6·9 FA 14 : 0 0·7 0·0 0·8 0·0 1·0 0·0 0·7 0·0 0·79 0·0 1·0 0·0 16 : 0 13·0 0·2 14·6 0·1 17·8 0·1 12·9 0·2 13·8 0·0 15·2 0·1 18 : 0 2·6 0·0 2·7 0·0 2·9 0·0 2·5 0·0 2·4 0·0 2·3 0·0 20 : 0 0·3 0·0 0·2 0·0 0·2 0·0 0·3 0·0 0·22 0·0 0·10 0·0 22 : 0 0·1 0·0 0·2 0·0 0·3 0·0 0·1 0·0 0·1 0·0 0·2 0·0 24 : 0 0·1 0·0 0·1 0·0 0·2 0·0 0·1 0·0 0·1 0·0 0·1 0·0 Total SFA 17·0 0·3 18·9 0·1 22·6 0·1 16·8 0·1 17·7 0·0 19·3 0·1 16 : 1n-7 1·5 0·0 1·4 0·0 1·4 0·0 1·5 0·0 1·4 0·0 1·3 0·0 18 : 1n-9 62·1 0·2 50·0 0·1 27·0 0·0 60·1 0·4 42·6 0·1 12·4 0·0 20 : 1n-9 1·6 0·0 1·7 0·0 2·0 0·0 1·5 0·0 1·7 0·0 1·9 0·0 22 : 1n-9 0·2 0·0 0·2 0·0 0·2 0·0 0·1 0·0 0·2 0·0 0·2 0·0 24 : 1n-9 0·9 0·0 1·1 0·0 1·3 0·0 1·3 0·1 2·6 0·0 4·5 0·0 Total MUFA 66·4 0·2 54·5 0·1 32·0 0·0 65·5 0·4 48·5 0·0 20·4 0·0 18 : 2n-6 10·1 0·0 18·6 0·1 34·5 0·0 9·6 0·2 17·5 0·1 31·9 0·1 18 : 3n-6 0·0 0·0 0·0 0·0 0·0 0·0 0·0 0·0 0·0 0·0 0·0 0·0 20 : 2n-6 0·1 0·0 0·1 0·0 0·1 0·0 0·1 0·0 0·1 0·0 0·1 0·0 20 : 3n-6 0·0 0·0 0·0 0·0 0·0 0·0 0·0 0·0 0·0 0·0 0·0 0·0 20 : 4n-6 0·2 0·0 0·2 0·0 0·2 0·0 0·2 0·0 0·2 0·0 0·3 0·0 Total (n-6) 10·4 0·0 18·9 0·1 34·9 0·0 9·9 0·2 17·9 0·0 32·4 0·1 18 : 3n-3 1·1 0·0 1·7 0·0 3·1 0·0 1·0 0·0 1·6 0·0 2·8 0·0 20 : 3n-3 0·0 0·0 0·0 0·0 0·1 0·0 0·0 0·0 0·0 0·0 0·1 0·0 20 : 5n-3 1·5 0·0 1·8 0·0 2·3 0·0 1·6 0·1 2·5 0·1 3·6 0·0 22 : 6n-3 3·6 0·1 4·2 0·0 5·1 0·0 5·2 0·2 11·7 0·0 21·4 0·2 Total (n-3) 6·2 0·1 7·7 0·0 10·5 0·0 7·9 0·3 15·9 0·0 27·9 0·1 DHA/EPA 2·4 0·1 2·3 0·0 2·2 0·1 3·3 0·0 4·8 0·2 5·9 0·1 n-3/n-6 0·6 0·0 0·4 0·0 0·3 0·0 0·8 0·0 0·9 0·0 0·9 0·0
* PL1, PL2 and PL3 (soyabean lecithin (SBL): 3, 10 and 19 %); PL1H1, PL2H2 and PL1H3 (SBL: 3, 10 and 19 %) + Algatrium DHA 70: 0·55, 2·05 and 3·4 %.
https://www.cambridge.org/core
. FUNDP-BUMP
, on
21 Oct 2019 at 08:44:34
, subject to the Cambridge Core terms of use, available at
https://www.cambridge.org/core/terms
.
analysed by GC–MS. Peaks on a given chromatogram were identified by comparison with the retention time of a com-mercial mix of a known FAME standard, SUPELCO 18919 (4 : 0– 24 : 0), from SIGMA. Peaks were quantified by means of the target response factor of the FA and 23 : 0 as internal standard. FA concentrations were calculated (version E.02.02.1431; ChemStation) on the basis of the quantified peaks of the stan-dard series and the samples, as well of dry weight of prey and larvae, and expressed as ng/sample.
A total of thirty-four FA were analysed, with the twenty most relevant FA shown (Tables 2 and 3). Total FA (TFA) differed between the diets and decreased by substitution of olive oil with SBL. The main differences in dietary FA profiles (% TFA) were related to oleic acid (18 : 1n-9), linoleic acid (18 : 2n-6), α-linolenic acid (18 : 3n-3), EPA, DHA and consequently total MUFA, n-6 PUFA and n-3 PUFA (Table 2). 18 : 2n-6 and 18 : 3n-3 content increased by the increased supplementation of SBL, for which 18 : 2n-6 is the dominant FA (approximately 55 % TFA, data not shown) with the additional content of some 18 : 3n-3 (3 % TFA). Diets PL1H1–PL3H3 contained significantly increased levels of EPA and DHA (as compared with diets PL1– PL3) owing to the supplementation of Algatrium DHA 70.
Quantification of PL in diets and larvae was performed by Spectral Service AG, by use of31P-NMR spectroscopy using an
internal standard according to the method previously descri-bed(46). Preweighed homogeneous subsamples of feed or larvae (30 DPH) were used, and before analysis larvae for each replicate were freeze-dried for 24 h on an Adolf Kühner AG Beta 2-16. NMR analyses were carried out on a Bruker DRX 600 spectro-meter (Bruker Biospin GmBH), resonating at 600·13 MHz for1
H and 150·90 for13
C, using a 5-mm BBO probe at 297 K. For the quantification of PL in the samples, a defined amount of the test substance and corresponding internal standard (exactly weighed) were dissolved in CDCL3, methanol and aqueous CS-EDTA solution (0·2 m, pH 7·5). After 30 min of shaking, the organic layer was separated by centrifugation and measured with31P-NMR. The integrated signals of the test substance and of the internal stan-dard triphenylphosphate were used for calculation.
The dietary analytical content of the three main PL classes identified increased as expected by dietary incorporation of SBL (Table 1). Total PL content ranged from 3·7 % (% of lipids) for PL1 and PL1H1 to approximately 14·4–14·5 % for diets PL3 and PL3H3.
Digestive enzyme activity
The heads and tails of pikeperch (S. lucioperca) larvae were removed to isolate the digestive segment on a glass maintained
Table 3. Analysed total fatty acids (TFA) content and fatty acid (FA) composition (% of TFA) of total lipids in pikeperch larvae at 0 and 10 d post-hatch (DPH), as well as in 30 DPH (mg/g, wet weight), after 20 d of feeding experimental diets*
(Mean values and standard deviations, n 3)
Larval age… DPH 0 DPH 10 DPH 30
Diets… PL1 PL2 PL3 PL1H1 PL2H2 PL3H3
Mean SD Mean SD Mean SD Mean SD Mean SD Mean SD Mean SD Mean SD TFA (mg/g, wet weight) 109·9 27·5 139·4 18·4 41·5 7·8 69·2 36·1 64·1 9·5 73·1 19·7 69·1 14·5 38·2 15·6 FA (% TFA) 14 : 0 0·9 0·0 0·5 0·0 0·4 0·0 0·3 0·2 0·6 0·1 0·4 0·0 0·5 0·1 0·6 0·1 16 : 0 11·9 0·9 13·5 0·6 13·5b 0·1 14·5b 1·5 18·3a 0·4 13·1b 0·3 13·9b 0·5 14·8b 0·6 18 : 0 3·3 0·2 7·2 0·2 4·4c 0·0 4·2b,c 0·1 4·5c 0·3 3·7b 0·2 3·0a 0·1 3·0a 0·2 20 : 0 0·1 0·0 0·2 0·0 0·1b 0·0 0·1a,b 0·0 0·1a 0·0 0·1b 0·0 0·1a 0·0 0·1a 0·0 22 : 0 0·2 0·1 0·4 0·0 0·1b 0·0 0·1b 0·0 0·1a,b 0·0 0·1b 0·0 0·0a 0·0 0·0a 0·0 24 : 0 0·0 0·0 0·1 0·0 0·1 0·0 0·0 0·0 0·1 0·0 0·0 0·0 0·0 0·0 0·0 0·0 Total SFA 16·9 0·9 22·8 1·0 19·0 0·1 19·6 1·6 24·1 0·3 17·8 0·4 17·9 0·6 18·8 0·8 16 : 1n-7 6·8 0·3 2·3 0·2 1·3 0·0 1·2 0·2 1·2 0·1 1·3 0·1 1·4 0·1 1·1 0·1 18 : 1n-9 12·0 0·4 22·5 0·1 50·5e 0·5 43·8d 0·8 24·7b 0·8 50·3e 1·8 37·4c 1·1 12·8a 1·0 20 : 1n-9 1·1 0·1 0·5 0·0 1·1c 0·0 1·2c 0·0 1·0b 0·0 1·1c 0·0 1·0b 0·0 0·8a 0·0 22 : 1n-9 0·0 0·0 0·1 0·0 0·1 0·0 0·1 0·0 0·1 0·0 0·1 0·0 0·1 0·0 0·1 0·0 24 : 1n-9 7·3 0·7 1·9 0·1 2·3a,b 0·1 2·0a 0·1 2·4b 0·1 2·5b 0·2 3·1c 0·2 5·2d 0·2 Total MUFA 27·3 0·2 28·1 0·1 55·6e 0·4 48·4d 0·6 29·7b 0·4 55·7e 1·7 43·2c 1·0 20·2a 0·9 18 : 2n-6 8·3 0·6 7·4 0·2 11·0a 0·1 18·7b 0·2 29·1c 0·4 10·7a 0·0 19·2b 0·1 28·5c 0·5 18 : 3n-6 0·1 0·0 0·5 0·0 0·2a,b 0·0 0·3b,c 0·0 0·6d 0·0 0·2a 0·0 0·3c 0·0 0·3c 0·0 20 : 2n-6 0·0 0·0 0·2 0·0 0·1a 0·0 0·1a 0·1 0·3b 0·0 0·1a 0·0 0·2a 0·0 0·2a,b 0·0 20 : 3n-6 0·0 0·0 0·2 0·0 0·3b 0·0 0·3b 0·0 0·6d 0·0 0·2c 0·0 0·2c 0·0 0·1a 0·0 20 : 4n-6 ARA 1·2 0·0 0·9 0·0 0·5b,c 0·0 0·3a 0·1 0·4a,b 0·1 0·4b 0·0 0·4a,b 0·0 0·6c 0·1 Total (n-6) PUFA 9·7 0·6 9·3 0·3 12·1a 0·1 19·6b 0·1 31·0e 0·4 11·6a 0·1 20·2c 0·1 29·7d 0·5 18 : 3n-3 1·1 0·0 27·1 0·3 1·3a,b 0·1 1·3a,b 0·0 1·9c 0·1 1·1a 0·2 1·5b 0·1 1·9c 0·2 20 : 3n-3 0·1 0·1 1·3 0·0 0·1c 0·0 0·1a 0·0 0·1b 0·0 0·1a,b,c 0·0 0·1a,b 0·0 0·1a,b 0·0 20 : 5n-3 EPA 7·9 0·3 2·8 0·2 2·5a 0·1 2·2a 0·2 2·6a 0·2 2·5a 0·2 2·6a 0·3 3·9b 0·2 22 : 6n-3 DHA 37·1 0·3 8·5 0·8 9·4a 0·3 8·6a 0·8 10·6b 0·4 11·2b 0·9 14·6c 1·1 25·4d 0·8 Total (n-3) PUFA 46·1 0·5 39·7 0·7 13·3a 0·3 12·2a 1·0 15·3b 0·7 14·8a,b 1·2 18·7c 1·4 31·2d 0·8 DHA/EPA 4·7 0·1 3·1 0·0 3·8a 0·0 3·9a,b 0·2 4·2b 0·0 4·5c 0·0 5·7d 0·3 6·6e 0·2 n-3/n-6 4·8 0·3 4·3 0·1 1·1b 0·0 0·6a 0·1 0·5a 0·0 1·3c 0·1 0·9b 0·1 1·1b 0·0
ARA, arachidonic acid.
a,b,c,d,eMean values (for larvae fed the experimental diets (30 DPH) within a row followed by unlike superscript letters were significantly different (P< 0·05).
* PL1, PL2 and PL3 (soyabean lecithin (SBL): 3, 10 and 19 %); PL1H1, PL2H2 and PL1H3 (SBL: 3, 10 and 19 %) + Algatrium DHA 70: 0·55, 2·05 and 3·4 %.
https://www.cambridge.org/core
. FUNDP-BUMP
, on
21 Oct 2019 at 08:44:34
, subject to the Cambridge Core terms of use, available at
https://www.cambridge.org/core/terms
.
on ice (0°C), and the stomach region was separated with the intestinal segments. Pooled samples from each tank were homogenised in 10 volumes (v/w) of cold distilled water. Assay of the cytosolic peptidase, leucine–alanine peptidase (leu–ala), was performed according to the method of Nicholson & Kim(47) using leucine–alanine (Sigma-Aldrich) as substrate. Alkaline phosphatase (AP) and aminopeptidase N, two enzymes of brush border membrane, were assayed according to Bessey et al.(48) and Maroux et al.(49) using p-nitrophenyl phosphate (Sigma-Aldrich) andL-leucine p-nitroanalide (Sigma-Aldrich) as
substrates, respectively. Pepsin was assayed by the method of Worthington(50) modified by Cuvier–Péres and Kestemont(51). Trypsin and amylase activities were assayed according to Holm et al.(52)and Metais and Bieth(53), respectively such as described by Gisbert et al.(54). Protein was determined using the Bradford procedure(55). Enzyme activities are expressed as specific activities (mU/mg protein).
Skeleton anomalies and related gene expression
Skeleton analyses were conducted onfixed 30 DPH pikeperch larvae. These were stained with alizarin red to evaluate the skeletal anomalies and vertebral mineralisation according to methods(56)modified from previous studies(57). Classification of skeletal anomalies was conducted according to Boglione et al.(58)
. Anomalies were expressed as frequency of total severe anomalies and specific anomalies, such as cranial, dentary, branchiostegal, prehaemal and caudal vertebrae, within each dietary group. The effects of the different weaning diets on the axial skeleton mineralisation were evaluated considering the total number of completely mineralised vertebral bodies within a larval size class. Total RNA from larvae samples (average weight per sample 60 mg) was extracted using the Rneasy Mini Kit (Qiagen). Total body tissue was homogenised using the Tissue Lyzer-II (Qia-gen) with QIAzol lysis reagent (Qia(Qia-gen). Samples were cen-trifuged with chloroform for phase separation (12 000 g, 15 min, 4°C). The upper aqueous phase containing RNA was mixed with 75 % ethanol and transferred into an RNeasy spin column where total RNA bonded to a membrane and contaminants were washed away by RW1 and RPE buffers (Qiagen). Purified RNA was eluted with 30µl of RNase-free water. The quality and quantity of RNA were analysed using the NanoDrop 1000 Spectrophotometer (Thermo Scientific) and by electrophoresis
of total RNA in a 1 % agarose gel. Synthesis of complementary DNA (cDNA) was conducted using the iScript cDNA Synthesis Kit (Bio-Rad) according to manufacturer’s instructions in an iCycler thermal cycler (Bio-Rad). Primer efficiency was tested with serial dilutions of a cDNA pool (1, 1 : 5, 1 : 10, 1 : 15, 1 : 20 and 1 : 25). Product size of the real-time quantitative PCR amplification was checked by electrophoresis analyses using PB322 cut with HAEIII as a standard. Real-time quantitative PCR was performed in an iQ5 Multicolor real-time PCR detection system (Bio-Rad; Hercules) using RAG1 as the housekeeping gene in afinal volume of 20 µl/reaction well, and 100 ng of total RNA reverse-transcribed to complementary cDNA. Each gene sample was analysed once per gene. The PCR conditions were as follows: 95°C for 3 min 30 s followed by forty cycles of 95°C for 15 s, 61°C for 30 s and 72°C for 30 s, 95°C for 1 min and a final denaturing step from 61 to 95°C for 10 s. Data obtained were normalised and the Livak method (2 ΔΔCt) was used to
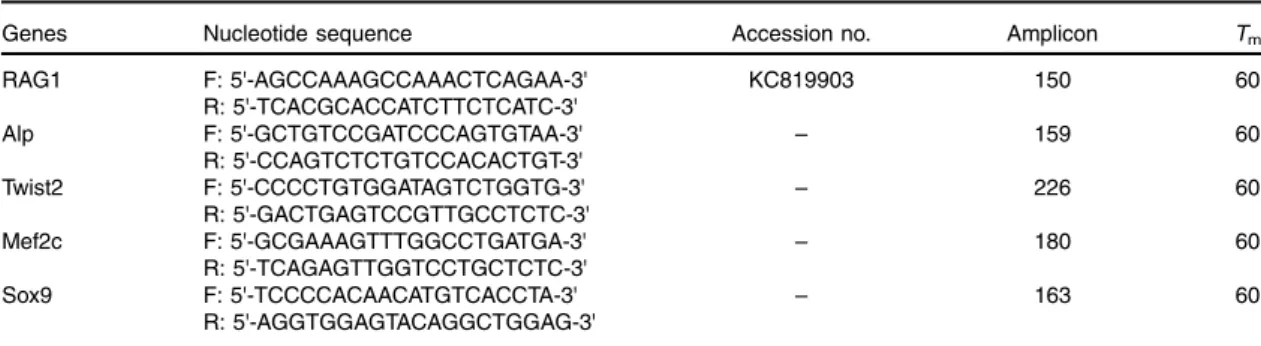
determine relative mRNA expression levels. Pikeperch-specific gene primers were designed after searching the NCBI nucleo-tide database and using the Oligo 7 Primer Analysis software (Molecular Biology Insights). Within the oligo used, RAG1, ALP, Twist2, Mef2c and Sox9 oligonucleotide primers were designed by extracting fish mRNA sequences from NCBI, aligning with MEGA 7 software and identifying conserved domains, to which primers were designed using Primer3 (version 0.4.0) program. Target specificity was tested by sequencing the resulting amplicons and comparing with the NCBI sequence database using BLAST. Detailed information on primer sequences and accession numbers is presented in Table 4.
Proteomics
Slightly thawed larvae (30 DPH) were dissected on a glass plate maintained at 0°C. The liver was extracted and immediately frozen in liquid N2and kept at − 80°C until analysis. In total, three independent biological replicates were used for each experimental condition. The soluble protein fractions were harvested by centrifugation at 12 000 g for 15 min at 4°C. The pH of the protein extract was adjusted to 8·5 by addition of an appropriate volume of 50 mM NaOH and protein concentration was evaluated using a Pierce 660-nm protein assay kit as described by the manufacturer. Minimal labelling of samples (containing 25μg of solubilised proteins) was performed on ice
Table 4. Sequences of primers used for gene expression analysis
Genes Nucleotide sequence Accession no. Amplicon Tm
RAG1 F: 5'-AGCCAAAGCCAAACTCAGAA-3' KC819903 150 60 R: 5'-TCACGCACCATCTTCTCATC-3' Alp F: 5'-GCTGTCCGATCCCAGTGTAA-3' – 159 60 R: 5'-CCAGTCTCTGTCCACACTGT-3' Twist2 F: 5'-CCCCTGTGGATAGTCTGGTG-3' – 226 60 R: 5'-GACTGAGTCCGTTGCCTCTC-3' Mef2c F: 5'-GCGAAAGTTTGGCCTGATGA-3' – 180 60 R: 5'-TCAGAGTTGGTCCTGCTCTC-3' Sox9 F: 5'-TCCCCACAACATGTCACCTA-3' – 163 60 R: 5'-AGGTGGAGTACAGGCTGGAG-3' F, forward; R, reverse. https://www.cambridge.org/core . FUNDP-BUMP , on 21 Oct 2019 at 08:44:34
, subject to the Cambridge Core terms of use, available at
https://www.cambridge.org/core/terms
.
for 30 min in the dark using three cyanine dyes (Cy2, Cy3 and Cy5), and quenched with 1 mMlysine for 10 min. Cy2 was used
as the internal standard and was composed of equal amounts of proteins from each sample, whereas Cy3 and Cy5 were used to individually label the samples. The three labelled mixtures were combined and the total proteins (75µg) were added v-v reducing buffer (7M urea, 2M thiourea, 2 % 1,4-dithiothreitol,
2 % 3-[(3-cholamidopropyl)dimethylammonio]-1-propanesulfonate (CHAPS) and 2 % immobilised pH gradient (IPG) 4–7 buffer) for 15 min at room temperature in the dark. These mixtures were then cup-loaded on immobilised pH gradient strips (24 cm, pH 4–7; GE Healthcare) and passively rehydrated overnight with a rehydration buffer. The isoelectric focusing was performed with an Ettan™ IPGphor II isoelectric focusing unit (GE Healthcare) at 20°C for a total of 68 000 Vh. IPG strips were then reduced (1 % 1,4-dithiothreitol) and alkalised (2·5 % iodoacetamide) in equili-bration buffer just before being loaded onto a 10 %, 24-cm, 1-mm-thick acrylamide gel. The strips were run in an Ettan™ DALTsix electrophoresis unit (GE Healthcare) at constant 0·5 W/gel. The gels were then scanned with a Typhoon 9400 scanner (GE Healthcare) at wavelengths specific for the CyDyes (488 nm for Cy2, 532 nm for Cy3 and 633 nm for Cy5). Image analysis, with a resolution of 100μm, was performed using the DeCyder BVA 5.0 software (GE Healthcare). Data were analysed using one-way ANOVA followed by the Tukey’s post hoc test (using the Statistica 5.5 software, 2000; StatSoft, Inc.) when significant differences between groups were found (P < 0·05).
For peptide sequencing and protein identification, preparative gels including 150μg of proteins of mixed samples were performed (pH 4–7 IPG strips, 10 % acrylamide). Gels were post-stained with 10 % krypton overnight after 30 min offixation, twice, in 40 % ethanol and 10 % acetic acid. The proteolytic digestion was performed on excised spots by the addition of 3μl of modified trypsin (Promega) suspended in 100 mM
NH4HCO3 cold buffer. Proteolysis was performed overnight at 37°C. The supernatants were collected and kept at−20°C before analysis. Peptides were analysed by using nano-LC-ESI–MS/MS maXis Impact UHR-TOF (Bruker) coupled with a nanoLC UltiMate 3000 (ThermoFisher). Scaffold (version Scaffold-4.6.1; Proteome Software Inc.) was used to validate MS/MS-based peptide and protein identifications. All MS/MS samples were analysed using Mascot (version 2.4; Matrix Science) and X!Tandem (The GPM, thegpm.org). In all protein identifications, only significant hits as defined by Mascot probability analysis (using the algorithm Peptide Prophet)(59,60) were considered initially, with a significance threshold set at 0·01. Proteins were functionally annotated using AgBase-Goanna(61)as described in Roland et al.(62). The false discovery rate was always set at 0 %. The GO categories for biological processes were then sorted to determine the most common ones represented by the proteins identified. The mean number of proteomic spots detected per gel was 1917 (SD 498). A one-way ANOVA among the six experi-mental groups revealed twenty-seven spots with differential intensity at P< 0·05. These spots were selected for statistical analyses and MS/MS identifications. Of the twenty-seven spots picked up for MS analysis, seventeen spots contained one pro-tein identification per spot, and this led to the identification of fifteen different proteins.
Statistics
Percent data were arcsine-transformed before analysis. Experi-mental data were subjected to a one-way or two-way ANOVA and all pairwise multiple comparison of means test for deter-mining significance of differences among the four treatment groups where applicable. Linear regression was used to deter-mine correlation of dietary FA, phosphoglyceride content and larval content, as well as enzymatic activity. For larval survival, final weight, growth, FA, PL composition and enzymatic activity, the SigmaPlot 13.0 software was used and Holm Sidak test applied. For skeletal anomalies and related gene expression, the IBM SPSS Statistics 21 software was used and Tukey’s test applied. For proteomics data, peptide sequencing and protein identification, the Statistica 5.5 software was used and Tukey’s test applied. Levene’s test was used to check for homogeneity of variance within the treatment groups. Values throughout the text are expressed as the mean values and standard deviations. In all statistical tests used, P< 0·05 was considered statistically different. All analyses were based on larval samples obtained from triplicate groups, as described previously.
Ethical standards
The study has been conducted in accordance with national and international guidelines according to animal welfare ethics and approved. The ARRIVE guidelines for animal research studies have been followed.
Results
Larval survival and growth
From 15 DPH, there was an increase in daily larval mortality (data not shown), regardless of tanks and dietary codes. At the end of the trial (30 DPH), the sum of daily registered mortality suggested a survival ranging from 57 to 61 % for the different tanks and without significant differences among dietary treat-ments (P≥ 0·553). However, based on the remaining number of alive larvae at the end of the trial, the actual survival was much lower (10–14 %), but neither statistically different (P ≥ 0·633).
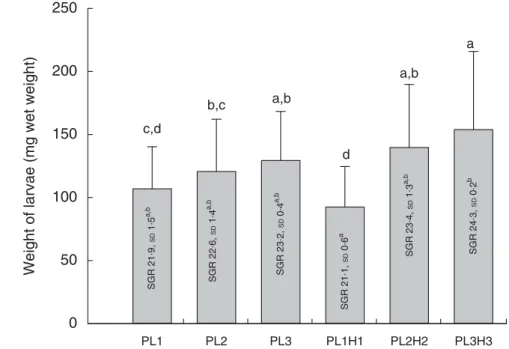
Meanfinal larval weight at 30 DPH ranged from 92 to 154 mg wet weight (Fig. 1). Dietary inclusion of PL resulted in an increase in body weight, and additional supplementation of DHA (+EPA) in the form of Algatrium DHA 70 further increased weight. Thus, larvae fed the highest DHA and PL levels (diet PL3H3) showed the highest mean body weight, being significantly larger than in those fed PL1 (P< 0·001), PL2 (P ≤ 0·01) and PL1H1 (P < 0·001). PL2H2 larvae were larger than those fed PL1 (P< 0·03) and PL1H1 (P≤ 0·001). Finally, PL2 and PL3 larvae were both larger than larvae fed PL1H1 (P≤ 0·04 and P ≤ 0·01, respectively). Overall, larval growth calculated as SGR was lowest for PL1H1 (21·2 %/d) and highest for PL3H3 (24·3 %/d) (Fig. 1).
Biochemical analysis
There was a marked decrease in larval EPA and DHA larval composition from 0 to 10 DPH and a corresponding increase in
https://www.cambridge.org/core
. FUNDP-BUMP
, on
21 Oct 2019 at 08:44:34
, subject to the Cambridge Core terms of use, available at
https://www.cambridge.org/core/terms
.
stearic acid (18 : 0), oleic acid (18 : 1) and 18 : 3n-3 (Table 3). Larval FA content at 30 DPH reflected dietary formulation and the increase in supplementation of PL and Algatrium DHA70 at the expense of olive oil, the main contributor of oleic acid (Table 3). The highest inclusion of Algatrium DHA 70 caused an increase of DHA content in larvae of PL3H3 about 2·5 times higher than that of PL3-fed larvae, whereas it was 1·5 times higher for EPA. An increased substitution of olive oil with SBL without LC-PUFA supplementation (PL2 and PL3) caused a significantly lower n-3/n-6 in larvae compared with the other larval groups. An overall very significant larval/dietary correlation was observed for all larval groups for both oleic acid (P< 0·001; R20·99·6) and for DHA and EPA (P < 0·001, R20·98) and P= 0·016, R20·80), respectively. Consequently, larval DHA: EPA was significantly correlated to diet DHA:EPA (P < 0·001, R20·97).
PC was the major PL class in diets and larvae (Fig. 2). In larvae, it constituted between 68 and 73 % of the total PL content and was not significantly different between treatment groups (P≥ 0·241). An increase in the dietary content of PC increased the larval PC tissue content (Fig. 3a); however, this correlation was not significant for any of the two groups PL1– PL3 (P≥ 0·14) or PL1H1–PL3H3 (P ≥ 0·12). The phosphatidy-lethanolamine (PE) tissue content in larvae fed diet PL3H3 was significantly lower than in larvae fed PL2 and PL3 (P < 0·03; Fig. 2). For larvae fed diets PL1, PL2 and PL3, an increase in the dietary PE content slightly increased larval content (Fig. 3b), but the correlation was not significant (P ≥ 0·62). However, for larvae fed diets PL1H1, PL2H2 and PL3H3, a strong negative tissue content correlation was observed with dietary PE content (P= 0·001) (Fig. 3b). For PL1–PL3 larval groups, a dietary increase in PI slightly increased larval PI content; however, the
correlation was not significant (P ≥ 0·91). PL1H1–PL3H3 displayed on contrast a significant negative PI diet:PI larval correlation (P= 0·05). For other minor PL classes analysed, there were no significant differences among content in larvae between groups, although analysed contents in all diets were below detection.
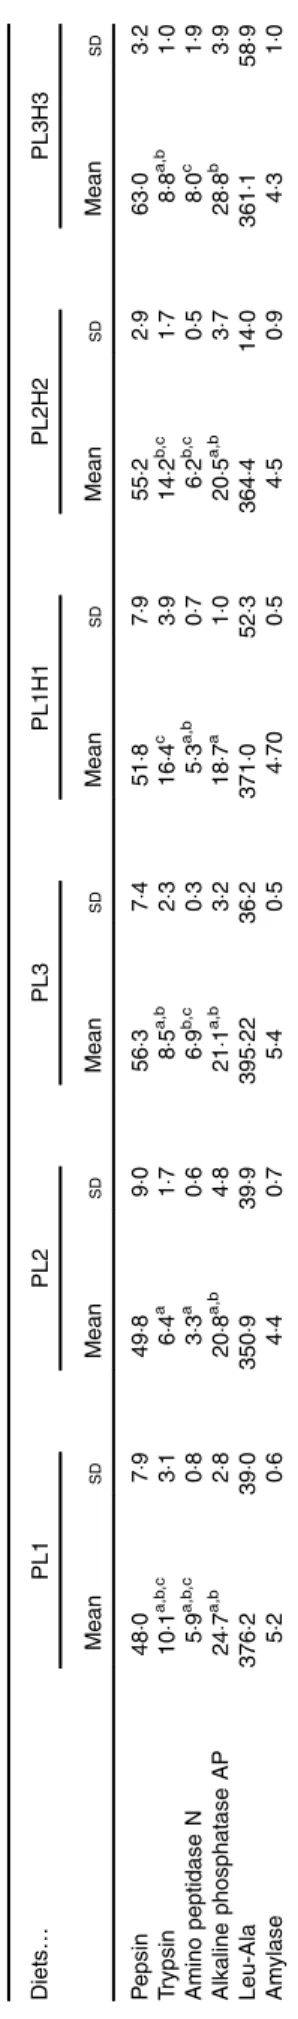
Digestive enzyme activity
No significant differences were observed in larval pepsin activity (Table 5), despite a general trend for a higher activity in
PL1 PL2 PL3 PL1H1 PL2H2 PL3H3
Weight of larvae (mg wet weight)
0
50
100
150
200
250
c,d b,c a,b d a,b a SGR 21 . 9, SD 1 . 5 a,b SGR 22 . 6, SD 1 . 4 a,b SGR 23 . 2, SD 0 . 4 a,b SGR 23 . 4, SD 1 . 3 a,b SGR 24 . 3, SD 0 . 2 b SGR 21 . 1, SD 0 . 6 aFig. 1. Mean final body weight (mg wet weight; bars) of larvae fed experimental diets for 20 d (10–30 DPH). PL1, PL2 and PL3 (soyabean lecithin (SBL): 3, 10 and 19 %); PL1H1, PL2H2 and PL1H3 (SBL: 3, 10 and 19 %) + Algatrium DHA 70: 0·55, 2·05 and 3·4%. Final body weight values are pooled means of three tank replicates (n 35 fish per tank), and standard deviations represented as vertical bars. Specific daily growth rate (SGR) (%/d, values inside each bar, n 3 replicate tanks and standard deviations).a,b,c,dMean values for each diet group with unlike letters were significantly different (P< 0·05).
PL1 PL2 PL3 PL1H1 PL2H2 PL3H3 Weight % (% DM) 0.0 0.2 0.4 0.6 0.8 1.0 1.2 Diets a,b a a a,b a,b b
Fig. 2. Phospholipid class composition in larvae (% DM mean values and standard deviations, n 3 replicate tanks) fed experimental diets for 20 d (10–30 DPH). PL1, PL2 and PL3 (soyabean lecithin (SBL): 3, 10 and 19 %). PL1H1, PL2H2 and PL1H3 (SBL: 3, 10 and 19 %) + Algatrium DHA 70: 0·55, 2·05 and 3·4 %. , Phosphatidylcholine; , phosphatidylethanolamine; , phosphatidylinositol; , sphingomelin; , phosphatidylserine; , lysophosphatidylcholine; , N-acyl phosphatidylethanolamine.a,bMean values for each diet group with unlike letters were significantly different (P< 0·05).
https://www.cambridge.org/core
. FUNDP-BUMP
, on
21 Oct 2019 at 08:44:34
, subject to the Cambridge Core terms of use, available at
https://www.cambridge.org/core/terms
.
pikeperch larvae fed increased PL and DHA contents. In this sense, a significant positive linear correlation was found among the two parameters (y= 0·4971x + 45·397; r2 0·934) (Fig. 4). Trypsin activity was significantly higher in larvae fed PL1H1 than in those fed PL2, PL3 and PL3H3 (P= 0·003; Table 5). Results showed that an increase in DHA, particularly from PL2 to PL2H2, significantly reduced trypsin activity. In addition, a dietary increase in both PL and DHA from PL1H1 to PL3H3
(a) (b) (c) Phosphatidylcholine in diets (% DM) Phosphatidylcholine in larvae (% DM) 0.70 0.75 0.80 0.85 0.90 0.95 1.00 1.05 Phosphatidylethanolamine in diets (% DM) 1.0 1.5 2.0 2.5 3.0 3.5 4.0 4.5 0.2 0.4 0.6 0.8 1.0 1.2 1.4 1.6 1.8 2.0 2.2 2.4 Phosphatidylethanolamine in larvae (% DM) 0.05 0.10 0.15 0.20 0.25 0.30 0.35 Phosphatidylinositol in diets (% DM) 0.0 0.5 1.0 1.5 2.0 2.5 3.0 Phosphatidylinositol in larvae (% DM) 0.01 0.02 0.03 0.04 0.05 0.06 0.07 0.08 0.09
Fig. 3. (a–c) Dietary: larval tissue phospholipid class correlation when fed experimental diets for 20 d (10–30 DPH). Values are means (n 3) replicate tanks. a: , (PL1–PL3) y: 1·40x + 0·88; r2 0·88; , (PL1H1–PL3H3) y: 1·42x + 0·72; r20·91; b: , (PL1–PL3) y: 0·43x + 1·98; r20·91; , (PL1H1– PL3H3) y: 0·40x − 0·238; r20·92; c: , (PL1–PL3) y: 1·44x + 0·03; r20·42; , (PL1H1–PL3H3) y: 0·43x + 0·08; r20·97. Ta b le 5. Lar v al-specific enzymatic activity (mU/mg protein) in 30 d post-hatch (DPH) pike perch lar v ae after 2 0 d of feeding e xperimen tal diets* (Mean v alues and standard de viations , n 3) Diets … PL1 PL2 PL3 PL1H1 PL2H2 PL3H3 Mean SD Mean SD Mean SD Mean SD Mean SD Mean SD P e psin 48 ·07 ·94 9· 89 ·05 6· 37 ·45 1· 87 ·95 5· 22 ·96 3· 03 ·2 T rypsin 10 ·1 a,b ,c 3· 16 ·4 a 1· 78 ·5 a,b 2· 31 6· 4 c 3· 91 4· 2 b, c 1· 78 ·8 a,b 1· 0 Amino peptidase N 5· 9 a,b ,c 0· 83 ·3 a 0· 66 ·9 b, c 0· 35 ·3 a,b 0· 76 ·2 b, c 0· 58 ·0 c 1· 9 Alkaline p hosphatase AP 24 ·7 a,b 2· 82 0· 8 a,b 4· 82 1· 1 a,b 3· 21 8· 7 a 1· 02 0· 5 a,b 3· 72 8· 8 b 3· 9 Leu-Ala 3 76 ·23 9· 03 5 0· 93 9· 93 9 5· 22 36 ·23 7 1· 05 2· 33 6 4· 41 4· 0 361 ·15 8· 9 Am ylase 5· 20 ·64 ·40 ·75 ·40 ·54 ·70 0· 54 ·50 ·94 ·31 ·0 a,b ,c Mean v a lues wi thin a row fo llo wed b y unlik e s uperscript letters were s ignifican tly diff ere n t (P < 0· 05 ). * PL1, PL2 and PL3 (so y abean lecit h in (SBL): 3 , 1 0 a n d 19 %); PL1H1, PL2H 2 and PL1H3 (SBL: 3, 10 a n d 1 9 % ) + Alg a trium DHA 70: 0· 55, 2· 05 and 3· 4% . https://www.cambridge.org/core . FUNDP-BUMP , on 21 Oct 2019 at 08:44:34
, subject to the Cambridge Core terms of use, available at
https://www.cambridge.org/core/terms
.
significantly reduced trypsin activity (P = 0·003). On the other hand, despite the increase in dietary PL from PL1 to PL3, it did not significantly affect larval trypsin activity (Table 5). Amino-peptidase activity was lowest in larvae fed PL2 compared with those fed PL3, PL2H2 and PL3H3 (P= 0·001). An increase in dietary PL, particularly from PL2 and PL1H1 to PL3H3, significantly increased aminopeptidase activity. AP was sig-nificantly highest for PL3H3 larvae than for PL1H1 larvae (P≤ 0·038). Thus, despite the increase in dietary PL from PL1 to PL3, it did not significantly affect larval AP activity, but a dietary increase in both PL and DHA from PL1H1 to PL3H3 significantly increased the activity of this enzyme.
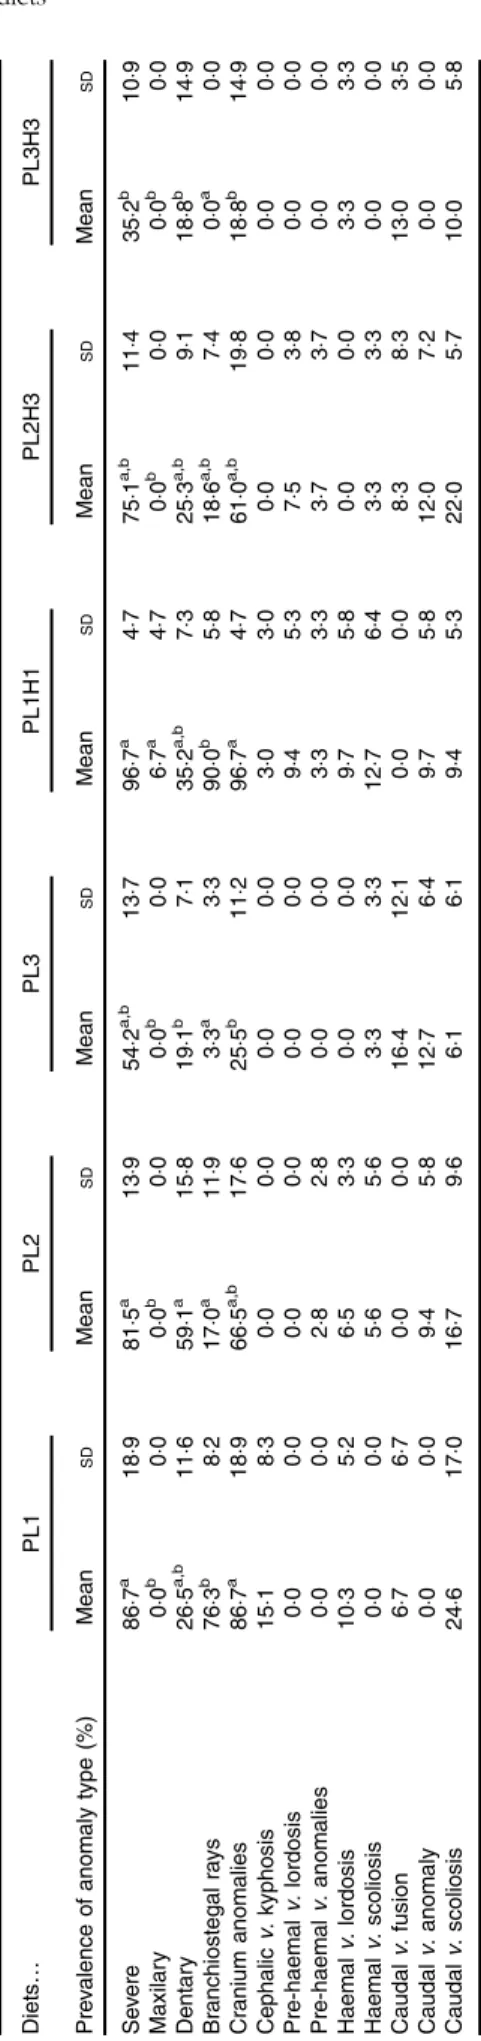
Skeleton anomalies and related gene expression
Overall there was a high incidence of severe anomalies, parti-cularly those related with endochondral bones, such as cranium or dentary bones. The lowest incidence of severe anomalies was found in PL3H3 pikeperch, followed by PL3 (Table 6). An increase in dietary PL from PL1 to PL3 tended to reduce the incidence of severe anomalies. Moreover, a dietary increase in both PL and DHA from PL1H1 to PL3H3 significantly reduced the occurrence of severe anomalies. The incidence of maxillary anomalies was very low and only detected in larvae fed PL1H1 (Table 6). Dentary bone anomalies were significantly lowest in PL3 and PL3H3 larvae and highest in PL2 (Table 6). A similar trend was found in branchiostegal rays (Table 6) and cranial anomalies incidences (Table 6) that were significantly lowest in larvae fed diets PL3H3 and PL3 and highest in PL1 and PL1H1. Indeed, a highly significant inverse correlation was found between the dietary PL content or PC content and the incidence of cranial anomalies (r2 0·98; P < 0·001 or r2 0·98, P < 0·001, respectively) or severe anomalies (r2 0·89, P < 0·01; r2 0·88, P< 0·01, respectively). No significant differences were found in any of the other anomalies studied.
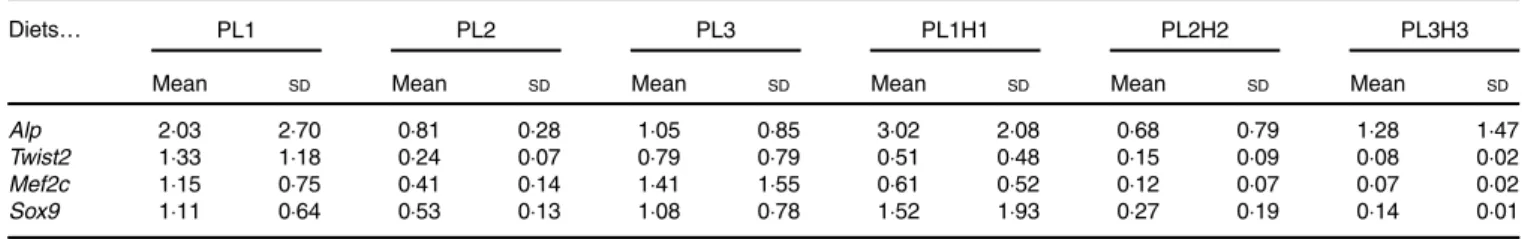
Expression of bone morphogenesis-related genes did not show a clear effect of the different treatments. In fact, no sta-tistical differences were found between larvae fed the different diets for the four genes analysed (Table 7).
Proteomics
Offifteen different identified proteins, nine proteins displayed a differential intensity between treatments (Tukey’s post hoc test
70 0 5 10 15 20 25 30 35 40 y = 0.4971x + 45.397 R2= 0.934 60 50 40 30 20 10 0
Activity (mU/mg protein)
PL (% wet weight) + DHA (%TFA) dietary content
Fig. 4. Effect of dietary phospholipid (PL) (% wet weight) and DHA (% total FA (TFA)) on pepsin-specific activity in pikeperch larvae after 20 d of feeding experimental diets. Values are means (n 3) replicate tanks and standard deviations represented by vertical bars.
Ta b le 6. Incidence of diff erent bone anomalies (%) in 30 d p ost-hatch (DPH) pik eperch lar v ae after 20 d o f feeding e x perimental diets* (Mean v alues and standard de viations , n 3) Diets … PL1 PL2 PL3 PL1H1 PL2H3 PL3H3 Pre v alence o f anomaly type (%) Mean SD Mean SD Mean SD Mean SD Mean SD Mean SD Se v ere 86 ·7 a 18 ·98 1· 5 a 13 ·95 4· 2 a,b 13 ·79 6· 7 a 4· 77 5· 1 a,b 11 ·43 5· 2 b 10 ·9 Maxilar y 0· 0 b 0· 00 ·0 b 0· 00 ·0 b 0· 06 ·7 a 4· 70 ·0 b 0· 00 ·0 b 0· 0 Dentar y 2 6· 5 a,b 11 ·65 9· 1 a 15 ·81 9· 1 b 7· 13 5· 2 a,b 7· 32 5· 3 a,b 9· 11 8· 8 b 14 ·9 Branchiostegal ra ys 76 ·3 b 8· 21 7· 0 a 11 ·93 ·3 a 3· 39 0· 0 b 5· 81 8· 6 a,b 7· 40 ·0 a 0· 0 Cranium anomalies 8 6· 7 a 18 ·96 6· 5 a,b 17 ·62 5· 5 b 11 ·29 6· 7 a 4· 76 1· 0 a,b 19 ·81 8· 8 b 14 ·9 Cephalic v . kyphosis 15 ·18 ·30 ·00 ·00 ·00 ·03 ·03 ·00 ·00 ·00 ·00 ·0 Pre-haemal v . lordosis 0· 00 ·00 ·00 ·00 ·00 ·09 ·45 ·37 ·53 ·80 ·00 ·0 Pre-haemal v . a nomalies 0· 00 ·02 ·82 ·80 ·00 ·03 ·33 ·33 ·73 ·70 ·00 ·0 Haemal v . lordosis 10 ·35 ·26 ·53 ·30 ·00 ·09 ·75 ·80 ·00 ·03 ·33 ·3 Haemal v . scoliosis 0· 00 ·05 ·65 ·63 ·33 ·31 2· 76 ·43 ·33 ·30 ·00 ·0 Caudal v . fusion 6· 76 ·70 ·00 ·01 6· 41 2· 10 ·00 ·08 ·38 ·31 3· 03 ·5 Caudal v . a nomaly 0· 00 ·09 ·45 ·81 2· 76 ·49 ·75 ·81 2· 07 ·20 ·00 ·0 Caudal v . scoliosis 24 ·61 7· 01 6· 79 ·66 ·16 ·19 ·45 ·32 2· 05 ·71 0· 05 ·8 a,b Me an v a lue s within a ro w fo llo wed b y unlik e s u perscript were s ignificantly diff erent (P < 0· 05). * PL1, PL2 and PL3 (so y abean lecit h in (SBL): 3 , 1 0 a n d 19 %); PL1H1, PL2H 2 and PL1H3 (SBL: 3, 10 a n d 1 9 % ) + Alg a trium DHA 70: 0· 55, 2· 05 and 3· 4% . https://www.cambridge.org/core . FUNDP-BUMP , on 21 Oct 2019 at 08:44:34
, subject to the Cambridge Core terms of use, available at
https://www.cambridge.org/core/terms
.
(P< 0·05), Table 8). Fatty acid synthase (FAS) is primarily responsible for the synthesis of palmitate (16 : 0) (i.e. SFA with 12, 14 or 16 carbons can be synthesised), which can be further elongated and/or desaturated as it is the main reactor in lipo-genesis and FA synthesis. Among the identified proteins, FAS was significantly down-regulated in PL3H3 larvae compared with larvae of PL1, PL2 and PL1H1 (4·36-, 3·65- and 3·50-fold respectively, P< 0·01), suggesting a negative relation with DHA levels in larvae (Table 3). Besides, for a given dietary PL content (14·4 %), an increase in total dietary n-3 LC-PUFA from 10·5 to 27·9 % (i.e. Table 2) significantly down-regulated FAS expres-sion; this protein was over-expressed in PL3 larvae compared with PL3H3 (3·54-fold, P = 0·002). However, the analysis showed that, for the same level of low total n-3 PUFA content (7·7 %), the increase in dietary PL content did not significantly affect FAS expression (comparison between PL2 and PL1H1 larvae; Table 2).
Another protein related to lipid metabolism, ATP-citrate synthase, was also under-expressed in PL3H3 larvae com-pared with PL2 larvae (2·60-fold, P < 0·05). Similarly, a high
PL and LC-PUFA dietary content (diet PL3H3) led to an under-expression for spot 1633, in which two lipid transfer proteins were identified, the non-specific lipid transfer protein and the hydroxysteroid dehydrogenase-like protein 2 (HSDL2), as compared with PL1H1 (1·63-fold, P = 0·03). In comparison with larvae reared on PL2, larvae fed PL3H3 displayed a decrease in abundance for two proteins involved in endo-plasmic reticulum (ER) stress: the glucose regulated protein (Grp) and the glucose-regulated 94 (Grp94) (Hsp90) (1·70-fold, P= 0·007, and 1·52-fold, P = 0·03, respectively). A similar pat-tern of protein expression occurred for Grp94 in PL1H1 larvae compared with PL2 (1·48-fold, P = 0·03). In addition, spot number 369 displayed a differential intensity between larval groups PL3H3 and PL1 (1·63-fold, P = 0·03), in which both Grp94 and a function ubiquitin carboxyl-terminal hydrolase 5 were identified. Two spots were identified as protein disulphide-isomerase (PDI) (spots 1376 and 1947); according to Tukey’s post hoc test, only spot 1947 displayed a differential intensity that was lower in larvae fed PL1 compared with PL2H2 and PL2 treatment (1·99- and 1·85-fold, P = 0·005). Larvae fed
Table 7. Gene expression in 30 d post-hatch (DPH) pikeperch larvae after 20 d of feeding experimental diets* (Mean values and standard deviations, n 3)
Diets… PL1 PL2 PL3 PL1H1 PL2H2 PL3H3
Mean SD Mean SD Mean SD Mean SD Mean SD Mean SD
Alp 2·03 2·70 0·81 0·28 1·05 0·85 3·02 2·08 0·68 0·79 1·28 1·47
Twist2 1·33 1·18 0·24 0·07 0·79 0·79 0·51 0·48 0·15 0·09 0·08 0·02
Mef2c 1·15 0·75 0·41 0·14 1·41 1·55 0·61 0·52 0·12 0·07 0·07 0·02
Sox9 1·11 0·64 0·53 0·13 1·08 0·78 1·52 1·93 0·27 0·19 0·14 0·01
* PL1, PL2 and PL3 (soyabean lecithin (SBL): 3, 10 and 19 %); PL1H1, PL2H2 and PL1H3 (SBL: 3, 10 and 19 %) + Algatrium DHA 70: 0·55, 2·05 and 3·4 %.
Table 8. Protein differentially expressed in liver of 30 d post-hatch (DPH) pikeperch larvae after 20 d of feeding experimental diets
Spot no. Accession no. Protein identification Species
Number of matched peptides
Theoretical
PI/MW P Fold change 794 A0A0F8AHC2 Glucose-regulated Larimichthys crocea 5 5·41/82 0·007 − 1·70 in PL3H3/PL2 518 A0A0F8AWU1 Glucose-regulated protein (GRP94) Larimichthys crocea 7 4·76/91 0·031 − 1·48 in PL1H1/PL2 − 1·52 in PL3H3/PL2 UPI000557CE3B Glucose-regulated protein (GRP94) Notothenia coriiceps 6 4·73/92
369 A0A0F8AWU1 Glucose-regulated protein (GRP94) Larimichthys crocea 6 4·76/91 0·033 − 1·63 in PL3H3/PL1 UPI000557CE3B Glucose-regulated protein (GRP94) Notothenia coriiceps 5 4·73/92
UPI00055340E4 Ubiquitin carboxyl-terminal hydrolase 5 Notothenia coriiceps 3 4·98/88
795 UPI000556131D Fatty acid synthase-like Notothenia coriiceps 4 5·66/54 0·002 4·36 in PL1/PL3H3 3·65 in PL2/PL3H3 3·54 in PL3/PL3H3 3·50 in PL1H1/PL3H3 1102 G3P216 ATP-citrate synthase Gasterosteus aculeatus 3 7·80/120 0·036 − 2·60 in PL3H3/PL2 1633 H2U634 Non-specific lipid-transfer protein Takifugu rubripes 3 8·11/59 0·042 − 2·03 in PL3H3/
PL1H1 UPI000551760C Non-specific lipid-transfer protein Notothenia coriiceps 2 6·58/58
H2SWA2 Hydroxysteroid dehydrogenase-like protein 2
Takifugu rubripes 2 6·03/37
1232 G8G8Y1 Keratin 8 (fragment) n 2 Epinephelus coioides 9 4·72/41 0·035 − 2·27 in PL2H2/PL1 − 2·33 in PL3H3/PL1 G3NI19 Keratin type II cytoskeletal 8-like Gasterosteus aculeatus 9 5·22/60
Q4QY72 Type II keratin E3-like protein Sparus aurata 4 4·89/39
1376 UPI00054B498F Protein disulphide-isomerase Larimichthys crocea 5 4·61/57 0·047 NS
1947 U3LRB6 Protein disulphide-isomerase Dicentrarchus labrax 3 5·39/56 0·005 1·85 in PL2/PL1 1·99 in PL2H2/PL1 1·67 in PL2/PL1H1
PI, isoelectric point; MW, molecular weight.
https://www.cambridge.org/core
. FUNDP-BUMP
, on
21 Oct 2019 at 08:44:34
, subject to the Cambridge Core terms of use, available at
https://www.cambridge.org/core/terms
.
PL2 showed also an increase in its abundance compared with PL1H1-fed larvae (1·67-fold, P = 0·005). Last, larvae reared on PL1 showed an increase in abundance for a spot identified as Keratin– a cytoskeletal and structural protein – in comparison with PL2H2 and PL3H3 larvae (2·27- and 2·33-fold respectively, P= 0·03).
Discussion
Survival was reduced by cannibalism in all tanks, in agreement with previous observations(2,3). Larval growth was generally high, even whenfish were fed the lowest PL and n-3 LC-PUFA dietary levels. An increase in dietary PL levels up to 8 % markedly enhanced larval weight, in agreement with a recent unpublished study with these same diets, where pikeperch larvae fed the lowest PL levels (3·70 and 3·73 %) showed a significantly lower growth. However, elevation of dietary PL from 8 to 14·5 % did not further increase fish growth significantly. These results are in agreement with the optimum PL requirement previously defined for pikeperch (9·5 %) fed SBL(2)
. Similarly, PL requirements for gilthead seabream (Sparus aurata) fed SBL were approximately 8 %, when larvae were fedfive dietary PL levels (4·9–9·6 %)(21). Pikeperch growth promotion by an increase in dietary PL may be related to a higher feed intake as shown in gilthead seabream and prawn (Penaeus monodon)(24,63,64). Moreover, an increase in dietary PL tended to increase larval PC contents. This increase in PC at higher dietary PL contents would be in agreement with previous studies showing that PC is the main product of PL synthesis infish enterocyte(38)and comprises up to 95 % of the PL found in VLDL(65). Moreover, PC has been long considered the most effective PL to promote larval growth(12). For instance, dietary supplementation with PC, but not PE, stimulated feeding activity in gilthead seabream larvae, probably through the ingestion of the trimethyl group of the choline base of PC that binds to receptor gustatory cells(66). Nevertheless, growth improvement in pikeperch larvae fed increased PL dietary levels could also be related to an improved lipid transport in agreement with previous studies. For instance, in gilthead seabream,fish fed diets without lecithin accumulated lipid vacuoles in the basal zone of intestinal enterocytes and caused steatosis in hepatic tissue, whereas supplementation with SBL reduced accumula-tion(37)and enhanced lipoprotein synthesis(20).
An increase in dietary PL from 3·72 up to 8·19 % did not significantly affect the incidence of anomalies, which is in agreement with previous studies with pikeperch and similar PL levels (1·4–9·5 %) supplemented with SBL(2)
. Similar results were found in gilthead seabream, where an increase in dietary SBL did not reduce bone anomalies.(41)However, in the present experiment, a further dietary PL increase up to 14·38 sig-nificantly reduced the incidence of severe skeletal anomalies, and tended to be lowest in fish fed increased DHA dietary levels. This was more evident on anomalies affecting endo-chondral bones, such as the cranium, where an increase in dietary PL reduced the prevalence of these anomalies. These results are in agreement with those obtained in European sea bass (Dicentrarchus labrax)(67), although the incidence of anomalies was much lower in seabass than in pikeperch.
It should be noticed that the seabass study used higher levels of PC and PI (35 and 16 mg/kg respectively). Despite the differ-ences in prevalence of skeletal anomalies, bone anomaly reduction by PL was not related to the relative expression of the bone-development-related genes studied, such as alp (early mineralisation indicator), twist2, mef2c or sox9 (endochondral bone-development-related genes). This lack of effect could be because of an earlier origin of the anomalies during thefirst part of the feeding trial, when cartilage was being developed and bones ossified. At the final sampling (30 DPH), bone miner-alisation in pikeperch was almost completed. Indeed, in gilthead seabream, an increase in SBL up to 12 % significantly up-regulated alp(21). Reduction of bone anomalies by increased PL dietary contents has been related to the specific increase in dietary PI(68), as the second messenger inositol-3-phosphate regulates Ca mobilisation from the ER(16)and would stimulate osteocalcine production(12).
In addition to growth improvement, dietary SBL supple-mentation markedly affected pikeperch larvae FA composition, elevating the 18 : 2n-6, an essential FA for freshwaterfish, as well as 18 : 3n-6 and 20 : 3n-6, products ofδ-6-desaturase and elongase activity. However, 20 : 4n-6, a product of δ-5-desaturase activity, was not increased; this was in agreement with the low LC-PUFA biosynthetic ability of pikeperch larvae (unpub-lished results).
Combined supplementation of SBL up to 14·51 % DM PL with n-3 LC-PUFA (1·0 % DM DHA and 0·16 % DM EPA; i.e. 1·17 % LC PUFA) in the form of TAG led to the highest growth and lowest anomalies incidence, improving digestive enzyme activities and liver proteomics. This could be related to either a specific effect of the FA or a combined effect of PL and FA. The latter seems likely, as diets with lowest PL inclusion (3·70 and 3·73 %) but different LC PUFA content (i.e. 0·17 % EPA + 0·39 % DHA v. 0·3 % EPA + 0·98 % DHA) both lead to a relatively lower growth. A negative effect on growth by a high inclusion level of olive oil; 18 : 1n-9 in both of these diets, however, cannot be exclu-ded as the gradual substitution of olive oil with soya lecithin caused a 3-fold increase in tissue linoleic acid, 18 : 2n-6 levels and a concurrent 2-fold decrease in tissue oleic acid, 18 : 1n-9 content. 18 : 2n-6 may have a growth-promoting effect or a different metabolic fate as compared with 18 : 1n-9, despite the fact that C14-labelled FA analyses have indicated no elongation or desaturation capability in pikeperch larvae (unpublished results). The optimal levels of EPA and DHA in marine fish larvae has been estimated to be about 3 % of dietary DM(69), whereas for pikeperch larvae an optimal level of 1·2 % DM has been suggested, based on experiments with SBL without n-3 LC-PUFA and fish gonad lecithin with n-3 LC-PUFA(30). In addition, 1·2 % LC-PUFA is very similar to the 1·17 % estimated to be optimal in this experiment– in the presence of 14·5 % PL supplemented as SBL. In agreement with previous studies in marine fish larvae(12,16,24,32,37,67,70), marine PL rich in n-3 LC-PUFA could be more effective as a source of essential FA than SBL supplemented with n-3 LC-PUFA. Izquierdo et al.(24) compared the effect of four isoenergetic, isoproteic and iso-lipidic diets with either two levels of SBL substituted by oleic acid and supplemented with EPA and DHA in a TAG form or by two levels of marine PL in twenty-five DPH larval seabream.
https://www.cambridge.org/core
. FUNDP-BUMP
, on
21 Oct 2019 at 08:44:34
, subject to the Cambridge Core terms of use, available at
https://www.cambridge.org/core/terms
.