When Will AI Exceed Human Performance?
Evidence from AI Experts
Katja Grace
1,2, John Salvatier
2, Allan Dafoe
1,3, Baobao Zhang
3, and Owain Evans
1 1Future of Humanity Institute, Oxford University2AI Impacts 3
Department of Political Science, Yale University
Abstract
Advances in artificial intelligence (AI) will transform modern life by reshaping transportation, health, science, finance, and the military [1,2,3]. To adapt public policy, we need to better anticipate these advances [4,5]. Here we report the results from a large survey of machine learning researchers on their beliefs about progress in AI. Researchers predict AI will outper-form humans in many activities in the next ten years, such as translating languages (by 2024), writing high-school essays (by 2026), driving a truck (by 2027), working in retail (by 2031), writing a bestselling book (by 2049), and working as a surgeon (by 2053). Researchers believe there is a 50% chance of AI outperforming humans in all tasks in 45 years and of automating all human jobs in 120 years, with Asian respondents expecting these dates much sooner than North Americans. These results will inform discussion amongst researchers and policymakers about anticipating and managing trends in AI.
Introduction
Advances in artificial intelligence (AI) will have massive social consequences. Self-driving tech-nology might replace millions of driving jobs over the coming decade. In addition to possible unemployment, the transition will bring new challenges, such as rebuilding infrastructure, pro-tecting vehicle cyber-security, and adapting laws and regulations [5]. New challenges, both for AI developers and policy-makers, will also arise from applications in law enforcement, military tech-nology, and marketing [6]. To prepare for these challenges, accurate forecasting of transformative AI would be invaluable.
Several sources provide objective evidence about future AI advances: trends in computing hardware [7], task performance [8], and the automation of labor [9]. The predictions of AI experts provide crucial additional information [10,11,12]. We survey a large, representative sample of AI experts. Our questions cover the timing of AI advances (including both practical applications of AI and the automation of various human jobs), as well as the social and ethical impacts of AI.
Survey Method
Our survey population was all researchers who published at the 2015 NIPS and ICML confer-ences (two of the premier venues for peer-reviewed research in machine learning). A total of 352 researchers responded to our survey invitation (21% of the 1634 authors we contacted). Our ques-tions concerned the timing of specific AI capabilities (e.g. folding laundry, language translation), superiority at specific occupations (e.g. truck driver, surgeon), superiority over humans at all tasks, and the social impacts of advanced AI. SeeSurvey Contentfor details.
Time Until Machines Outperform Humans
AI would have profound social consequences if all tasks were more cost effectively accomplished by machines. Our survey used the following definition:
“High-level machine intelligence” (HLMI) is achieved when unaided machines can ac-complish every task better and more cheaply than human workers.
Each individual respondent estimated the probability of HLMI arriving in future years. Taking the mean over each individual, the aggregate forecast gave a 50% chance of HLMI occurring within 45 years and a 10% chance of it occurring within 9 years. Figure 1 displays the probabilistic predictions for a random subset of individuals, as well as the mean predictions. There is large inter-subject variation: Figure3 shows that Asian respondents expect HLMI in 30 years, whereas North Americans expect it in 74 years.
0.00 0.25 0.50 0.75 1.00 0 25 50 75 100
Years from 2016
Pr
obability of HLMI
Aggregate Forecast (with 95% Confidence Interval) Random Subset of Individual Forecasts
LOESS
Figure 1: Aggregate subjective probability of ‘high-level machine intelligence’ arrival by future years. Each respondent provided three data points for their forecast and these were fit to the Gamma CDF by least squares to produce the grey CDFs. The “Aggregate Forecast” is the mean distribution over all individual CDFs (also called the “mixture” distribution). The confidence interval was generated by bootstrapping (clustering on respondents) and plotting the 95% interval for estimated probabilities at each year. The LOESS curve is a non-parametric regression on all data points.
While most participants were asked about HLMI, a subset were asked a logically similar question that emphasized consequences for employment. The question defined full automation of labor as:
when all occupations are fully automatable. That is, when for any occupation, machines could be built to carry out the task better and more cheaply than human workers.
Forecasts for full automation of labor were much later than for HLMI: the mean of the individual beliefs assigned a 50% probability in 122 years from now and a 10% probability in 20 years.
Figure 2: Timeline of Median Estimates (with 50% intervals) for AI Achieving Human Per-formance. Timelines showing 50% probability intervals for achieving selected AI milestones. Specifically, intervals represent the date range from the 25% to 75% probability of the event occurring, calculated from the mean of individual CDFs as in Fig. 1. Circles denote the 50%-probability year. Each milestone is for AI to achieve or surpass human expert/professional performance (full descriptions in TableS5). Note that these intervals represent the uncertainty of survey respondents, not estimation uncertainty.
Respondents were also asked when 32 “milestones” for AI would become feasible. The full de-scriptions of the milestone are in TableS5. Each milestone was considered by a random subset of respondents (n≥24). Respondents expected (mean probability of 50%) 20 of the 32 AI milestones to be reached within ten years. Fig. 2 displays timelines for a subset of milestones.
Intelligence Explosion, Outcomes, AI Safety
The prospect of advances in AI raises important questions. Will progress in AI become explosively fast once AI research and development itself can be automated? How will high-level machine intel-ligence (HLMI) affect economic growth? What are the chances this will lead to extreme outcomes (either positive or negative)? What should be done to help ensure AI progress is beneficial? Table
S4displays results for questions we asked on these topics. Here are some key findings:
1. Researchers believe the field of machine learning has accelerated in recent years. We asked researchers whether the rate of progress in machine learning was faster in the first or second half of their career. Sixty-seven percent (67%) said progress was faster in the second half of their career and only 10% said progress was faster in the first half. The median career length among respondents was 6 years.
2. Explosive progress in AI after HLMI is seen as possible but improbable. Some authors have argued that once HLMI is achieved, AI systems will quickly become vastly superior to humans in all tasks [3, 13]. This acceleration has been called the “intelligence explosion.” We asked respondents for the probability that AI would perform vastly better than humans in all tasks two years after HLMI is achieved. The median probability was 10% (interquartile range: 1-25%). We also asked respondents for the probability of explosive global technological improvement two years after HLMI. Here the median probability was 20% (interquartile range 5-50%).
3. HLMI is seen as likely to have positive outcomes but catastrophic risks are possible. Respondents were asked whether HLMI would have a positive or negative impact on humanity over the long run. They assigned probabilities to outcomes on a five-point scale. The median probability was 25% for a “good” outcome and 20% for an “extremely good” outcome. By contrast, the probability was 10% for a bad outcome and 5% for an outcome described as “Extremely Bad (e.g., human extinction).”
4. Society should prioritize research aimed at minimizing the potential risks of AI. Forty-eight percent of respondents think that research on minimizing the risks of AI should be prioritized by society more than the status quo (with only 12% wishing for less).
Asia (n=68) Europe (n=58) North America (n=64) Other Regions (n=21) 0.00 0.25 0.50 0.75 1.00 0 25 50 75 100 Years from 2016 Pr obability of HLMI
Undergrad Region HLMI CDFs
Figure 3: Aggregate Forecast (computed as in Figure 1) for HLMI, grouped by region in which respondent was an undergraduate. Additional regions (Middle East, S. America, Africa,
Asians expect HLMI 44 years before North Americans
Figure 3 shows big differences between individual respondents in when they predict HLMI will arrive. Both citation count and seniority were not predictive of HLMI timelines (see Fig. S1and the results of a regression in TableS2). However, respondents from different regions had striking differences in HLMI predictions. Fig. 3 shows an aggregate prediction for HLMI of 30 years for Asian respondents and 74 years for North Americans. Fig. S1displays a similar gap between the two countries with the most respondents in the survey: China (median 28 years) and USA (median 76 years). Similarly, the aggregate year for a 50% probability for automation of each job we asked about (including truck driver and surgeon) was predicted to be earlier by Asians than by North Americans (TableS2). Note that we used respondents’ undergraduate institution as a proxy for country of origin and that many Asian respondents now study or work outside Asia.
Was our sample representative?
One concern with any kind of survey is non-response bias; in particular, researchers with strong views may be more likely to fill out a survey. We tried to mitigate this effect by making the survey short (12 minutes) and confidential, and by not mentioning the survey’s content or goals in our invitation email. Our response rate was 21%. To investigate possible non-response bias, we collected demographic data for both our respondents (n=406) and a random sample (n=399) of NIPS/ICML researchers who did not respond. Results are shown in Table S3. Differences between the groups in citation count, seniority, gender, and country of origin are small. While we cannot rule out non-response biases due to unmeasured variables, we can rule out large bias due to the demographic variables we measured. Our demographic data also shows that our respondents included many highly-cited researchers (mostly in machine learning but also in statistics, computer science theory, and neuroscience) and came from 43 countries (vs. a total of 52 for everyone we sampled). A majority work in academia (82%), while 21% work in industry.
A second concern is that NIPS and ICML authors are representative of machine learning but not of the field of artificial intelligence as a whole. This concern could be addressed in future work by surveying a broader range of experts across computer science, robotics, and the cognitive sciences. In fact, a 2017 survey by Walsh [12] asked a broad range of AI and robotics experts a question about HLMI almost identical to ours. For a 50% chance of HLMI, the median prediction in this survey was 2065 for robiticists and 2061 for AI experts. Our machine learning experts predicted 2057. This is very close Walsh’s results and suggests that our conclusions about expert views on HLMI are robust to surveying experts outside machine learning.1 It’s still possible that groups of experts differ on topics other than HLMI timelines.
Discussion
Why think AI experts have any ability to foresee AI progress? In the domain of political science, a long-term study found that experts were worse than crude statistical extrapolations at predicting political outcomes [14]. AI progress, which relies on scientific breakthroughs, may appear intrin-sically harder to predict. Yet there are reasons for optimism. While individual breakthroughs are unpredictable, longer term progress in R&D for many domains (including computer hardware, ge-nomics, solar energy) has been impressively regular [15]. Such regularity is also displayed by trends [8] in AI performance in SAT problem solving, games-playing, and computer vision and could be exploited by AI experts in their predictions. Finally, it is well established that aggregating indi-vidual predictions can lead to big improvements over the predictions of a random indiindi-vidual [16]. Further work could use our data to make optimized forecasts. Moreover, many of the AI milestones (Fig. 2) were forecast to be achieved in the next decade, providing ground-truth evidence about the reliability of individual experts.
1The difference in medians between us and Walsh is tiny compared to differences between Asians and North Americans in our study and does not provide evidence of a substantial difference between groups of experts.
References
[1] Peter Stone, Rodney Brooks, Erik Brynjolfsson, Ryan Calo, Oren Etzioni, Greg Hager, Julia Hirschberg, Shivaram Kalyanakrishnan, Ece Kamar, Sarit Kraus, et al. One hundred year study on artificial intelligence: Report of the 2015-2016 study panel. Technical report, Stanford University, 2016.
[2] Pedro Domingos. The Master Algorithm : How the Quest for the Ultimate Learning Machine Will Remake Our World. Basic Books, New York, NY, 2015.
[3] Nick Bostrom. Superintelligence: Paths, Dangers, Strategies. Oxford University Press, Oxford, UK, 2014.
[4] Erik Brynjolfsson and Andrew McAfee. The Second Machine Age: Work, Progress, and Prosperity in a Time of Brilliant Technologies. WW Norton & Company, New York, 2014. [5] Ryan Calo. Robotics and the lessons of cyberlaw. California Law Review, 103:513, 2015. [6] Tao Jiang, Srdjan Petrovic, Uma Ayyer, Anand Tolani, and Sajid Husain. Self-driving cars:
Disruptive or incremental. Applied Innovation Review, 1:3–22, 2015.
[7] William D. Nordhaus. Two centuries of productivity growth in computing. The Journal of Economic History, 67(01):128–159, 2007.
[8] Katja Grace. Algorithmic progress in six domains. Technical report, Machine Intelligence Research Institute, 2013.
[9] Erik Brynjolfsson and Andrew McAfee. Race Against the Machine: How the Digital Revolution Is Accelerating Innovation, Driving Productivity, and Irreversibly Transforming Employment and the Economy. Digital Frontier Press, Lexington, MA, 2012.
[10] Seth D. Baum, Ben Goertzel, and Ted G. Goertzel. How long until human-level ai? results from an expert assessment. Technological Forecasting and Social Change, 78(1):185–195, 2011. [11] Vincent C. Müller and Nick Bostrom. Future progress in artificial intelligence: A survey of expert opinion. In Vincent C Müller, editor, Fundamental issues of artificial intelligence, chapter part. 5, chap. 4, pages 553–570. Springer, 2016.
[12] Toby Walsh. Expert and non-expert opinion about technological unemployment. arXiv preprint arXiv:1706.06906, 2017.
[13] Irving John Good. Speculations concerning the first ultraintelligent machine. Advances in computers, 6:31–88, 1966.
[14] Philip Tetlock. Expert political judgment: How good is it? How can we know? Princeton University Press, Princeton, NJ, 2005.
[15] J Doyne Farmer and François Lafond. How predictable is technological progress? Research Policy, 45(3):647–665, 2016.
[16] Lyle Ungar, Barb Mellors, Ville Satopää, Jon Baron, Phil Tetlock, Jaime Ramos, and Sam Swift. The good judgment project: A large scale test. Technical report, Association for the Advancement of Artificial Intelligence Technical Report, 2012.
[17] Joe W. Tidwell, Thomas S. Wallsten, and Don A. Moore. Eliciting and modeling probability forecasts of continuous quantities. Paper presented at the 27th Annual Conference of Society for Judgement and Decision Making, Boston, MA, 19 November 2016., 2013.
[18] Thomas S. Wallsten, Yaron Shlomi, Colette Nataf, and Tracy Tomlinson. Efficiently encod-ing and modelencod-ing subjective probability distributions for quantitative variables. Decision, 3(3):169, 2016.
Supplementary Information
Survey Content
We developed questions through a series of interviews with Machine Learning researchers. Our survey questions were as follows:
1. Three sets of questions eliciting HLMI predictions by different framings: asking directly about HLMI, asking about the automatability of all human occupations, and asking about recent progress in AI from which we might extrapolate.
2. Three questions about the probability of an “intelligence explosion”. 3. One question about the welfare implications of HLMI.
4. A set of questions about the effect of different inputs on the rate of AI research (e.g., hardware progress).
5. Two questions about sources of disagreement about AI timelines and “AI Safety.” 6. Thirty-two questions about when AI will achieve narrow “milestones”.
7. Two sets of questions on AI Safety research: one about AI systems with non-aligned goals, and one on the prioritization of Safety research in general.
8. A set of demographic questions, including ones about how much thought respondents have given to these topics in the past. The questions were asked via an online Qualtrics survey. (The Qualtrics file will be shared to enable replication.) Participants were invited by email and were offered a financial reward for completing the survey. Questions were asked in roughly the order above and respondents received a randomized subset of questions. Surveys were completed between May 3rd 2016 and June 28th 2016.
Our goal in defining “high-level machine intelligence” (HLMI) was to capture the widely-discussed notions of “human-level AI” or “general AI” (which contrasts with “narrow AI”) [3]. We consulted all previous surveys of AI experts and based our definition on that of an earlier survey [11]. Their definition of HLMI was a machine that “can carry out most human professions at least as well as a typical human.” Our definition is more demanding and requires machines to be better at all tasks than humans (while also being more cost-effective). Since earlier surveys often use less demanding notions of HLMI, they should (all other things being equal) predict earlier arrival for HLMI.
Demographic Information
The demographic information on respondents and non-respondents (TableS3) was collected from public sources, such as academic websites, LinkedIn profiles, and Google Scholar profiles. Citation count and seniority (i.e. numbers of years since the start of PhD) were collected in February 2017.
Elicitation of Beliefs
Many of our questions ask when an event will happen. For prediction tasks, ideal Bayesian agents provide a cumulative distribution function (CDF) from time to the cumulative probability of the event. When eliciting points on respondents’ CDFs, we framed questions in two different ways, which we call “fixed-probability” and “fixed-years”. Fixed-probability questions ask by which year an event has an p% cumulative probability (for p=10%, 50%, 90%). Fixed-year questions ask for the cumulative probability of the event by year y (for y=10, 25, 50). The former framing was used in recent surveys of HLMI timelines; the latter framing is used in the psychological literature on forecasting [17,18]. With a limited question budget, the two framings will sample different points on the CDF; otherwise, they are logically equivalent. Yet our survey respondents do not treat them as logically equivalent. We observed effects of question framing in all our prediction questions, as well as in pilot studies. Differences in these two framings have previously been documented in the forecasting literature [17,18] but there is no clear guidance on which framing leads to more accurate predictions. Thus we simply average over the two framings when computing CDF estimates for HLMI and for tasks. HLMI predictions for each framing are shown in Fig. S2.
Statistics
For each timeline probability question (see Figures 1 and 2), we computed an aggregate distribution by fitting a gamma CDF to each individual’s responses using least squares and then taking the mixture distribution of all individuals. Reported medians and quantiles were computed on this summary distribution. The confidence intervals were generated by bootstrapping (clustering on respondents with 10,000 draws) and plotting the 95% interval for estimated probabilities at each year. The time-in-field and citations comparisons between respondents and non-respondents (Table
S3) were done using tailed t-tests. The region and gender proportions were done using two-sided proportion tests. The significance test for the effect of region on HLMI date (Table S2) was done using robust linear regression using the R function rlm from the MASS package to do the regression and then the f.robtest function from the sfsmisc package to do a robust F-test significance.
Supplementary Figures
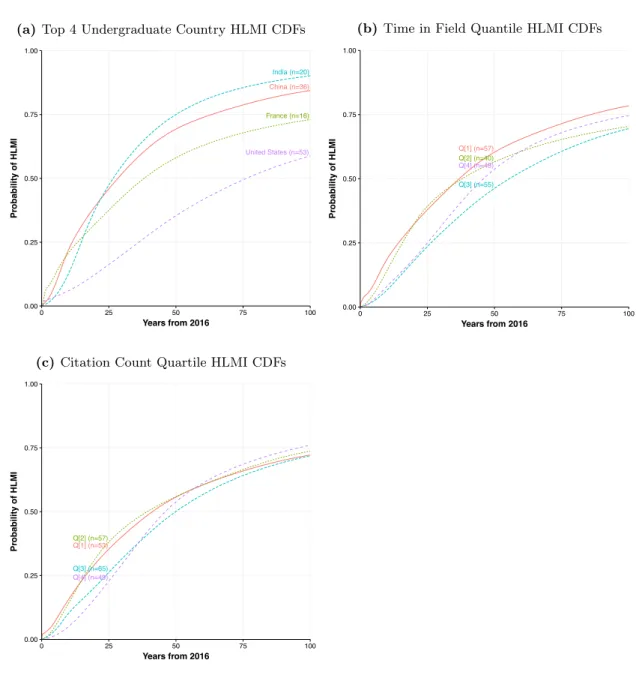
(a) Top 4 Undergraduate Country HLMI CDFs
China (n=36) France (n=16) India (n=20) United States (n=53) 0.00 0.25 0.50 0.75 1.00 0 25 50 75 100 Years from 2016 Pr obability of HLMI
Top 4 Undergrad Country HLMI CDFs (b) Time in Field Quantile HLMI CDFs
Q[1] (n=57) Q[2] (n=40) Q[3] (n=55) Q[4] (n=48) 0.00 0.25 0.50 0.75 1.00 0 25 50 75 100 Years from 2016 Pr obability of HLMI
Time in Field Quartile HLMI CDFs
(c) Citation Count Quartile HLMI CDFs
Q[1] (n=53) Q[2] (n=57) Q[3] (n=65) Q[4] (n=49) 0.00 0.25 0.50 0.75 1.00 0 25 50 75 100 Years from 2016 Pr obability of HLMI
HLMI CDF By Citation Count Quartile
Figure S1: Aggregate subjective probability of HLMI arrival by demographic group. Each graph curve is an Aggregate Forecasts CDF, computed using the procedure described in Figure 1 and in “Elicitation of Beliefs.” FigureS1ashows aggregate HLMI predictions for the four countries with the most respondents in our survey. FigureS1bshows predictions grouped by quartiles for seniority (measured by time since they started a PhD). FigureS1cshows predictions grouped by quartiles for citation count. “Q4” indicates the top quartile (i.e. the most senior researchers or the researchers with most citations).
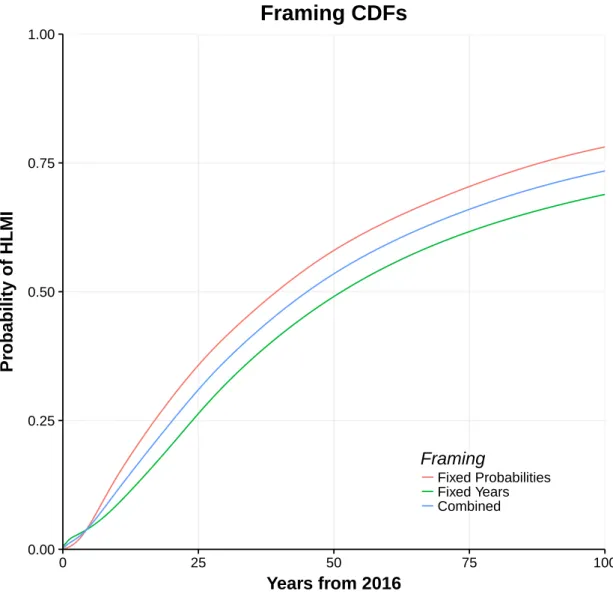
0.00 0.25 0.50 0.75 1.00 0 25 50 75 100
Years from 2016
Pr
obability of HLMI
Framing
Fixed Probabilities Fixed Years CombinedFraming CDFs
Figure S2: Aggregate subjective probability of HLMI arrival for two framings of the question. The “fixed probabilities” and “fixed years” curves are each an aggregate forecast for HLMI predictions, computed using the same procedure as in Fig. 1. These two framings of questions about HLMI are explained in “Elicitation of Beliefs” above. The “combined” curve is an average over these two framings and is the curve used in Fig.1.
Supplementary Tables
S1: Automation Predictions by Researcher Region
This question asked when automation of the job would become feasible, and cumulative proba-bilities were elicited as in the HLMI and milestone prediction questions. The definition of “full automation” is given above (p.1). For the “NA/Asia gap”, we subtract the Asian from the N. American median estimates.
Table S1: Median estimate (in years from 2016) for automation of human jobs by region of undergraduate institution
Question Europe N. America Asia NA/Asia gap
Full Automation 130.8 168.6 104.2 +64.4
Truck Driver 13.2 10.6 10.2 +0.4
Surgeon 46.4 41.0 31.4 +9.6
Retail Salesperson 18.8 20.2 10.0 +10.2
AI Researcher 80.0 123.6 109.0 +14.6
S2: Regression of HLMI Prediction on Demographic Features
We standardized inputs and regressed the log of the median years until HLMI for respondents on gender, log of citations, seniority (i.e. numbers of years since start of PhD), question framing (“fixed-probability” vs. “fixed-years”) and region where the individual was an undergraduate. We used a robust linear regression.
Table S2: Robust linear regression for individual HLMI predictions
term Estimate SE t -statistic p-value Wald F
-statistic (Intercept) 3.65038 0.17320 21.07635 0.00000 458.0979 Gender = “female” -0.25473 0.39445 -0.64578 0.55320 0.3529552 log(citation_count) -0.10303 0.13286 -0.77546 0.44722 0.5802456 Seniority (years) 0.09651 0.13090 0.73728 0.46689 0.5316029 Framing = “fixed_probabilities” -0.34076 0.16811 -2.02704 0.04414 4.109484 Region = “Europe” 0.51848 0.21523 2.40898 0.01582 5.93565 Region = “M.East” -0.22763 0.37091 -0.61369 0.54430 0.3690532 Region = “N.America” 1.04974 0.20849 5.03496 0.00000 25.32004 Region = “Other” -0.26700 0.58311 -0.45788 0.63278 0.2291022
S3: Demographics of Respondents vs. Non-respondents
There were (n=406) respondents and (n=399) non-respondents. Non-respondents were randomly sampled from all NIPS/ICML authors who did not respond to our survey invitation. Subjects with missing data for region of undergraduate institution or for gender are grouped in “NA”. Missing data for citations and seniority is ignored in computing averages. Statistical tests are explained in section “Statistics” above.
Table S3: Demographic differences between respondents and non-respondents
Undergraduate region Respondent pro-portion Non-respondent proportion p-test p-value Asia 0.305 0.343 0.283 Europe 0.271 0.236 0.284 Middle East 0.071 0.063 0.721 North America 0.254 0.221 0.307 Other 0.015 0.013 1.000 NA 0.084 0.125 0.070
Gender Respondent proportion Non-respondent proportion p-test p-value
female 0.054 0.100 0.020
male 0.919 0.842 0.001
NA 0.027 0.058 0.048
Variable Respondent estimate Non-respondent estimate statistic p-value
Citations 2740.5 4528.0 2.55 0.010856
log(Citations) 5.9 6.4 3.19 0.001490
S4: Survey responses on AI progress, intelligence explosions, and AI
Safety
Three of the questions below concern Stuart Russell’s argument about highly advanced AI. An excerpt of the argument was included in the survey. The full argument can be found here:
www.edge.org/conversation/the-myth-of-ai#26015. Extremely good On balance good Neutral On balance bad Extremely bad (e.g human extinction)
Chance HLMI has positive or negative long run impact on humanity (median answers)
20% 25% 20% 10% 5%
10% chance 50% chance 90% chance
Time until 'full automation of labor' 50 years 100 years 200 years
First half
(decelerating) About equal
Second half (accelerating)
Progress faster in 1st or 2nd half of
your career? 11% 24% 65%
2 years after 30 years after
Chance global technological progress
dramatically increases after HLMI 20% 80%
Quite likely (81-100%) Likely (61-80%) About even (41-60%) Unlikely (21-40%) Quite unlikely (0-20%)
Chance intelligence explosion
argument is broadly correct 12% 17% 21% 24% 26%
No, not a real problem. No, not an important problem. Yes, a moderately important problem. Yes, an important problem.
Yes, among the most important
problems in the field.
Does Stuart Russell's argument for why highly advanced AI might pose a risk point at an important problem?
11% 19% 31% 34% 5%
Much less valuable Less valuable
As valuable as other
problems More valuable
Much more valuable
Value of working on this problem now,
compared to other problems in the field 22% 41% 28% 7% 1.4%
Much easier Easier
As hard as
other problems Harder Much harder
Difficulty of problem, relative to
other problems in the field 7% 19% 42% 23% 10%
Much less Less
About the same
as it is now More Much more
How much should society prioritize 'AI Safety Research'?
(included capabilities vs.
minimizing potential risks definition)
5% 6% 41% 35% 12%
Very little A little
A moderate
amount A lot A great deal
How much have you thought about when
HLMI (or similar) will be developed? 6% 27% 28% 31% 8%
S5: Description of AI Milestones
The timelines in Figure2 are based on respondents’ predictions about the achievement of various milestones in AI. Beliefs were elicited in the same way as for HLMI predictions (see “Elicitation of Beliefs” above). We chose a subset of all milestones to display in Figure 2 based on which milestones could be accurately described with a short label.
Table S5: Descriptions of AI Milestones
Milestone Name Description n In Fig. 2 median
(years) Translate New Language with
’Rosetta Stone’
Translate a text written in a newly discovered language into English as well as a team of human experts, us-ing a sus-ingle other document in both languages (like a Rosetta stone). Suppose all of the words in the text can be found in the translated docu-ment, and that the language is a difficult one.
35 16.6
Translate Speech Based on Subtitles
Translate speech in a new language given only unlim-ited films with subtitles in the new language. Suppose the system has access to train-ing data for other languages, of the kind used now (e.g., same text in two languages for many languages and films with subtitles in many lan-guages).
38 10
Translate (vs. amateur hu-man)
Perform translation about as good as a human who is flu-ent in both languages but unskilled at translation, for most types of text, and for most popular languages (in-cluding languages that are known to be difficult, like Czech, Chinese and Arabic).
42 X 8
Telephone Banking Operator Provide phone banking ser-vices as well as human op-erators can, without annoy-ing customers more than hu-mans. This includes many one-off tasks, such as helping to order a replacement bank card or clarifying how to use part of the bank website to a customer.
Make Novel Categories Correctly group images of previously unseen objects into classes, after training on a similar labeled dataset con-taining completely different classes. The classes should be similar to the ImageNet classes.
29 7.4
One-Shot Learning One-shot learning: see only
one labeled image of a new object, and then be able to recognize the object in real world scenes, to the extent that a typical human can (i.e. including in a wide variety of settings). For example, see only one image of a platypus, and then be able to recognize platypuses in nature photos. The system may train on la-beled images of other objects. Currently, deep networks of-ten need hundreds of exam-ples in classification tasks[1], but there has been work on one-shot learning for both classification[2] and genera-tive tasks[3].
[1] Lake et al. (2015). Build-ing Machines That Learn and Think Like People
[2] Koch (2015) Siamese Neu-ral Networks for One-Shot Image Recognition
[3] Rezende et al. (2016). One-Shot Generalization in Deep Generative Models
32 9.4
Generate Video from New Di-rection
See a short video of a scene, and then be able to construct a 3D model of the scene good enough to create a realistic video of the same scene from a substantially different an-gle.
For example, constructing a short video of walking through a house from a video taking a very different path through the house.
42 11.6
Transcribe Speech Transcribe human speech
with a variety of accents in a noisy environment as well as a typical human can.
33 X 7.8
Read Text Aloud (text-to-spech)
Take a written passage and output a recording that can’t be distinguished from a voice actor, by an expert listener.
Math Research Routinely and autonomously prove mathematical theorems that are publishable in top mathematics journals today, including generating the the-orems to prove.
31 X 43.4
Putnam Math Competition Perform as well as the best human entrants in the
Put-nam competition—a math
contest whose questions have known solutions, but which are difficult for the best young mathematicians.
45 X 33.8
Go (same training as human) Defeat the best Go players, training only on as many games as the best Go players have played.
For reference, DeepMind’s AlphaGo has probably played a hundred million games of self-play, while Lee Sedol has probably played 50,000 games in his life[1].
[1] Lake et al. (2015). Build-ing Machines That Learn and Think Like People
42 X 17.6
Starcraft Beat the best human
Star-craft 2 players at least 50 Starcraft 2 is a real time strategy game characterized by:
• Continuous time play • Huge action space • Partial observability of
enemies
• Long term strategic play, e.g. preparing for and then hiding surprise attacks.
24 X 6
Quick Novice Play at Ran-dom Game
Play a randomly selected computer game, including difficult ones, about as well as a human novice, after playing the game less than 10 minutes of game time. The system may train on other games.
Angry Birds Play new levels of Angry Birds better than the best hu-man players. Angry Birds is a game where players try to effi-ciently destroy 2D block tow-ers with a catapult. For con-text, this is the goal of the IJ-CAI Angry Birds AI competi-tion.
39 X 3
All Atari Games Outperform professional
game testers on all Atari
games using no
game-specific knowledge. This includes games like Frostbite, which require planning to achieve sub-goals and have posed problems for deep Q-networks[1][2].
[1] Mnih et al. (2015). Human-level control through deep reinforcement learning. [2] Lake et al. (2015). Build-ing Machines That Learn and Think Like People
38 X 8.8
Novice Play at half of Atari Games in 20 Minutes
Outperform human novices on 50% of Atari games after only 20 minutes of training play time and no game spe-cific knowledge.
For context, the
origi-nal Atari playing deep
Q-network outperforms pro-fessional game testers on 47% of games[1], but used hundreds of hours of play to train[2].
[1] Mnih et al. (2015). Human-level control through deep reinforcement learning. [2] Lake et al. (2015). Build-ing Machines That Learn and Think Like People
33 6.6
Fold Laundry Fold laundry as well and as
fast as the median human clothing store employee.
30 X 5.6
5km Race in City (bipedal robot vs. human)
Beat the fastest human run-ners in a 5 kilometer race through city streets using a bipedal robot body.
Assemble any LEGO Physically assemble any LEGO set given the pieces and instructions, using non- specialized robotics hardware.
For context, Fu 2016[1] suc-cessfully joins single large LEGO pieces using model based reinforcement learning and online adaptation. [1] Fu et al. (2016). One-Shot Learning of Manipula-tion Skills with Online Dy-namics Adaptation and Neu-ral Network Priors
35 X 8.4
Learn to Sort Big Numbers Without Solution Form
Learn to efficiently sort lists of numbers much larger than in any training set used, the way Neural GPUs can do for addition[1], but without be-ing given the form of the so-lution.
For context, Neural Turing Machines have not been able to do this[2], but Neural Programmer-Interpreters[3] have been able to do this by training on stack traces (which contain a lot of infor-mation about the form of the solution).
[1] Kaiser & Sutskever (2015). Neural GPUs Learn Algo-rithms
[2] Zaremba & Sutskever
(2015). Reinforcement
Learning Neural Turing
Machines
[3] Reed & de Freitas (2015). Neural Programmer-Interpreters
Python Code for Simple Al-gorithms
Write concise, efficient, human-readable Python code to implement simple algo-rithms like quicksort. That is, the system should write code that sorts a list, rather than just being able to sort lists.
Suppose the system is given only:
• A specification of what counts as a sorted list • Several examples of lists
undergoing sorting by quicksort
36 8.2
Answer Factoid Questions via Internet
Answer any “easily
Googleable” factoid questions posed in natural language better than an expert on the relevant topic (with internet access), having found the answers on the internet. Examples of factoid ques-tions:
• “What is the poisonous substance in Oleander plants?”
• “How many species of lizard can be found in Great Britain?”
46 7.2
Answer Open-Ended Factual Questions via Internet
Answer any “easily
Googleable” factual but open ended question posed in natural language better than an expert on the relevant topic (with internet access), having found the answers on the internet.
Examples of open ended ques-tions:
• “What does it mean if my lights dim when
I turn on the
mi-crowave?”
• “When does home in-surance cover roof re-placement?"
Answer Questions Without Definite Answers
Give good answers in natural language to factual questions posed in natural language for which there are no definite correct answers.
For example: “What causes the demographic transition?”, “Is the thylacine extinct?”, “How safe is seeing a chiro-practor?”
47 10
High School Essay Write an essay for a
high-school history class that would receive high grades and pass plagiarism detec-tors.
For example answer a ques-tion like “How did the whaling industry affect the industrial revolution?”
42 X 9.6
Generate Top 40 Pop Song Compose a song that is good enough to reach the US Top 40. The system should out-put the complete song as an audio file.
38 X 11.4
Produce a Song Indistin-guishable from One by a Spe-cific Artist
Produce a song that is indis-tinguishable from a new song by a particular artist, e.g., a song that experienced listen-ers can’t distinguish from a new song by Taylor Swift.
41 10.8
Write New York Times Best-Seller
Write a novel or short story good enough to make it to the New York Times best-seller list.
27 X 33
Explain Own Actions in
Games
For any computer game that can be played well by a ma-chine, explain the machine’s choice of moves in a way that feels concise and complete to a layman.
38 X 10.2
World Series of Poker Play poker well enough to win the World Series of Poker.
37 X 3.6
Output Physical Laws of Vir-tual World
After spending time in a vir-tual world, output the dif-ferential equations governing that world in symbolic form. For example, the agent is placed in a game engine where Newtonian mechanics holds exactly and the agent is then able to conduct experi-ments with a ball and output Newton’s laws of motion.
Acknowledgments
We thank Connor Flexman for collecting demographic information. We also thank Nick Bostrom for inspiring this work, and Michael Webb and Andreas Stuhlmüller for helpful comments. We thank the Future of Humanity Institute (Oxford), the Future of Life Institute, and the Open Philanthropy Project for supporting this work.