HAL Id: hal-00752883
https://hal.inria.fr/hal-00752883
Submitted on 16 Nov 2012
HAL is a multi-disciplinary open access
archive for the deposit and dissemination of
sci-entific research documents, whether they are
pub-lished or not. The documents may come from
teaching and research institutions in France or
abroad, or from public or private research centers.
L’archive ouverte pluridisciplinaire HAL, est
destinée au dépôt et à la diffusion de documents
scientifiques de niveau recherche, publiés ou non,
émanant des établissements d’enseignement et de
recherche français ou étrangers, des laboratoires
publics ou privés.
Beyond CPU Frequency Scaling for a Fine-grained
Energy Control of HPC Systems
Ghislain Landry Tsafack Chetsa, Laurent Lefevre, Jean-Marc Pierson, Patricia
Stolf, Georges da Costa
To cite this version:
Ghislain Landry Tsafack Chetsa, Laurent Lefevre, Jean-Marc Pierson, Patricia Stolf, Georges da
Costa. Beyond CPU Frequency Scaling for a Fine-grained Energy Control of HPC Systems. 24th
International Symposium on Computer Architecture and High Performance Computing, Oct 2012,
New York City, United States. �hal-00752883�
Beyond CPU Frequency Scaling for a Fine-grained Energy Control of HPC Systems
Ghislain Landry Tsafack Chetsa, Laurent Lefevre INRIA, LIP Laboratory (UMR CNRS, ENS, INRIA, UCB)
ENS Lyon, Universit´e de Lyon Lyon, France
Email: {ghislain.landry.tsafack.chetsa, laurent.lefevre}@ens-lyon.fr
Jean-Marc Pierson, Patricia Stolf, Georges Da Costa IRIT (UMR CNRS)
Universit´e de Toulouse Toulouse, France
Email: {pierson, stolf, dacosta}@irit.fr
Abstract—Modern high performance computing subsystems (HPC) – including processor, network, memory, and IO – are provided with power management mechanisms. These include dynamic speed scaling and dynamic resource sleeping. Understanding the behavioral patterns of high performance computing systems at runtime can lead to a multitude of optimization opportunities including controlling and limiting their energy usage.
In this paper, we present a general purpose methodology for optimizing energy performance of HPC systems consid-ering processor, disk and network. We rely on the concept of execution vector along with a partial phase recognition technique for on-the-fly dynamic management without any a priori knowledge of the workload. We demonstrate the effectiveness of our management policy under two real-life workloads. Experimental results show that our management policy in comparison with baseline unmanaged execution saves up to 24% of energy with less than 4% performance overhead for our real-life workloads.
Keywords-energy optimization; phase identification; hard-ware performance counters; system adaptation
I. INTRODUCTION
In recent years, the number of High Performance Com-puting (HPC) systems around the world has significantly increased. This can be attributed to the fact that HPC systems are designed to achieve peak performance which in turn enable new levels of innovation and insights for organizations that seek out differentiation with excellence in fields including research and development (R&D), science, etc. For example, in order to bring superior products to market faster, a manufacturer may consider using HPC to build prototypes of its products. While it is tempting to have a HPC system constantly available to tackle big challenges, it is often costly to power and cool such an infrastructure. As a consequence, HPC systems are also ranked based on their power efficiency1, i.e., the number of Flops achieved per watt. Beside, the global information and communication technology sector has a considerable share of global carbon dioxide (CO2) emissions which is equivalent to aviation.
Over the past years, the energy consumption problem in HPC systems has widely been investigated. Although nearly all HPC subsystems – including processor, network,
1http://www.green500.org/.
memory, and IO – are provided with power saving capabil-ities, efforts for reducing the power consumption of HPC systems are directed toward the processor to the best of our knowledge. Roughly speaking, existing power saving approaches for high performance computing systems attempt to reduce the processor power consumption ignoring all other subcomponents.
To efficiently address the power consumption issue, HPC systems need to approach things differently than in the past. Processors dominate system power consumption in high performance computing; however, network intercon-nects, memory and disk altogether consume up to 24% of system power consumption [1]. With the processor added, the amount of power consumed by these subsystems exceeds 55% of system power consumption [1]. Thus, a fine-grained management of these subsystems can result in significant energy savings.
The majority of HPC workloads alternates during their life cycle between phases of different characteristics. A phase of program behaviour represents an interval of execution during which a measured program or system metric is relatively stable. The most prevalent phases in HPC workloads include memory intensive, compute intensive and communication intensive; they can guide any kind of energy optimization and policy decisions without substantial performance degra-dation. For example, during a memory intensive phase, the processor’s frequency can be shifted from its maximum to a lower value, and the disk sent to sleep. This does not always apply as a typical HPC system is shared by a multitude of applications each having its own characteristics in which case optimizations made for saving energy considering some applications are likely to impact the performance of others. We overcome this limitation by considering phases of the HPC system; instead of those of the workloads.
In this paper, we present an efficient runtime power man-agement architecture that is based on partial phase recog-nition and system adaptation considering some of the most power hungry HPC subsystems. Partial phase recognition consists of identifying a specific percentage of an ongoing phase with a known phase. Since the implementation of our partial phase recognition is based upon system information, it is independent of any individual application, meaning it
does not require any a priori knowledge of applications sharing the infrastructure. Independence from any individual application allows us to offer the same performance to all applications sharing the platform while saving energy.
The rest of the paper is organized as follows: In Section II prior work related to energy reduction in HPC systems is discussed. Partial phase recognition and our global approach can be found in Section III. Section IV presents and analyses experimental results. Finally, Section V concludes our work and presents future directions.
II. RELATEDWORK
In the past few years, HPC systems have witnessed the emergence of energy consumption reduction techniques from the hardware level to the software level. At the hardware level, the majority of Information Technology (IT) equipment vendors works either from bottom up, by using the most efficient components in their equipments, and/or by providing their equipments with technologies that can be leveraged to reduce energy consumption of HPC subsystems – such as processor, network, memory, and I/O – during their operation. For example, the majority of modern processors is provided with Dynamic Resource Sleeping (DRS). This technique makes components hibernate to save energy and awakes these on demand. Although major progress has been made, improvements in hardware solutions to reduce energy consumption have been slow, due to the high cost of designing equipments with energy-saving technologies and the increasing demand of raw performance. Our work combines hardware technologies and software solutions to reduce HPC systems’ energy consumption.
Unlike hardware approaches, software solutions for re-ducing HPC systems’ energy usage have received exten-sive attention of researchers over time. In [2], Rountree et al. use node imbalance to reduce the overall energy consumption of a parallel application in a HPC system. They track successive MPI communication calls to divide an application into tasks composed of a communication portion and a computation portion. A slack occurs when a processor is waiting for data during the execution of a task. This leaves the possibility to slow the processor with almost no impact on the overall execution time of the application. Rountree et al. developed Adagio which tracks task execution slacks and computes the appropriate frequency at which it should run. Although the first instance of a task is always run at the highest frequency, further instances of the same task are executed at the frequency that was computed after it is first seen. In [3], a tool called Jitter is developed to detect slack moments in performance to perform inter-node imbalance and to use DVFS to adjust the CPU frequency. Our approach differs from that implemented in Adagio in that our fine-grained data collection gives the possibility to differentiate not only computation-intensive and communication-intensive execution portions (which we
call phases/regions), but also memory-intensive portions. Memory-intensive phases can be run on a slower core without significant performance penalty [4]. They also differ in that we consider different green leverages, not only DVFS. Works done in [5], [6] use online techniques to detect applications execution phases, characterize them and set the appropriate CPU frequency accordingly. They rely on hardware monitoring counters to compute runtime statistics such as cache hit/miss ratio, memory access counts, retired instructions counts, etc., which are then used for phase detection and characterization. Policies developed in [5], [6] tend to be designed for single task environment. We overcome this limitation by considering each node of the cluster as a black box, which means that we do not focus on any application, but instead on the platform. The flexibility provided by this assumption enables us to track not ap-plications/workloads execution phases, but node’s execution phases. Our work also differs from previous works in that we use partial phase recognition instead of phase prediction. On-line recognition of communication phases in MPI application was investigated by Lim et al. in [7]. Once a communication phase is recognized, authors apply CPU DVFS to save energy. They intercept and record the sequence of MPI calls during program execution and consider a segment of program code to be reducible if there are high concentrated MPI calls or if an MPI call is long enough. The CPU is then set to run at the appropriate frequency when the reducible region is recognized again.
While having in common the use of performance counters at runtime, our work differs from those above in two major ways. First our phase detection approach does not rely on a specific HPC subsystem or MPI communication calls. Second, unlike previous research efforts, our model does not focus only on saving the energy consumed by the processor, it also takes advantage of power saving capabilities available on all other HPC subsystems.
In [8] we developed a cross platform methodology for detecting and characterizing phases in HPC systems. In this previous work we modeled the entire runtime of the system as a state graph associated with a transition matrix. The transition matrix helps determine the next state in the graph. The problem with that approach is that it takes time to get a useful transition matrix since the system may enter different configurations from one execution to another. Hence it may not work well with a system that has varying workloads. Moreover, the entire model is built off-line, while the approach proposed here runs online.
III. METHODOLOGY ANDMANAGEMENTPOLICIES High performance computing (HPC) systems are designed to offer peak performance; consequently, any management policy that aims to reduce the energy consumption must not degrade performance. To mitigate performance degradation, it is indispensable to understand the behaviour of the system
at hand at runtime. Put simply, optimization proposed is closely related to the behaviour of the system. For in-stance, scaling the CPU frequency down to its minimum when running CPU-bound workloads may cause significant performance degradation, which is unacceptable. Thus, to efficiently optimize a HPC system at runtime, it is necessary to identify the different behaviours known as phases during execution. In this section, we discuss our phase identification approach along with management policies.
A. System’s Phases Tracking and Characterizing
Our methodology relies on the concept of execution vector (EV) which is similar to power vectors (PV) in [9]. An execution vector is a column vector whose entries are system’s metrics including hardware performance counters, network byte sent/received and disk read/write counts. For convenience, we will refer to these system’s metrics as “sensors” in the rest of the paper. Each hardware per-formance counter related sensor represents the access rate to a specific hardware register over a given time interval, whereas network and disk related sensors monitor network and disk activities respectively. We refer to the literature for selecting hardware performance counters related sensors, these include: number of instructions, last level cache ac-cesses and misses, branch misses and predictions, etc. The sampling rate corresponding to the time interval after which each sensor is read depends on the granularity. While a larger sampling rate may hide information regarding the system’s behaviour, a smaller sampling rate may incur a non negligible overhead. We made a trade off of one second considering the literature. As a consequence, each execution vector is timestamped with the time at which it was sampled. In order to identify system’s execution phases, we define the resemblance or similarity between execution vectors as the manhattan distance between them. This similarity is used to cluster EVs along the execution time-line as follow: two consecutive EVs along the execution time-line belong to the same group or are similar if the manhattan distance between them is bellow a similarity threshold (denoted as ST in the following). We define the similarity threshold as a percentage of the maximum known distance between all consecutive execution vectors. For example, given a similarity threshold of 10%, two consecutive EVs belong to the same group if the manhattan distance between them is less than 10% of the maximum existing distance between all consecutive execution vectors. Computing the maximum existing distance between consecutive execution vectors at runtime is quite straightforward; the process is summarized in the following algorithm:
• initially (the beginning of the execution time-line), the maximum existing distance between all consecutive EVs referred to as dmax is set to zero.
• at time ti+1, if di+1,i> dmax then dmax di+1,i
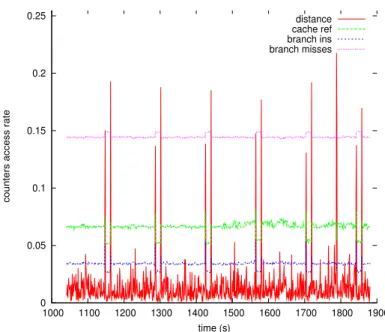
0 0.05 0.1 0.15 0.2 0.25 1000 1100 1200 1300 1400 1500 1600 1700 1800 1900
counters access rate
time (s)
distance cache ref branch ins branch misses
Figure 1. Phase identification using the similarity between consecutive
execution vector as phase identification metric. This is a zoomed-in view of the traces collected on one node when the system was running Molecular Dynamics Simulation; “distance” represents the variation of the distance between consecutive execution vectors.
Where di+1,i is the the manhattan distance between EVs sampled at time ti and ti+1 respectively.
By definition, the manhattan distance between two points in an n-dimensional space is the distance between them if a grid-like path is followed. The manhattan distance offers the advantage that it does not depend on the translation of the coordinate system with respect to a coordinate axis, i.e., it weighs more heavily differences in each dimension.
Knowing that the behaviour of the system is relatively stable during a phase (a phase is a time period during which the behaviour of the system is stable) and assuming that this stability is translated into execution vectors sampled during that phase, we define a phase as any behaviour delimited by two successive manhattan distances exceeding the similarity threshold. Therefore, considering Figure 1, where the x-axis represents the execution time-line; with a similarity threshold of 50% and assuming the maximum manhattan distance between two consecutive execution vectors along the execution time-line is 0.2; we can observe seven phases separated by six micro-phases or transition phases (0.1 is 50% of 0.2; referring to the definition of a phase, phases are delimited by distances greater than 0.1). We can also notice that these phases correspond to variations reported in the access rate of plotted performance counters.
The rationale behind phase tracking is the use of charac-teristics of known phases for optimizing similar phases. An effective phase characterization is therefore needed. To this extend, once a phase is detected, we perform the Principal Component Analyses (PCA) on the dataset composed of
EVs pertaining to that phase. After PCA, five sensors among those contributing less to the first principal axes of PCA are kept for phase characterization (PCA can be seen as a variable reduction procedure, it helps finding underlying factors that shape the data). This choice is motivated by the assumption that information regarding what the system did not do during a phase is captured by sensors contributing less to the first principal axes of PCA. These 5 sensors characterise the phase. In addition, we associate each newly detected phase with a reference vector and its duration. The reference vector is the closest vector to the centroid of the group of vectors sampled during the phase. This reference vector is later used for partial phase recognition.
B. Partial Phase Recognition and System Adaptation A phase cannot be detected unless it is finished, in which case any system adaptation or optimization accordingly is no longer worth. The literature recommends phase predic-tion. Predicting the next phase permits adapting the system accordingly. Although phase prediction is very effective in some cases, it is not relevant in this context, for we do not have any a priori knowledge of applications sharing the platform. To overcome this limitation, we use partial phase recognition.
Partial phase recognition consists of identifying an ongo-ing phase (the phase has started and is not yet finished) Pi with a known phase Pj only considering the already exe-cuted part of Pi. The already executed part of Pi expressed as a percentage of the length (duration) of Pj is referred to as the recognition threshold RT . Thus, with a RT % recognition threshold, and assuming that the reference vector of Pj is EVPj and that its length is nj; an ongoing phase
Pi is identified with Pj if the manhattan distance between EVPj and each EV pertaining to the already executed
part of Pi (corresponding in length to RT % of nj) is within the similarity threshold ST . The following algorithm summarizes partial phase recognition.
• lets consider pia phase, and vi its reference vector, ni its duration
• pj is partially identify with pi if – pj lasts RT% ni
– 8vj EV of pj, the distance between vj and vi is within threshold
We use partial phase recognition to guide system adapta-tion considering three HPC subsystems: processor, disk and network interconnect. For the processor, we consider three computational levels according to the characteristics of the workload:
• high or cpu-bound: the cpu-bound computational level corresponds to the maximum available CPU frequency, and is used for CPU-bound workloads;
• medium or memory-bound: corresponds to an average in between the maximum and the minimum available
frequencies; it is mainly used for memory-bound work-loads.
• low: the system is in the low computational level when the processor is set to its lowest frequency.
For the disk, we define two states: active and sleep; where active includes both the disk’s active and standby modes. Finally, for the network interconnect we define two data transfer speeds:
• the communication-intensive speed: corresponds to the highest available transfer rate of the network card; • low-communication speed: where the speed of the
network interconnect is set to the lowest speed. To better understand how our partial phase recognition translates phase characteristics at runtime, we trace the CPU frequency settings for some nodes involved in the compu-tation. Figure 2 – where the x-axis represents the execution time-line and the y-axis the normalized frequencies (0.2 and 0.253 corresponding to 2 GHz and 2.53 GHz respectively) – shows Molecular Dynamics Simulation (MDS) [10] traces. For the sake of clarity, only the frequency settings of three nodes among twenty five are plotted. Figure 2 indicates that, although running the same application, different settings may apply on different nodes at the same time. This can be attributed to the fact that on a node frequencies changes depend on the behaviour of the node rather than that of the application.
As we mentioned earlier in this paper, principal compo-nent analysis (PCA) is applied to vectors belonging to any newly created phase for selecting five sensors which are used as phase characteristics. These characteristics are translated to system adaptation as detailed in Table I, where the left column lists sensors selected from PCA and the right, the associated decisions. For example, when sensors selected for characterizing a phase does not include any IO-related sensor, we assume the system is running a compute intensive workload in which case the processor is set to its maximum, the disk sent to sleep and the network interconnect speed scaled down. Note in passing that changing the disk’s state from sleep state to active state does not appear in Table I, this is because the disk automatically enters the active state when it is accessed.
IV. EXPERIMENTATION ANDVALIDATION A. Evaluation Platform
Our evaluation support is a twenty five node cluster set up on the french large scale experimental platform, Grid5000 [11]. Each node is an Intel Xeon X3440 with 4 cores and 16 GB of RAM. Available frequency steps for each core are: 2.53 GHz, 2.40 GHz, 2.27 GHz, 2.13 GHz, 2.00 GHz, 1.87 GHz, 1.73 GHz, 1.60 GHz, 1.47 GHz, 1.33 GHz and 1.20 GHz. During our experiments, low computational level always sets the CPU frequency to the lowest available which is 1.20 GHz, whereas high and medium computational levels
Table I
TRANSLATION OF PHASE CHARACTERISTICS INTO SYSTEM ADAPTATION
(IORELATED SENSORS INCLUDE NETWORK AND DISK ACTIVITIES).
Sensors selected from PCA Decisions
for phase characterization
cache references & CPU frequency set to its maximum
cache misses & spin down the disk
IO related sensors network speed scaled down
no IO related sensor CPU frequency set to its lowest
network speed scaled up
instructions & CPU frequency set to its minimum
last level cache misses (llc) network speed scaled up
instructions or llc & CPU frequency set to its average value
IO related sensors network speed scaled down
spin down the disk
IO related sensors CPU frequency set to its maximum
spin down the disk network speed scaled down
0 500 1000 1500 2000 node 4 0 500 1000 1500 2000 normalized frequency times (s) node 3 0.15 0.2 0.25 0.3 0 500 1000 1500 2000 node 2
Figure 2. Frequency traces resulting from our management approach. To improve the readability, some frequencies were multiplied by a constant.
set the CPU frequency to the highest available (2.53 GHz) and 2.00 GHz respectively. These values are selected based on empirical evidence; prior experiments we ran indicated that the gab between selected frequencies is somehow im-portant. For example, running the system at 2.00 GHz rather than 1.87 GHz may have an impact on performance, without necessary improving energy performance. Each node uses a SATA II hard drive which supports active, sleep and standby states. Infiniband-20G is used for interconnecting nodes. Linux kernel 2.6.35 is installed on each node where perf event is used to read the hardware monitoring counters. MPICH is used as MPI library. For the experiments, we use two real life applications: Molecular Dynamics Sim-ulation (MDS) [10] and the Advance Research Weather Research and Forecasting (WRF-ARW) model [12], [13]. WRF-ARW is a fully compressible conservative-form
non-hydrostatic atmospheric model. It uses an explicit time-splitting integration technique to efficiently integrate the Euler equation. The classical Molecular Dynamics solves numerical Newton’s equations of motion for the interaction of the many particles system. We monitored each node’s power usage on a per second basis using a power distribution unit. To perform CPU frequency scaling and network speed scaling, we use Linux kernel frameworks CPUFreq and Ethtool respectively (for further information about these tools refer to the documentation available in Linux kernel source).
B. Results Analyses and Discussion
For evaluation, we compare our management policy (re-ferred to as managed) with two other classical system’s configuration: on-demand and performance. The on-demand configuration refers to the configuration in which the default Linux on-demand governor is enabled on each individual node of the system; whereas under the performance con-figuration, Linux performance governor is enabled on each node of the system.
We also consider two levels of system adaptation: • system adaptation level one: It corresponds to the
situation in which only processor related optimization are made.
• system adaptation level two: It embraces level one, and additionally considers optimizing the interconnect and the disk.
All results presented in this section were obtained consid-ering a similarity threshold ST of 5% for phase detection and a 10% recognition threshold RT for partial phase recog-nition. These values were chosen based on past experiments. Although Intel Xeon X3440 processors offer support for Turbo boost, that feature was disabled during the course of these experiments.
1) System Adaptation Level One: Processor’s Only Op-timization: Once partial recognition is successful, meaning an ongoing phase is identified with an existing phase, the characteristics of the existing phase are used for setting the processor’s frequency accordingly. Diagrams of Figure 3 and Figure 4 present the average energy consumption and execution time of the two considered applications under different system’s configurations. These diagrams indicates that our management policy can save up to 19% of the total energy consumption with less than 4% performance degradation.
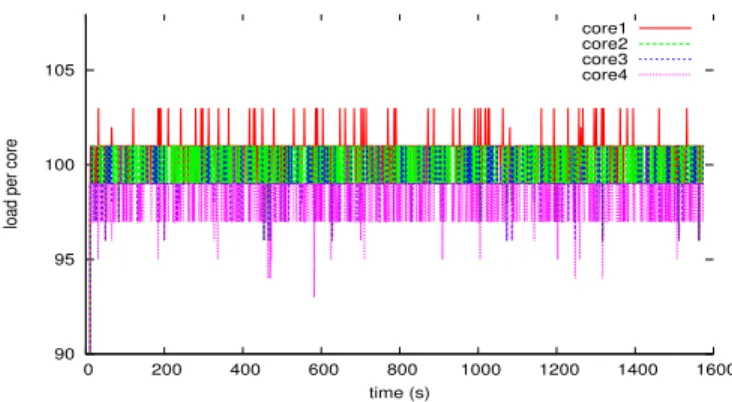
The diagrams of Figure 4 shows that on-demand and per-formance governors nearly achieve the same perper-formance. This is because Linux on-demand governor do not lower the CPU frequency unless the system load decreases below a threshold. Traces of CPU load under WRF-AWR for some nodes of our cluster are shown in Figure 5. The plot indicates that the CPU load remains above 85%, in which case the on-demand and performance governors almost have
0 % 20 % 40 % 60 % 80 % 100 % MDS WRF-ARW
Normalized energy consumption
performance managed on-demand
Figure 3. Phase tracking and partial recognition guided CPU optimization results: the chart shows average energy consumed by each application under different configurations. 0 % 20 % 40 % 60 % 80 % 100 % MDS WRF-ARW
Normalized execution time
performance managed on-demand
Figure 4. Phase tracking and partial recognition guided CPU optimization results: the chart shows average execution time of each application under different configurations.
the same behaviour. With processor’s only optimization, our management policy differs from that of the Linux’s on-demand governor in that we do not use the system’s load as system adaptation metric, which enables us to be better.
2) System Adaptation Level Two: Processor, Disk and Network Optimization: Figure 6 presents the energy perfor-mance considering the processor, disk and network. These graphs indicate that considering the processor along with
90 95 100 105
0 200 400 600 800 1000 1200 1400 1600
load per core
time (s)
core1 core2 core3 core4
Figure 5. Load traces for one of the nodes: the cluster was running WRF-AWR under the on-demand configuration.
0 % 20 % 40 % 60 % 80 % 100 % MDS WRF-ARW
Normalized energy consumption
performance managed on-demand
Figure 6. Phase tracking and partial recognition guided processor, disk and network interconnect optimization results: the chart shows average energy consumed by each application under different configurations.
disk and network interconnect improves energy performance up to 24% with the same performance degradation as with processor’s only optimization. Roughly speaking the disk and network allow to save an additional 5%, which is an interesting result given that the energy consumed by both the network and the disk represents 8% of the energy consumed by a typical supercomputer [1].
V. CONCLUSION
In this paper, we demonstrate that the problem of energy consumption in high performance computing can benefit from more than CPU frequency scaling. We introduce an on-line or runtime methodology for improving energy per-formance of HPC systems considering three HPC subsys-tems: processor, disk and network interconnect. As proof of concept, we implemented and evaluated a prototype of our management policy. Experimental results prove the effectiveness of our system adaptation policy using partial phase recognition under real-life workloads. Comparison with baseline unmanaged execution shows that our manage-ment policy can save up to 19% of energy with less than 4% performance loss only considering the processor and up to 24% considering processor, disk and network interconnect. We expect our approach to be extended to a large num-ber of energy-aware clusters for optimizing their energy consumption, given that it does not require any a priori knowledge of applications/workloads sharing the platform.
Future work includes investigating memory optimization and integrating workload consolidation and task migration to our management policy.
ACKNOWLEDGMENT
This work is supported by the INRIA large scale initiative Hemera focused on “developing large scale parallel and distributed experiments”. Some experiments of this article were performed on the Grid5000 platform, an initiative from the French Ministry of Research through the ACI GRID incentive action, INRIA, CNRS and RENATER and other contributing partners (http://www.grid5000.fr).
REFERENCES
[1] Y. Liu and H. Zhu,“A survey of the research on power management techniques for high-performance systems, Softw. Pract. Exper., 2010.
[2] Rountree B, Lowenthal D, Supinski B, Schulz M, Freeh V, Bletsch T, “Adagio: making DVS practical for complex HPC applications,” in Proceedings of the 23th International Conference on Supercomputing (ICS09). Yorktown Heights, New York, USA. 812 Jun., 2009; 460-469.
[3] Kappiah N, Freeh V, Lowenthal D, “Just in time dynamic voltage scaling: exploiting inter-node slack to save energy in mpi programs,” in Proceedings of the 19th ACM/IEEE Conference on Supercomputing (SC05). Washington, USA. 12-18 Nov., 2005, 33-41.
[4] R. Kotla, A. Devgan, S. Ghiasi, T. Keller and F. Rawson, “Characterizing the Impact of Different Memory-Intensity Lev-els,” in IEEE 7th Annual Workshop on Workload Characteri-zation (WWC-7), Oct. 2004.
[5] K. Choi, R. Soma, and M. Pedram, “Fine-grained dynamic voltage and frequency scaling for precise energy and perfor-mance tradeoff based on the ratio of off-chip access to on-chip computation times,” IEEE Trans. Comput.-Aided Design Integr. Circuits Syst., vol. 24, no. 1, pp. 18-28, Jan. 2005. [6] C. Isci, G. Contreras, and M. Martonosi,“Live, runtime phase
monitoring and prediction on real systems with application to dynamic power management,” in Proc. MICRO, 2006, pp. 359-370.
[7] Lim M, Freeh V, Lowenthal D, “Adaptive, transparent fre-quency and voltage scaling of communication phases in mpi programs,” in Proceedings of the 20th ACM/IEEE Conference on Supercomputing (SC06). Tampa, Florida, USA. 11-17 Nov., 2006; 14-27.
[8] G.L. Tsafack, L. Lefevre, J.M. Pierson, P. Stolf, and G.D. Costa, “DNA-inspired Scheme for Building the Energy Profile of HPC Systems,” in proceedings of the First Inter-national Workshop on Energy-Efficient Data Centres, Madrid, Spain, May 2012.
[9] C. Isci and M. Martonosi, “Identifying program power phase behavior using power vectors,” in Workshop on Workload Characterization, September 2003.
[10] K. Binder, J. Horbach, W. Kob, W. Paul, F. Varnik “Molecular Dynamics Simulations” Journal of Physics: Condensed Matter 16, S429-S453, 2004.
[11] Raphael Bolze, Franck Cappello, Eddy Caron, Michel Dayde, Frederic Desprez, Emmanuel Jeannot, Yvon Jegou, Stephane Lanteri, Julien Leduc, Noredine Melab, Guillaume Mornet, Raymond Namyst, Pascale Vicat-Blanc Primet, Benjamin Quetier, Olivier Richard, El-Ghazali Talbi, and Irena Touche, “Grid 5000: a large scale and highly reconfigurable experimen-tal grid testbed,” International Journal on High Performance Computing Applications, 20(4):481-494, 2006.
[12] The Weather Research and Forecasting Model, http://wrf-model.org
[13] W. C. Skamarock, J. B. Klemp, J. Dudhia, D. Gill, D. Barker, W. Wang, J. G. Powers, “A description of the Advanced Research WRF Version 2,” NCAR Technical Note NCAR/TN-468+STR (2005).
[14] H. Trevor, T. Robert and F. Jerome, “The Elements of Statistical Learning. Springer Series in Statistics,” New York, NY, USA, 2001.