HAL Id: halshs-00079721
https://halshs.archives-ouvertes.fr/halshs-00079721
Submitted on 14 Mar 2007HAL is a multi-disciplinary open access archive for the deposit and dissemination of sci-entific research documents, whether they are pub-lished or not. The documents may come from teaching and research institutions in France or abroad, or from public or private research centers.
L’archive ouverte pluridisciplinaire HAL, est destinée au dépôt et à la diffusion de documents scientifiques de niveau recherche, publiés ou non, émanant des établissements d’enseignement et de recherche français ou étrangers, des laboratoires publics ou privés.
Alain Bonnafous, Pablo Jensen
To cite this version:
Alain Bonnafous, Pablo Jensen. Ranking Transport Projects by their Socioeconomic Value or Financial Interest rate of return?. WCTRS, ITU. 10th World Conference on Transport Research - WCTR’04, 4-8 juillet 2004, Istanbul, Turkey - (Selected Proceedings), 2005, Lyon, France. 12 p. �halshs-00079721�
Ranking Transport Projects by their Socioeconomic Value or
Financial Interest rate of return?
Alain Bonnafous, Laboratoire d’Economie des Transports [email protected]
Pablo Jensen, Laboratoire d’Economie des Transports and Laboratoire de Physique
de la Matière Condensée et des Nanostructures
Abstract
This paper discusses the choice by the public authority of the most efficient programme of infrastructure investments. More specifically, it studies the optimal ranking of the projects implementations when these projects are partially self-financed by their own revenues such as tolled highways. In this case, the optimal investment programme must be defined under a constraint of annual subsidies. This paper demonstrates that the optimal ranking is not necessarily the ranking of decreasing socio-economic IRR.
This counter-intuitive result can be demonstrated by a general approach. Analytical calculations are not useful in this discrete problems because each programme is an ordered subset of projects. Therefore, there is no continuous variation linking the various programmes and the usual tools of optimisation are useless, such as differential calculus. Thus, we adopt here a discrete optimisation analysis based on standard techniques in the physics area, such as Monte Carlo sampling.
1. Introduction
Along the last century, the casting in the transport sector was apparently clear between private actors and the public sector. For instance, public authorities were generally in charge of financing and building new infrastructures. Nevertheless, an inflexion was observed during the nineties with a significant development of public-private partnership (PPP).
This paper deals with the new issues raised by the PPP system or, more generally, by any system in which the new infrastructure is partially financed by its users. Is there, in this case, a new economic rationality of public authorities? Particularly, is there an optimal way to rank projects?
Before proposing some answers to this question, we briefly present a historical perspective of this new trend, showing that there is a paradox. After this, we calculate the amount of subsidies needed to transform any project into a profitable project. We then show that, when public subsidies are reduced, the priority of a given project is not adequately given by its Socio Economic Internal Rate of
Return (IRRse), but by a combination of its Socio Economic Net Present Value and the amount of subsidies it needs to become profitable. We demonstrate the relevance of our criterion by optimization algorithms previously developed for physical systems.
2. A clear but paradoxical trend
The practices of involving the private sector in financing, building and operating new infrastructures are increasingly observed. Thus, for developing countries, the World Bank registered1 during the period 1990-2000, among 2500 PPP projects, 675 which were in the transport sector, representing an investment budget of 135 billions $. The OECD countries were similarly involved in new experiences such as the last tolled highways in France or some international high speed railways (Eurotunnel, Perpignan-Figueras,…). Three sets of reasons are usually given to justify this private sector involvement.
The first set of reasons, which are the most frequently mentioned, relate to the ability of a private operator to manage the construction and operation of the project more efficiently. This amounts to assuming that the financial Internal Rate of Return (IRR) of the project is not the same depending on whether it is managed by an administration or public body or by a company which in theory keeps abreast of the progress in optimization techniques which is taking place all the time. This difference is explained in many ways: the private sector pays some categories of staff less well, is more flexible, offers faster construction times which speed up the return on investment and is also more able to resist political demands which generate additional costs.
The second set of justifications is particularly relevant to countries which are relatively unaccustomed to tolled infrastructure. J.A. GOMEZ-IBANEZ and J.R. MEYER (1993) have observed that people are reluctant to accept tolls in the case of state-owned infrastructure but quite willing to do so when the infrastructure is financed by a private company. Bringing in the private sector is therefore often the only way of applying the "user pays" principle.
The third set of justifications for the use of private finance relates to excessive public debt, either for the public sector operator taking on the project or the nation as a whole. In the case of the public sector operator, even if the debt associated with a project can be paid back by future revenue, the operator's additional debts can have adverse impacts on its rating on the financial markets. More generally, the national government may wish to limit public debt. For example, the countries in the European Economic and Monetary Union have been obliged to meet a public debt convergence criterion (a maximum of 60% of GNP). Apart from this specific case, any country with a national debt can wish to free itself from the "snowballing effect" by which debt charges increase the burden of the debt whenever interest rates are higher than the nominal rate of growth.
Nevertheless, these justifications were not less relevant thirty years ago and it seems paradoxical that private company involvement in the development of major transport infrastructure is increasing at a time when the projects that remain to be constructed are considerably less profitable than those that are already in service.
In the case of tolled roads for instance, in the three main countries concerned in Europe, France, Spain and Italy, there are already 28000 km into service. That means that the main corridors and the more profitable axes are operated from a long time. The situation is similar for the new high speed railways: the most profitable lines are already or will be soon in service and for the next projects the financial IRR are not sufficient for a self-financing.
The paradox of the appearance (or reappearance) of the PPP in these circumstances has been already explained (Bonnafous, 2001) and deals with the formalization of the need of subsidies we will propose in the paragraph 3. Beforehand, we have to recall the logic of investment for both the private operator and the public sector in order to explore the financial logic of a PPP.
3. The encounter of public and private investors
From the classical point of view of microeconomics, it is assumed that a private operator implements a project if the expected IRR covers:
- the market interest rate,
- plus a risk premium which takes account of the uncertainties that necessarily affect assessments of, for example, costs and future traffic and revenue2,
- plus a profit margin.
Thus, with a market interest rate of 4 %, a risk premium of 4 % and a profit margin of 4 % too, the minimum targeted IRR will be 12 %. If the IRR of the project is any lower than this the operator will require a subsidy in order to reach 12 %.
The public authority is likewise using the IRR of the project, namely the discount rate which cancels out its Net Present Value (NPV). Nevertheless the valuation of this NPV takes into account not only the future accounting of the operation but also those of concurrent operators and, more generally earns and losses of all the concerned agents, including external effects such as the users surplus, consequences on safety or environmental effects. For this socio-economic assessment, we will use the notation IRRse for the internal rate of return.
In the tradition of public evaluation, a project is considered to be implemented when its IRRse is higher than a standard level3. This border-line can be interpreted as a collective profitability condition: for any project having a lower IRRse than this standard level it is assumed that the destroyed wealth would be higher than the created wealth4.
In the case of infrastructures exclusively financed by public subsidies (excluding any user contribution), if we consider not only one project but a program of scheduled projects, the objective function is the NPVse provided by the program. Thus, the question of the optimal ranking is solved by the decreasing order of the IRRse’s and the rhythm of their implementation depends of the available budget. In the case of a PPP, and more generally when the projects are partially financed by the users, the objective function of the public authority still being the total NPVse of the
2 The risk premium may also include an additional amount to cover uncertainties about the stability of the country in
question. This country spread can be very important in some developing countries.
3 In the French case, this standard level (« taux d’actualisation du Plan »), is 8 % from the early eighties.
program, it is not obvious that the decreasing order of the IRRse’s provides the optimal ranking.
In this case, which is typically the case of railways infrastructures, the socio-economic efficiency of each unit of subsidy result not only of the IRRse of each project but also of its need of subsidy, which is itself depending of its financial IRR. Thus, we have to use the relationship between the need for subsidies and the level of the IRR (Bonnafous, 1999).
4. A fundamental relationship
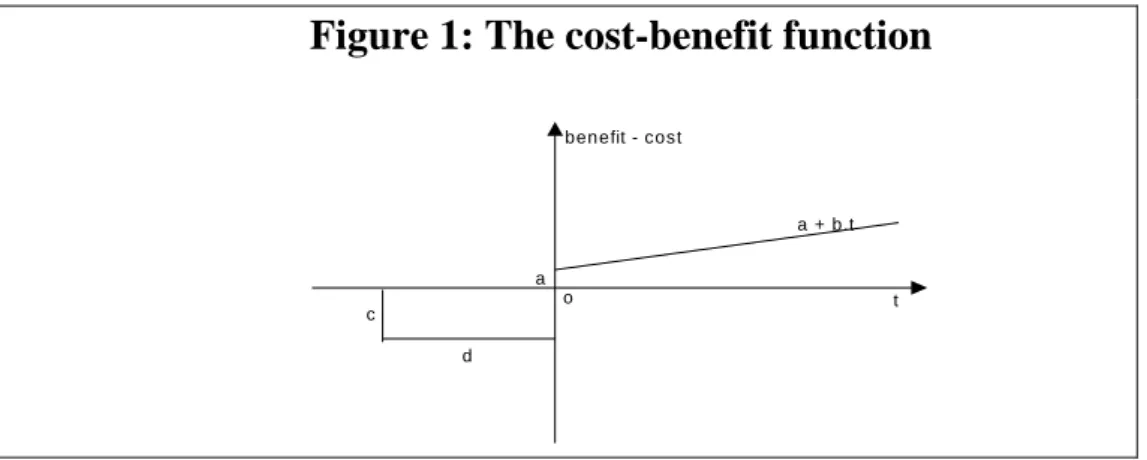
In order to formalize this relationship we shall consider a standard project for which an investment C will be made for a duration d, which is the number of years over which it has been assumed that expenditure will be evenly spread. The net profit made by the operation of the project once it has come into service is denoted by a, and it has been assumed that this will increase by an annual amount b.
This corresponds to the stylized, but nevertheless quite classical, account of costs and benefits that is set out in Figure 1. If it is assumed that the project comes into service at the date t = 0, annual expenditure between the dates –d and 0 will be given by c = C/d. The profit made once the project comes into service is assumed to take the form (a+b.t).
Figure 1: The cost-benefit function
o t a a + b.t c d benefit - cost
The Internal Rate of Return (IRR) of the project, namely the discount rate which cancels out its Net Present Value (NPV), is therefore a function of the four parameters c, d, a and b. We must compare this IRR to the Rate of Return that an operator can reasonably expect.
In what follows we shall use the following notation:
α is the discount rate used to calculate the Net Present Value (NPV),
0
α is the discount rate which cancels out the NPV of the project, which is therefore its IRR,
δ is the amount by which the subsidy increases the IRR,
τ is the rate of subsidy, i.e. the percentage of c which is financed by subsidies.
For a discount rate α , and the present value of cost and benefits from date –d to date T, the Net Present Value is given by the following expression:
) 1 ( .dt b.t).e a ( .dt c.e -NPV 0 αt 0 αt -
∫
∫
− − + + = T dIn order to simplify the calculations that follow, we shall assume that the present value calculation has been extended to infinity, which will have little effect on the results because of the small influence of the distant future (and the known convergence of these integral functions). Equation (1) therefore becomes:
(2) e b e b.t -e a e c NPV - t 2 0 t -0 t -0 t 0 d -
⎥⎦
⎤
⎢⎣
⎡
⎥⎦
⎤
⎢⎣
⎡
⎥⎦
⎤
⎢⎣
⎡
⎥⎦
⎤
⎢⎣
⎡
− + − + − + = +∞ +∞ +∞ α α α α α α α α -or alternatively: (3) b a ) e -c(1 1 NPV= ⎢⎣⎡ + + ⎥⎦⎤ α α α dThe IRR of the project, α is therefore given by : 0
(4) 0 b a ) e -c(1 0 0 + + = α α d
A rate of subsidy τ lowers the annual cost of construction c to c(1-τ ) and raises the IRR α to (0 α +0 δ ) such that equation (4) becomes (4’)
) (4' 0 b a ) e -c(1 ) -(1 0 ( 0 ) = + + + + δ α τ α δ d
Which allows us to express the required rate of subsidy:
) 5 ( ) 1 )(e c( b ) a( 1 ( 0 ) 0 0 − + + + − = + d τ α δ δ α δ α
Rather to analyze the properties of this function, we will use its graphic representation which shows clearly some economic consequences of these properties.
5. Concavity and tyranny of the financial profitability
What is of prime importance to us in this function is clearly the relationship between τ and δ . However, equation (5) also shows that this relationship obviously depends on the values of the parameters c, d, a, b and, of course, α , which 0
characterize the economics of the project and which are moreover linked together by equation (4) which established the IRR of the project α . If we wish to represent 0
equation 5 we therefore need to keep some of these 5 parameters constant and vary just those whose role we wish to demonstrate. This is the well-known nomogram technique.
In this paper we shall only reproduce one of these nomograms, which will be sufficient to illustrate the point we wish to make (Figure 2). The values of c have been kept constant (assumed to be 100); as have those of d (5 years) and b (taken as 1). We have plotted α against a. The IRR of the project 0 α thus takes on a series of 0
values between 2% and 14 % with a step equal to 0.4%. The function (5) which links the rate of subsidy to δ is then shown for each of these values of α . 0
Of course, these functions must in no way be considered as completely general because of the hypotheses which were made in order to develop them and which, in particular, relate to the time series of the costs and benefits of the project in question. For instance, it is possible (and easy) to modify equation [5] by hypothesizing of an exponential instead of a linear increase in demand. Nevertheless, none of our hypotheses are extraordinary, and the conclusions suggested by the shape of these curves can be accepted.
It is quite natural for the need for subsidy to be an increasing function of the additional IRR which the operator must receive. However, the gradient of the curve decreases in a marked manner. This concavity is a counter-intuitive result: it means that the first differences between the targeted IRR and the IRR of the operation are extremely costly, particularly in the case of projects with a low IRR. For example, in the case of a project for which α = 4 % the plot of the subsidy rate against 0 δ
(shown in bold on Figure 2) shows that a subsidy rate in excess of 80 % is required to raise the IRR for the operator to only 8%.
This first observation suggests that the leverage effect of public finance on the
any exist, whose IRR is very close to the target IRR required by the operator. It suggests more generally that under a public budget constraint, the role of the financial IRR could be primordial in the determination of an optimized PPP program.
6. How to find the optimal order for a set of PPP projects?
To confirm this point, we will take the set of 17 toll highway projects for which homogeneous economical data can be obtained5. Subsidizing rates have been calculated from equations (4) and (5), taking 8% as the target IRR. We assume that there exists a budget constraint the first year (F, in MEuros), this constraint increasing by 2,5 % yearly. To make clear the role of the budget constraint, we have changed its value between 1 and 1000 MEuros. For a given order of the projects, the value of F determines the rhythm of completion of projects, since each project needs to draw on this budget an amount τ .c of public subsidies each year.
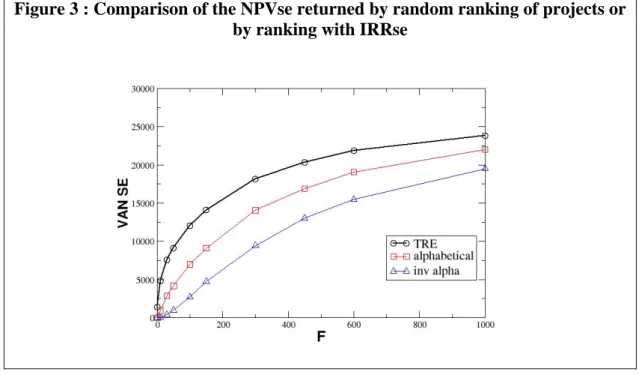
We first examine the interest of using the IRRse as a ranking criterion. For this, we calculate the NPVse returned by three different programs obtained by ranking the projects by alphabetical or inverse alphabetical order (simulating a random combination of the projects) or by decreasing IRRse. Figure 3 shows that the IRRse is clearly more efficient as a ranking criterion than randomness, which is not surprising.
Figure 3 : Comparison of the NPVse returned by random ranking of projects or by ranking with IRRse
However, our previous discussion suggests that the IRRse is probably not the best ranking criterion, mainly if budget constraints are important. Therefore, we can calculate the NPVse outputs obtained by ranking the projects with two other criteria: the financial IRR and the « output », defined as O(i) = NPVse(i)/sub(i), where sub(i) represents the amount of public subsidies required by this project to obtain the
5 These 17 French projects were in competition in the early 90s. Most of them have been carried out with a small
contribution from public money owing to the former French financing system of tolled highways (before the European reform).
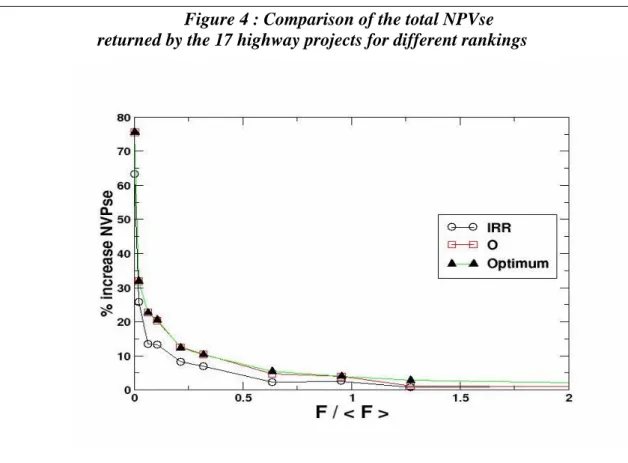
targeted IRR (8%, as assumed above). In figure 4, we compare the total NPVse returned by the 17 highway projects for different rankings, as a function of the mean subsidy required by all the projects (<F>= 472). More precisely, we plot the % of gain obtained by choosing the specified ranking criterion compared to the total NPVse returned by using the IRRse as the ranking criterion. Note that the curve labeled "Optimum" (triangles) will be discussed below. The results presented in Figure 4 confirm our intuition : the pure financial IRR is a best ranking criterion than the IRRse, and this is the truer the tighter the budget constraint. When this constraint is lower than some value (close to one third of the average subsidy needed for a project), the NPVse output of the program obtained with the IRRse ranking is frankly disastrous when compared with the pure financial IRR order.
Figure 4 : Comparison of the total NPVse returned by the 17 highway projects for different rankings
Figure 4 also shows that our “output” criterion is even better than the IRR, for all the values of the public budget constraint. The point now is : can we find a better criterion ? Can we be sure to have found the best possible ranking? The problem is that, since a program is a discrete combination of all the single projects, we cannot use the standard analytical optimization techniques such as Lagrangian multipliers or functional derivatives to find rigorously the best criterion. Therefore, we are left with exploring the different combinations of projects to find the one that yields the highest NPVse. However, the number of possible orders (17! = 3 1014) forbids an exhaustive examination of all the possibilities. Fortunately, several tools to explore efficiently the “landscape” of different combinations have been developed by several disciplines.
Let’s present briefly the three most widely used methods. First, the “simulated annealing” (Kirkpatrick, 1983, van Laarhoven, 1992) method mimics the
way physical systems approach thermal equilibrium. The system is taken to a high “temperature” (introducing disorder, which allows to explore a large number of configurations), then “cooled” slowly, hoping that the internal dynamics of the system will steer it towards the optimum configuration, as happens with crystallization of materials. Second, “genetic” algorithms (Mitchell, 1996) draw inspiration from natural selection, where the convergence to the optimum is obtained by random generation of individuals (each configuration), their reproduction (for example, a linear interpolation) and their selection following the desired criteria. Finally, several algorithms were recently proposed mimicking the behavior of ant colonies (Bonabeau, 1999) which are able to find shortest paths from their nest to the food sites. For our problem, which is relatively simple, we have chosen a reliable algorithm, inspired from the Monte Carlo method.
The algorithm can be summarized as follows. We start from an arbitrary initial state (random or given by the IRR order, this has no consequence on the final result, as shown in figure 5), we iterate the following process as many times as needed to converge.
(1) Two randomly chosen projects, i and j, are permuted. (2) The total NVPse for this new ranking is calculated.
(3) The permutation is systematically accepted the new total NVPse is larger than the previous one. In this case, the “temperature” (explained later) is slightly decreased and we start over (step 1).
(4) However, to avoid the jamming of the system in a given configuration, we allow for a (small) probability of accepting the permutation even if it leads to a lower total NVPse, as in the simulated annealing algorithm. For this, we calculate p=exp((NVPse_new – NVPse_old)/T), where T is a “temperature”.
(5) We throw a random number q (0 < q < 1) and compare it with p. If it is lower, we authorize the permutation, otherwise, we cancel it. If the permutation is accepted, the temperature is slightly decreased. In any case, we start over, step (1).
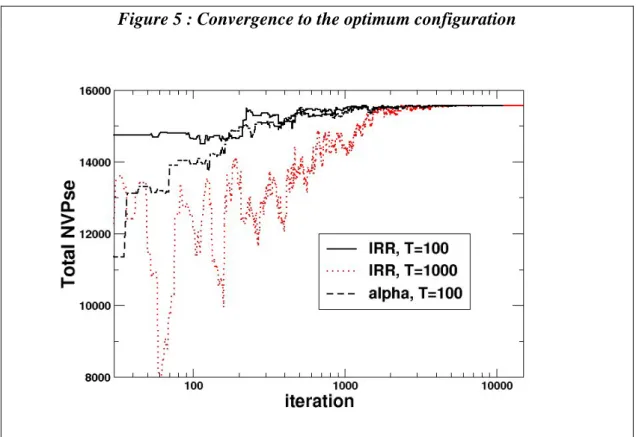
We have tested the robustness of the algorithm by changing the initial value of the “temperature” (see figure 5). This temperature, as in the simulated annealing algorithm, is an arbitrary variable that allows more or less large fluctuations around the maximum value at any iteration of the search. If a higher value is fixed, the fluctuations are larger, because rankings with lower total NVPse can be accepted, but the algorithm always converges to the same ranking. Figure 5 also shows that convergence to the same final, optimal ranking of projects is ensured for any initial state (IRR or random ranking). Our algorithm can therefore be trusted to find the unique optimal ranking of projects.
Figure 5 : Convergence to the optimum configuration
Figure 4 shows the results obtained by the optimization algorithm. It confirms that the R ranking is the optimum, since it always corresponds to the value found by our algorithm. Even if this does not constitute a rigorous proof of the output criterion as the best ranking criterion, we can trust the generality of our optimization criterion.
This kind of algorithms will certainly show its full power to study programs of interdependent projects, namely programs where TRI of one project depends on its rank (or even the date) of implementation.
7. Conclusion
Let’s summarize here our three main results, which may seem paradoxical but are a direct consequence of the present financial constraints.
1) When financial constraints are tight, the social return of a program of investments is higher when projects are ranked according to their pure financial characteristics (such as IRR), instead of their pure socioeconomic characteristics.
2) We have also confirmed the hybrid optimum ranking criterion : the “output”, defined as the ratio of the socioeconomic NPV to the amount of subsidy it needs. 3) Our optimization algorithm will certainly reveal all its power in more complex
situations. For example, when the characteristics of the projects depend on the precise date of completion (because of external factors, such as international development) or on the precise order of completion (a project IRR can depend on the fact that another project has been completed previously). In those complex situations, analytical treatments are certainly difficult to imagine, and simulation tools such as those developed in this paper may turn out to be a powerful tool.
Thus, because we were in the case of infrastructures exclusively financed by public subsidies, the objective function being the NPVse provided by the program of
scheduled projects, the question of their optimal ranking was solved by the decreasing order of their IRRse’s and the rhythm of their implementation depends of the available budget. In the case of a PPP, and more generally when the projects are partially financed by the users, the objective function of the public authority still being the total NPVse of the program, the decreasing order of the IRRse’s does not provide the optimal ranking: the pure financial IRR is a better ranking criterion, and this is the truer the tighter the budget constraint.
Even if the ratio of the socioeconomic NPV to the amount of subsidy it needs is a still better criterion, and even the best, as confirmed by our optimization algorithm, we can conclude to the tyranny of financial profitability as soon as the user is involved in the financing of the project.
References
Baird, A.J. « Trend in Port Privatization in the World Top 100 Containers
Ports. » 9th WCTR, Seoul, July.2001, 21p.
Bonabeau, E, Dorigo, M. and Théraulaz T., From Natural to Artificial
Swarm Intelligence, New York, Oxford University Press (1999). See also http://iridia.ulb.ac.be/~mdorigo/ACO/ACO.html
Bonnafous, A. « Infrastructures publiques et financement privé : le paradoxe
de la rentabilité financière. », Revue d’Economie Financière, n°51, 1999.
Bonnafous, A. « Transport Infrastructures and Private Financing : a
Profitability Rate Paradox. » 9th WCTR, Seoul, July.2001, 9p.
Bonnafous, A. « Les infrastructures de transport et la logique financière du
partenariat public - privés : quelques paradoxes » Revue Française d’Economie, vol. 17, n°1, 2002.
Budin, K.J. and Thompson, L.S. « Directions of Railway Reform », Rail
International –Schienen der Welt, sept.–oct. 2001, pp. 30-45.
Cohen, Y. (1991) « California’s Private Infrastructure Initiative. » Journal of
Transport Economics and Policy n°25, 1991
Commissariat Général du Plan. Transports : pour un meilleur choix des
investissements. Rapport du groupe présidé par Marcel Boiteux, Documentation
Française, 1996.
Commissariat Général du Plan. Transports : le prix d’une stratégie,
Rapport de l’atelier présidé par Alain Bonnafous, 2 vol., Documentation Française, 1997.
Dewenter, K.L. and Malatesta, P.H. « State-Owned and Privately Owned
Firms : An Empirical Analysis of Profitability, Leverage, and Labor Intensity. »
American Economic Revew, March 2001, 91(1), pp.320-334.
Faivre d’Arcier, B.and Mignot, D. « Using Economic Calculation as a
Simulation Tool to Assess Transport Investments », 8th WCTR, Anvers, July 1998, 14p.
Gomez-Ibanez, J.A. and Meyer, J.R. Going Private, Brooking Institution,
Washington D.C., 1993.
Kirkpatrick S., Gelatt Jr, C.D. and Vecchi, M.P. Science 220, 671 (1983) ; Mills, G. « Public Infrastructure : Private Ownership or Contracting Out. »
Working Paper n°18, Center for Microeconomic Policy Analysis, University of Sydney, 1996.
Mitchell, M. An Introduction to Genetic Algorithms, MIT Press, Cambridge
(1996)
Molnar,E. « Trends in Transport Investment Funding », Magnificent Seven
Papers, ECMT, 2003.
Van Laarhoven, P and Aarts, E. H. L. Simulated Annealing: Theory and