HAL Id: hal-01709089
https://hal.univ-lorraine.fr/hal-01709089
Submitted on 14 Feb 2018HAL is a multi-disciplinary open access archive for the deposit and dissemination of sci-entific research documents, whether they are pub-lished or not. The documents may come from teaching and research institutions in France or
L’archive ouverte pluridisciplinaire HAL, est destinée au dépôt et à la diffusion de documents scientifiques de niveau recherche, publiés ou non, émanant des établissements d’enseignement et de recherche français ou étrangers, des laboratoires
Macrosegregation in a Direct Chill Cast Al-Cu Billet
Laurent Heyvaert, Marie Bedel, Miha Založnik, Hervé Combeau
To cite this version:
Laurent Heyvaert, Marie Bedel, Miha Založnik, Hervé Combeau. Modeling of the Coupling of Mi-crostructure and Macrosegregation in a Direct Chill Cast Al-Cu Billet. Metallurgical and Materials Transactions A, Springer Verlag/ASM International, 2017, 48 (10), pp.4713-4734. �10.1007/s11661-017-4238-z�. �hal-01709089�
DOI: 10.1007/s11661-017-4238-z
1
Modeling of the coupling of microstructure and macrosegregation
2in a direct chill cast Al-Cu billet
34
Laurent Heyvaert1, Marie Bedel1,2, Miha Založnik1, Hervé Combeau1 5
6
1 Institut Jean Lamour, Dept. SI2M, CNRS – Université de Lorraine, Parc de Saurupt CS 50840, F-54011 Nancy CEDEX, France
7
2 École Nationale Supérieure d’Arts et Métiers, Campus d’Aix-en-Provence, F-13617 Aix-en-Provence, France
8 9
* Corresponding author: [email protected]
10 11
Abstract
12
The macroscopic multiphase flow and the growth of the solidification microstructures in the mushy 13
zone of a direct chill (DC) casting are closely coupled. These couplings are the key to the 14
understanding of the formation of the macrosegregation and of the nonuniform microstructure of the 15
casting. In the present paper we use a multiphase and multiscale model to provide a fully coupled 16
picture of the links between macrosegregation and microstructure in a DC cast billet. The model 17
describes nucleation from inoculant particles and growth of dendritic and globular equiaxed crystal 18
grains, fully coupled with macroscopic transport phenomena: fluid flow induced by natural 19
convection and solidification shrinkage, heat, mass, and solute mass transport, motion of free-floating 20
equiaxed grains and of refiner particles. We compare our simulations to experiments on grain-21
refined and non grain-refined industrial size billets from literature. We show that a transition between 22
dendritic and globular grain morphology triggered by the grain refinement is the key to the 23
explanation of the differences between the macrosegregation patterns in the two billets. We further 24
show that the grain size and morphology are strongly affected by the macroscopic transport of free-25
floating equiaxed grains and of grain-refiner particles. 26
27
1. Introduction
28
Direct chill (DC) casting is the principal process for the production of wrought aluminum alloys. It is 29
used to produce cylindrical billets for extrusion of profiles and rectangular ingots for rolling of plates, 30
strip, and foil. Macrosegregation is a common defect in DC casting and can lead to nonuniform 31
material properties. Since it is generally aggravated by higher casting speeds and casting size, it also 32
limits productivity. Macrosegregation is characterized by variations of the chemical composition on 33
a scale larger than the crystal grains, which cannot be mitigated during the further downstream 34
processing. The redistribution of the chemical species (solutes) at the product scale during 35
solidification is caused by the relative motion of liquid and solid with different compositions. It is 36
generally admitted that the macrosegregation in DC casting is a consequence of an intricate interplay 37
of the melt flow, induced by thermosolutal natural convection, shrinkage, and pouring, and of the 38
transport of solute-lean free-floating grains [1–3]. Melt flow due to stress-induced deformation can 39
also play a role [4]. The importance of the individual mechanisms varies depending on the alloy, 40
casting shape and size and process parameters [3]. It is however difficult to construct a simplified 41
general image of the macrosegregation formation in DC casting, because all these strongly coupled 42
transport phenomena have a significant impact. A thorough understanding of the involved 43
mechanisms and of their coupling is required to be able to develop robust solutions that would 44
mitigate the macrosegregation [5]. 45
The interplay of the transport mechanisms that cause macrosegregation is closely linked to the 46
microstructure of the solidifying grains. The grain size and the grain morphology (dendritic or 47
globular) determine the dynamics of settling of the free-floating equiaxed grains, the compactness of 48
the packed grain layer, and its hydrodynamic permeability. They thus affect the macrosegregation 49
induced by the settling of solute-lean grains and the expulsion of solute-rich liquid – the prime cause 50
of the negative centerline segregation. Furthermore, the grain size and morphology influence the 51
macrosegregation formed by permeation of solute-rich liquid through the packed layer. These effects 52
have been clearly demonstrated in steel ingot casting, using a combination of industrial scale 53
experiments and multiscale numerical modeling [6–10]. It was shown that globular free-floating 54
grains lead to much more pronounced settling-induced macrosegregation than dendritic grains. Such 55
detailed modeling has not yet been done for DC casting. 56
Most experimental investigations of the influence of grain motion on macrosegregation in DC casting 57
used varying levels of grain refinement as a control process parameter, in order to stimulate or to 58
stifle grain motion. However, the influence of grain refinement on macrosegregation is complex. On 59
the one hand, grain refinement results into smaller grains that are more easily entrained by the liquid 60
and have smaller slip velocities, thus reducing settling-induced macrosegregation. On the other hand 61
it also promotes more compact globular grain morphologies that settle faster than dendritic grains of 62
the same size and result into a larger fraction of solute-lean solid in the packed grain layer than 63
dendritic grains. Moreover, a modification of grain size and morphology can alter the structure of the 64
multiphase flow in the mushy zone. Due to this complexity, the experimental investigations, which 65
were done with different alloys, casting formats and casting parameters, led to disparate conclusions 66
and interpretations, sparking some controversy. In small 2000 series billets, no significant influence 67
of grain refinement on macrosegregation was observed [11,12]. In large Al-Cu billets Finn et al. [13] 68
observed that the addition of grain refiner led to a reversal from negative to positive centerline 69
segregation, while Vreeman et al. [14] showed an increase of negative segregation. In large 5000-70
series sheet ingots, grain refinement clearly led to more pronounced negative centerline segregation 71
[15–19]. The grain morphology, more globular in grain-refined castings and more dendritic in non 72
grain-refined castings, was seen as a key factor [17,20]. An impact of the morphology on both the 73
motion of free-floating equiaxed grains and on the permeability of the packed grain layer was argued 74
to be the reason for the modification of the macrosegregation patterns. 75
The support of modeling is vital in the investigation of the physical mechanisms that link the 76
microstructure and the macrosegregation in a complex casting process. However, concurrent coupled 77
simulation of microstructure and the transport phenomena in DC casting is still lacking. Past models 78
were not able to capture these couplings because they used various simplifications. Most models were 79
based on simple equilibrium models of phase change and lacked a description of the kinetics of the 80
microstructure nucleation and growth [21–25]. Models that included grain growth kinetics did not 81
account for grain motion [20] or assumed a globular grain morphology [1,26]. Detailed modeling 82
focusing on grain structure and morphology did not consider grain motion and macrosegregation [27]. 83
The success in predicting macrosegregation was limited to globular structures and could not correctly 84
capture the impact of grain morphology and of grain refinement. 85
Recently we presented a more advanced model of DC casting, which accounts for macrosegregation 86
with grain motion, fully coupled with nucleation on grain-refiner particles and with the kinetics of 87
grain growth and morphology development [28,29]. This model was successful in predicting the 88
influence of the flow on the distribution of grain size and the influence of grain refinement on the 89
grain morphology in a large sheet ingot [10,29]. In the present paper we use this model to provide a 90
fully coupled picture of the links between macrosegregation and microstructure in a DC cast billet. 91
We use the experimental results presented by Vreeman et al. on Al-Cu billets [14] as a reference to 92
which we compare our model predictions. The experiments were made on two grain-refined and non 93
grain-refined billets cast under the same conditions. We perform a detailed comparison of the 94
simulations to the experiments and a critical analysis of the coupled phenomena of macroscopic 95
transport and microstructure formation. We show that a morphology transition triggered by the grain 96
refinement is the key to the explanation of the differences of the macrosegregation patterns in the two 97
billets and we show that the microstructure is strongly affected by the macroscopic transport of free-98
floating equiaxed grains and of grain-refiner particles. 99
100
2. Model
101
The multiscale multiphase model of solidification is based on a volume averaging method with three 102
hydrodynamic phases [30,31], as schematically shown in Fig. 1. The model is an extension of the 103
earlier two-phase model [1,6,28,32] and uses the same constitutive relations and numerical solution 104
methods. The two crucial extensions are the more detailed three-phase description of the grain growth 105
kinetics and the inclusion of inertial and of solid-solid interaction forces in the momentum balance 106
equations for the solid phase. Both extensions are detailed below and all model equations are 107
summarized in Table 1. A detailed description of the model derivation is given in the aforementioned 108
references. 109
110
The model couples phenomena at the microscopic and the macroscopic scales. The conservation 111
equations for mass, solute, momentum, and the population of inoculant particles and of solid grains 112
include terms accounting for macroscopic transport and for interphase exchange at the microscopic 113
scale. On a microscopic scale, the dendritic grain structures are described in a volume-averaged sense 114
by the volume fractions of the solid phase, of the grain envelopes, of the extradendritic liquid (liquid 115
outside the envelopes), and of the interdendritic liquid (liquid inside the envelopes). The modeling of 116
the growth kinetics of these structures is presented in Section 2.1. The motion of the liquid melt and 117
of the solid grains at the macroscopic scale are modeled by taking into account: buoyancy-driven 118
flow induced by liquid density variations (thermosolutal convection modeled with the Boussinesq 119
approximation) and by the density difference between solid and liquid phases, inertial forces, drag 120
forces at the solid-liquid interfaces, momentum transfer by collisions between grains, and fluid flow 121
induced by solidification shrinkage. The solid grains are assumed to nucleate exclusively by athermal 122
heterogeneous nucleation [33] on inoculant particles. A size distribution of the inoculant particles is 123
considered and the nucleation undercooling is inversely proportional to the particle size. The 124
distribution is discretized into classes (or bins) and population balances are used to describe the 125
advection and the vanishing of the individual size classes [1,28]. The inoculant particles are supposed 126
to move at the liquid velocity. This description of nucleation is suited for modeling nucleation on 127
grain refiner particles, used in DC casting. After nucleating, the solid grains are considered as a 128
dispersed solid phase and remain such until the local grain envelope volume fraction exceeds the 129
packing fraction 𝑔"#. We call this the slurry flow regime. At envelope volume fractions above 130
packing, 𝑔" > 𝑔"#, we consider the solid phase to be stationary and the drag at the solid-liquid 131
interfaces is described by a Darcy term modeled by the Kozeny-Carman law. We call this the porous 132
flow regime. Note that the grain morphology plays a major role in packing. Dendritic grains, whose 133
envelopes occupy more space than their solid skeleton, pack sooner in the solidification process (i.e. 134
at lower solid fraction) than globular grains. 135
Figure 1: (a) Schematics of the hydrodynamic phases in the three-phase model. (b) Solute profiles in the three phases, solute concentrations and volume fractions.
Table 1: Summary of the model equations
Averaged conservation equations
Total mass conservation
𝜕
𝜕𝑡 𝑔'𝜌'+ 𝑔*𝜌* + 𝛻 ⋅ 𝑔'𝜌' 𝑣' '+ 𝑔*𝜌* 𝑣* * = 0 Mass balance, solid
phase 𝜕 𝜕𝑡 𝑔'𝜌' + 𝛻 ⋅ 𝑔'𝜌' 𝑣' ' = 𝛤' + 𝛷' Volume balance, dendrite envelopes 𝜕 𝜕𝑡 𝑔" + 𝛻 ⋅ 𝑔" 𝑣' ' = 𝛤"+ 𝛷' 𝜌' Solute mass balance,
solid phase
𝜕
𝜕𝑡 𝑔'𝜌' 𝐶' ' + 𝛻 ⋅ 𝑔'𝜌' 𝐶' ' 𝑣' ' = 𝛤'𝐶'*+𝜌'𝑆5'𝐷'
𝛿' 𝐶'*− 𝐶' ' + 𝛷'𝑘 𝐶* * Solute mass balance,
liquid phase 𝜕 𝜕𝑡 𝑔*𝜌* 𝐶* * + 𝛻 ⋅ 𝑔*𝜌* 𝐶* * 𝑣* * = −𝛤'𝐶**+𝜌*𝑆5"𝐷* 𝛿*" 𝑔* 𝑔*" 𝐶** − 𝐶* *" − 𝛷'𝑘 𝐶* * Energy balance 𝜕 𝜕𝑡 𝑔'𝜌'ℎ'+ 𝑔*𝜌*ℎ* + 𝛻 ⋅ 𝑔'𝜌'ℎ' 𝑣' '+ 𝑔*𝜌*ℎ* 𝑣* * = 𝛻 ⋅ 𝜆𝛻𝑇 ℎ' = 𝑐#𝑇ℎ* = 𝑐#𝑇 + 𝐿@
Grain density balance 𝜕𝑁B
𝜕𝑡 + 𝛻 ⋅ 𝑣' '𝑁B = 𝜙D E
DFG Inoculant density
balance, for each class i
𝜕𝑁HIJD
𝜕𝑡 + 𝛻 ⋅ 𝑣* *𝑁HIJD = −𝜙D 𝑖 = 1 … 𝑚 Momentum
conservation, solid phase, only when𝑔" < 𝑔"# 𝜕 𝜕𝑡 𝜌'𝑔' 𝑣' ' + 𝛻 ⋅ 𝜌'𝑔' 𝑣' ' 𝑣' ' = −𝑔'𝛻𝑝 + 𝛻 ⋅ 𝜇'𝛻 𝑔' 𝑣' ' + 𝜌 '𝑔'𝑔 − 𝑀*S+ 𝑣' '𝛤' Solid viscosity 𝜇' = 𝜇* 𝑔" 1 − 𝑔" 𝑔"#ETU VW.YBZ[\]^ − 1 − 𝑔"
Momentum conservation, liquid phase 𝜕 𝜕𝑡 𝜌*𝑔* 𝑣* * + 𝛻 ⋅ 𝜌*𝑔* 𝑣* * 𝑣* * = −𝑔*𝛻𝑝 + 𝛻 ⋅ 𝜇*𝛻 𝑔* 𝑣* * + 𝜌 *_𝑔*𝑔 + 𝑀*S − 𝑣' '𝛤' when 𝑔" < 𝑔"_: 𝑀*S =`BZabcd eSf 𝑣* *− 𝑣 ' ' 𝑣* *− 𝑣' ' when 𝑔" ≥ 𝑔"_: 𝑀*S =VBbhib j 𝑣* *− 𝑣 ' ' Permeability 𝐾 = 𝑔*` 1 − 𝑔* W 𝑙JW 𝜋W𝑘 j𝜏W Density for the
buoyancy term 𝜌*
_ = 𝜌
o"@ 1 − 𝛽q 𝑇 − 𝑇o"@ − 𝛽c 𝐶* * − 𝐶o"@
Nucleation
Activation of
inoculant class i If at time t0, 𝑇E+ 𝑚 𝐶* * 𝑡
r − 𝑇 𝑡r > 𝛥𝑇D: 𝜙D = 𝑁HIJD 𝛿 𝑡 − 𝑡r , where 𝛿 is the Dirac delta function.
Else: 𝜙D = 0. Solid mass generation due to nucleation 𝛷' = 𝜌'𝑉r 𝜙D E DFG
Grain growth kinetics
Envelope growth rate
𝛤"H5 = 1
3𝑆5 "𝑉
vD#
Mass balance, at the
solid-liquid interface 𝛤'+ 𝛤* = 0 Solute balance, at the
solid-liquid interface 𝜌'𝑆5'𝐷 ' 𝛿' 𝑘𝐶* *− 𝐶 ' ' + 1 − 𝑔' 1 − 𝑔" 𝜌*𝑆5"𝐷 * 𝛿" 𝐶* *− 𝐶 * * = 𝛤' 1 − 𝑘 𝐶** − 𝜌 * 𝑔"− 𝑔' 𝜕𝐶** 𝜕𝑡 Diffusion lengths 𝛿' = 𝑑' 10
𝛿" = W Sf+ G xb yz{[ GV |xb yz{[ d}h~dfh df h•yz{[xb V d} h•yz{[xb "U# V d}~df hxb yz{[ VG :
Primary arm length and equivalent diameter of envelope and of solid phase
𝑅ToE = `BZ e•f G ` 𝑑B = ‚BZ ƒ•f G ` 𝑑' = ‚B„ ƒ•f G `
Specific surface areas of envelope and solid 𝑆5
" = 4 3𝑅 ToEW 𝑁5 𝑆5' =†e h𝑔D G W𝑔 " 1 − 𝑔DE + 𝑔DE𝑆5" Thermodynamic equilibrium at the solid-liquid interface 𝐶'* = 𝑘𝐶 ** 𝑇 = 𝑇E+ 𝑚𝐶**
Paraboloidal tip model [36,53]
Total tip undercooling
𝑇 − 𝑇E− 𝑚 𝐶* * =𝐿@ 𝑐#𝛺q+ 𝑚𝐶r 1 − 1 1 − 1 − 𝑘 𝛺c Dimensionless undercooling and supersaturation of a dendrite tip with convection [31,53] 𝛺q = 𝐹 𝑃𝑒q, 𝑃𝑢q, Req 𝛺c = 𝐹 𝑃𝑒c, 𝑃𝑢c, Rec 𝐹 𝑃𝑒, 𝑃𝑢,Re = 2𝑃𝑒 𝑒𝑥𝑝 ‘ G −𝑙𝑛𝜂 + 1 − 𝜂W 𝑃𝑒 − 2𝑃𝑢 EG Re 1 − 𝜂W+ 𝑙𝑛 𝜂 1 + 𝜂W 𝑑𝜂 𝑃𝑒q =𝑅vD#𝑉vD# 2𝛼 𝑃𝑒c = 𝑅vD#𝑉vD# 2𝐷* 𝑃𝑢q =𝑅vD# 𝑣' '− 𝑣* * 2𝛼 𝑃𝑢c = 𝑅vD# 𝑣' '− 𝑣 * * 2𝐷* Req = 𝑃𝑒q+ 𝑃𝑢q 𝑃𝑟 Rec = 𝑃𝑒c+ 𝑃𝑢c 𝑆𝑐 Tip selection criterion
𝑅vD#W 𝑉 vD# = 𝛤GT 𝜎* 𝑚 1 − 𝑘 𝐶r 𝐷* 1 − 1 − 𝑘 𝛺c + 𝐿@ 2𝛼𝑐# VG
Hemispherical tip model [37] Tip velocity 𝑉vD# = 𝐷* 𝑇 − 𝑇E− 𝑚 𝐶* * W 𝛤GT 𝑘 − 1 𝑚𝐶r𝜋W 137
2.1. Three-phase model of grain growth
138
The equiaxed grains are described by their size and their morphology, which can be dendritic or 139
globular. The description of the morphology in the volume-averaged model is based on the idea of 140
the dendrite envelope, first proposed by Rappaz and Thévoz [34]. The solid volume fraction 𝑔' is 141
distinguished from the grain envelope volume fraction, 𝑔", as illustrated in Fig. 1a. When a grain is 142
dendritic, its envelope, defined in the model by a regular octahedron linking the six grain tips, is larger 143
than the solid volume of the grain. A part of the interior of the grain envelope is therefore liquid. The 144
model distinguishes between the liquid outside the envelopes, named extradendritic liquid, and the 145
liquid inside the envelopes, between the dendrite arms, named interdendritic liquid. Their volume 146
fractions are 𝑔*" and 𝑔*D, respectively, and their sum is the liquid fraction 𝑔* = 𝑔*D+ 𝑔*". The 147
relationships between the different volume fractions are: 148
𝑔"+ 𝑔*" = 𝑔'+ 𝑔*D+ 𝑔*" = 𝑔'+ 𝑔* = 1 , 𝑔D = 𝑔'
𝑔" (1)
The indication of the grain morphology is given by the internal solid fraction 𝑔D, which is the ratio 149
between the volume of the solid and the envelope. If the internal solid fraction is close to one, the 150
grains are considered to be globular, whereas when it is close to zero, the grains are considered to be 151
dendritic. The final morphology of the solidified equiaxed structure is usually considered to 152
correspond to the morphology at the instant of grain packing [31]. 153
We assume that the interdendritic and extradendritic liquid phases move at the same flow velocity 154
𝑣*" *" = 𝑣
*š *D = 𝑣* * and have the same density 𝜌*" = 𝜌*D = 𝜌*. This assumption is different from 155
the treatment in the classical three phase model with convection [30] that accounts for the partitioning 156
of the flow passing through and around the envelopes due to drag. Our description is not as detailed, 157
but can be reasonable for coarse dendritic grains encountered in DC casting. It also considerably 158
simplifies the macroscopic transport equations. The macroscopic conservation equations for the two 159
liquid phases can be summed to a single equation for the liquid, identical to those in a two-phase 160
model. The global liquid mass conservation equation is then: 161 𝜕 𝜕𝑡 𝜌*𝑔*" + 𝜌*𝑔*D + 𝛻 ⋅ 𝑣* * 𝜌*𝑔*"+ 𝜌*𝑔*D = = › ›v 𝜌*𝑔* + 𝛻 ⋅ 𝑣* * 𝜌 *𝑔* = −𝛤'− 𝛷', (2) where 𝛤' and 𝛷'are the mass transfer rates from liquid to solid due to phase change and nucleation, 162
respectively. Similarly, the solute conservation equation is formulated in terms of the average liquid 163 concentration, 𝐶* * = 𝑔 *D 𝐶* *D+ 𝑔*" 𝐶* *" 𝑔*. 164 𝜕 𝜕𝑡 𝑔*" 𝐶* *"+ 𝑔*D 𝐶* *D + 𝛻 ⋅ 𝑣* * 𝑔*" 𝐶* *" + 𝑔*D 𝐶* *D = = 𝜕 𝜕𝑡 𝑔* 𝐶* * + 𝛻 ⋅ 𝑔* 𝑣* * 𝐶* * = 1 𝜌* −𝐶' *𝛤 '− 𝐶'*𝛷'− 𝑗'S (3) where 𝛤• is the mass flux into phase 𝑘 per unit volume at the phase interface due to phase change and 165
𝛷• is the phase mass transfer rate due to nucleation. Note that the total of all interfacial fluxes is zero, 166
therefore the sum of the fluxes into both liquid phases is equal to minus the sum of the fluxes into the 167
solid phase. 168
The balance equations for interphase exchange of mass and solute at the microscopic scale are 169
modified by the three-phase description. Nevertheless, Tveito [35] derived a formulation of the 170
equations in terms of the average liquid concentration 𝐶* * that results into equations of a form similar 171
to that of the two-phase model. A detailed derivation of these equations is given in Appendix A. The 172
interdendritic liquid is assumed to be perfectly mixed at the uniform concentration equal to the 173
thermodynamic equilibrium concentration at the solid-liquid interface. Diffusion and convection 174
govern the transport of solute in the extradendritic liquid around the envelope and finite diffusion is 175
accounted for in the solid. A typical solute profile in and around a grain is illustrated in Fig. 1b. 176
The growth of the octahedral envelopes is driven by the growth of the primary tips corresponding to 177
the six vertices. Analytical expressions for the dendrite tip velocity as a function of the undercooling 178
exist for paraboloid [36] and hemispherical tip shapes [37]. A freely growing dendrite tip is accurately 179
described by a paraboloid. However, Nielsen et al. [38] pointed out that the hemispherical tip model 180
gave better predictions of the experimentally observed morphologies of interacting grains in 181
inoculated Al-Cu alloys. Therefore, both tip models are considered in this study. 182
183
2.2. Modeling of the slurry flow
184
In the slurry flow regime the free-floating equiaxed grains move with a velocity that is distinct from 185
the liquid velocity. The velocity of each phase is determined with a separate momentum balance. 186
Because of the assumption that the interdendritic and the extradendritic liquid have the same velocity, 187
the mass and momentum balances can be summed and written globally for the liquid. Thus, only a 188
solid and a liquid hydrodynamic phase need to be considered. The averaged mass balance for phase 189
𝑘 (𝑘 = 𝑠, 𝑙)is given by: 190
𝜕
𝜕𝑡 𝑔•𝜌• + 𝛻 ⋅ 𝑔•𝜌• 𝑣• • = 𝛤•+ 𝛷• (4)
191
The momentum conservation equation for phase 𝑘 is as follows: 192 𝜕 𝜕𝑡 𝑔•𝜌• 𝑣• • + 𝛻 ⋅ 𝑔•𝜌• 𝑣• • 𝑣• • = −𝑔•𝛻𝑝•+ 𝛻 ⋅ 𝑔• 𝜏• • + 𝑔 •𝜌•_𝑔 + 𝑀•S+ 𝑀•Ÿ+ 𝑀• (5) where 𝑀•S is the interfacial drag force per unit volume, 𝑀
•Ÿ is the momentum flux across the solid-193
liquid interface due to phase change and 𝑀• is the momentum transfer due to nucleation of the solid 194
from the liquid phase. The nucleation term is negligible. 195
196
The interfacial drag force is modeled as: 197
𝑀'S = −𝑀*S = `BeSZafbcd 𝑣* * − 𝑣' ' 𝑣* * − 𝑣' ' , (6) where 𝑑B is the equivalent spherical diameter of the grain envelope, 𝑣' ' and 𝑣* * are the intrinsic 198
average velocities of the liquid and solid phases, and 𝐶S is the drag coefficient calculated as given in 199
[6]. By using the envelope fraction, 𝑔", and the equivalent envelope diameter, 𝑑B, the influence of 200
the morphology on the drag is naturally taken into account. At a given solid fraction a dendritic grain 201
experiences more drag than a globular grain and its slip velocity is smaller. The stress in the solid 202
phase, generated by grain collisions, is modeled through a pseudo-fluid model [30,39]. Thus the stress 203
term for both phases is formulated as: 204
𝛻 ⋅ 𝑔• 𝜏• • = 𝛻 ⋅ 𝜇
•𝛻 𝑔• 𝑣• • . (7)
The solid viscosity is calculated by the relation [40]: 205
𝜇' = ib BZ 1 − BZ BZ[\]^ VW.YBZ[\]^ − 1 − 𝑔" , (8)
with the maximum envelope packing fraction, 𝑔"#ETU, fixed at 0.6, the approximate value for a close 206
random packing of monodisperse spheres. The pressure is assumed to be identical in both phases. 207
208
The momentum conservation for the slurry zone may be rewritten for both phases as: 209 𝜕 𝜕𝑡 𝜌•𝑔• 𝑣• • + 𝛻 ⋅ 𝜌•𝑔• 𝑣• • 𝑣• • = −𝑔•𝛻𝑝 + 𝛻 ⋅ 𝜇•𝛻 𝑔• 𝑣• • + 𝜌 •_𝑔•𝑔 + 𝑀•S + 𝛤• 𝑣• • (9) 210
In the packed zone, considered as a porous medium, the solid is moving at the casting velocity and 211
the drag force exerted on the liquid is 212
𝑀*S = −Bbhib
j 𝑣* * − 𝑣' ' , (10)
where 𝐾 is the hydrodynamic permeability of the microstructure. It is modeled by the Kozeny-213 Carman relation: 214 𝐾 = Bb¡ GVBb h *¢h ƒh•£¤h, (11)
where 𝑙J is the characteristic length of the porous microstructure. The Kozeny constant, 𝑘j, and the 215
tortuosity of the porous medium, 𝜏, depend on its morphology. Values for a packed bed of spheres 216
were used: 𝑘j = 5 and 𝜏 = 𝜋 6. The resulting momentum equation for the liquid in the porous zone 217 is: 218 𝜕 𝜕𝑡 𝜌*𝑔• 𝑣* * + 𝛻 ⋅ 𝜌*𝑔* 𝑣* * 𝑣* * = −𝑔*𝛻𝑝 + 𝛻 ⋅ 𝜇*𝛻 𝑔* 𝑣* * + 𝜌*_𝑔*𝑔 − 𝑔*W𝜇 * 𝐾 𝑣* *− 𝑣' ' − 𝛤' 𝑣' ' (12) A summary of all model equations is presented in Table 1.
219 220
The conservation equations were solved with the finite volume method. An operator splitting scheme 221
[32] was used to integrate the solute and solid mass conservation equations. The splitting scheme was 222
extended to account for shrinkage induced flow and for transport of grain refiner particles [28]. The 223
pressure-velocity coupling was resolved by the IPSA pressure correction algorithm for multiphase 224
flows [41]. 225
226
3. DC casting experiments and their modeling
227
3.1. Experiments of Vreeman et al.
228
Vreeman and coworkers [14] cast two binary-alloy Al-Cu billets of 450 mm diameter, one inoculated 229
with Al–3Ti–1B grain refiner and one without grain refiner. The other casting parameters were 230
identical. The casting speed was 1 mm/s and hot-top molds were used. The macrosegregation was 231
measured by X-ray fluorescence on 20 samples in each billet. More detailed information on the 232
sampling was not given. The nominal composition of the two billets was slightly different with Al– 233
6.1 wt.%Cu for the grain refined and Al–5.9 wt.%Cu for the non grain refined billet. In order to 234
perform a direct comparison, the experimental data were shifted by –0.1/+0.1 wt.% to mimic an Al-235
6 wt.%Cu billet. The simulations were also performed with the composition Al-6 wt.%Cu for both 236
billets. The main observation of the experiment was a substantially weaker centerline 237
macrosegregation in the non grain refined billet. 238
For the grain refined billet two additional experimental results are available. The temperature field 239
was characterized by inserting thermocouples into the metal during casting. The thermocouples were 240
inserted at three radial positions and were pulled down with the billet at the casting speed. The exact 241
three positions were at radial distances from the centerline of r=10 mm (“centerline”), r=106 mm 242
(“mid-radius”), and r=220 mm (“subsurface”). The uncertainty of the thermocouple measurements 243
was ±2 °C. Characterizations of the size, position and shape of the mushy zone were obtained by a 244
sudden addition of a molten Al-Si mixture. The etched macrograph of the billet section revealed the 245
solidus front and an indication of the packing front. All experimental results are shown along with 246
the simulations in the later sections. 247
Characterizations of the microstructure in terms of grain size and morphology were not reported by 248
Vreeman et al. A grain size of 75 µm used in their simulations was mentioned as representative of 249
the typical grain size in both billets. The structure of the grain refined billet was asserted to be fully 250
equiaxed. The structure of non grain refined billet was less clear and speculations about a possible 251
columnar-to-equiaxed transitions were made [14,42]. 252
253
3.2. Modeling of the experiments
254
The billets were described by a 2D axisymmetric geometry. The computational mesh consisted of a 255
grid of 60×120 finite-volume elements, with a finer mesh in the liquid and mushy zone and a coarser 256
mesh in the fully solidified zone. The inlet was assumed to be across the whole cross-section and the 257
feeding velocity was assumed to be uniform. The melt temperature at the inlet was 943.35 K (670.35 258
ºC), as specified in [14]. The mold height was 7 cm. The top 1 cm of the mold was supposed to be 259
thermally insulating and the heat transfer from the billet in the lower 6 cm of the mold was modeled 260
by a heat transfer coefficient of 30 W/m2K and a reference coolant temperature of 291 K (18 ºC). The
261
heat extraction by the cooling water in the direct chill zone was described by the well-established 262
correlation of Weckman & Niessen [43]. The thermophysical properties of the alloy are summarized 263
in Table 2; they are the same as used in [14]. The thermal conductivity in the mushy zone is modeled 264
as a phase-fraction weighted average of the solid and liquid conductivities. The density of the solid 265
phase is considered as constant and a Boussinesq approximation is used for the liquid phase to account 266
for the buoyancy forces acting on the liquid and on the free-floating grains. The variation of the 267
densities during solidification is illustrated in Fig. 2. The densities in all mass balances are considered 268
as constant. Thus the density difference that induces flow due to solidification shrinkage is given by 269
a constant shrinkage coefficient of 𝛽'* = 𝜌'− 𝜌*,o"@ 𝜌' = 0.032. The size distribution of the grain 270
refiner particles used in the nucleation law was taken from the measurements of Tronche for an Al-271
Ti-B grain refiner [44]. The distribution was discretized [28] into 13 classes of particles; the 272
nucleation law is shown in Fig. 3. 273
Table 2: Thermo-physical properties and model parameters
Phase diagram (Al–Cu) Process parameters
Melting temperature of pure Al [°C]1 677.8 Casting temperature [°C] 670.35 Nominal composition in Cu [wt.%] 6.0 Casting speed [m·s-1] 10-3 Eutectic temperature [°C] 547.85 Heat transfer coefficient, insulation [W·m-2·K-1] 0 Liquidus slope [°C·wt%-1] –3.425 Heat transfer coefficient, mold [W·m-2·K-1] 30 Binary partition coefficient [-] 0.173 Insulation height [m] 0.01
Mold height [m] 0.07
Reference coolant temperature [°C] 18
Thermo-physical data Computational parameters
Specific heat [J·kg-1·K-1] 1300 Dimensions of the domain (R×Y) [m×m] 0.225×0.90 Solid thermal conductivity [W·m-1·K-1] 162 Number of grid volumes, R×Y 60×130 Liquid thermal conductivity [W·m-1·K-1] 95
Reference density of the liquid, ρl,ref [kg/m3] 2490 Latent heat of fusion [J·kg-1] 3.92·105 Thermal expansion coefficient, βT [°C-1] 1.17·10-4 Solutal expansion coefficient, βC [wt%-1] –7.3·10-3 Reference temperature for density [°C] 660 Reference Cu concentration for density 6.0 Dynamic viscosity [Pa·s] 1.28·10-3 Diffusion coefficient, liquid [m²·s-1] 5.66·10-9 Diffusion coefficient, solid [m²·s-1] 5.6·10-13 Shrinkage coefficient βsl = (ρs–ρl,ref)/ρs 0.0319 Characteristic length for permeability [m] 7.5·10-5 Gibbs-Thompson coefficient [K·m] 1.9·10-7
275 276
Figure 2: Evolution of solid, liquid and average densities of the alloy Al–6wt.%Cu with solid fraction. The solidification path is assumed to follow the Scheil-Gulliver model. The variation of the solid density due to the appearance of a secondary phase upon the eutectic reaction is not accounted for.
277
Figure 3: Discretization of the distribution of nucleation sites with respect to the critical undercooling. The distribution corresponds to the size distribution of TiB2 particles for 1 kg/t of Al-5Ti-1B grain refiner [28,44].
Some of our results are compared to the simulations of Vreeman et al. [14], who used a much simpler 278
model, especially with respect to the microstructures. Their model considered the equiaxed grains to 279
be globular and of a constant size (fixed to 75 µm), and described the solidification by the lever rule. 280
Notably, with these assumptions the local grain population density must be adjusted in order to 281
correspond to the solid fraction obtained from the lever rule and to the fixed grain size. Vreeman et 282
al. used a similar criterion as the present work for packing of the grains. The grains were considered 283
to be packed above a solid fraction of 0.3. 284
4. Results and discussion
286
4.1. General features of the heat transfer, flow and microstructure
287
Model predictions of heat transfer, fluid flow, motion of the equiaxed grains and of solidification in 288
the sump of the billet are illustrated in Fig. 4. These are results from a simulation that used a packing 289
fraction of gep =0.20 and the paraboloidal dendrite tip model.
290
The temperature and the solid fraction fields are shown in Figs. 4a and 4b, respectively. The radial 291
heat extraction from the metal that is fed into the mold from the top in liquid state creates the 292
characteristic roughly triangular shape of the solidification zone (sump). The heat extraction in the 293
mold is relatively weak due to the particular mold design. The ingot is cooled mainly by the direct 294
contact with the water, which starts abruptly below the mold. This explains why the sump in the 295
rapidly cooled zone at the billet surface bends perpendicularly to the surface. In the billet center the 296
temperature gradients are much smaller and a large part of the mushy zone in the core has a virtually 297
homogeneous temperature that is only slightly below the liquidus temperature of 930.25 K (657.25 298
ºC). 299
The flow is driven by thermosolutal natural convection and by the settling equiaxed grains. Due to 300
the density relations in the Al–6 wt%Cu alloy (Fig. 2), all three driving forces cooperate. The colder, 301
solute enriched liquid with a higher fraction of solid grains, forming at the slopes of the sump, has a 302
higher density than the hotter solute-lean liquid in the core. The buoyancy forces induce a descending 303
current along the mushy zone and develop a flow in a roughly triangular pattern with one major loop, 304
as shown in Fig. 4c. More precisely, below the inlet the flow deflects horizontally towards the mold 305
and then rushes downwards parallel to the packing front towards the billet center. The flow velocity 306
is the largest in the current descending along the packing front, due to the conjunction of strong 307
buoyancy forces and drag forces induced by grain sedimentation (as the solid phase is heavier than 308
the surrounding liquid). Then the flow slowly turns upward in the central part of the billet and runs 309
again towards the mold. 310
The field of the intrinsic velocity of the solid phase is shown in Fig. 4d. The solid forms as equiaxed 311
grains nucleating on grain refiner particles. The nucleation zone is located adjacent to the inclined 312
part of the packing front [1,45], which is a result of a particular competition between nucleation, 313
growth and grain transport [28]. The solid grains are heavier than the liquid and tend to sediment until 314
packing. The packing is modeled by a limit envelope volume fraction. In the example shown in Fig. 315
4 the packing fraction is 𝑔"# = 0.2 and the packing front is shown by a black line. The grains descend 316
towards the billet center in a current parallel to the packing front. Some of them pack on the way, 317
most of them accumulate in a wide packing layer at the bottom of the sump in the billet center, and 318
some grains are dragged upwards by the liquid flow. This migration of the solid phase from the 319
periphery to the billet core results in a global advection of latent heat in the inverse direction. This 320
cools down the core and also produces the isothermal zone in the core of the sump. 321
Figure 4: Heat transfer and flow in the billet: (a) temperature field, (b) solid fraction, (c) norm of the liquid velocity and liquid velocity streamlines, (d) norm of the solid velocity and solid velocity streamlines. The grain refined billet simulated with a packing fraction of gep=0.2 and the paraboloidal dendrite tip model is shown. The relative velocities are shown in the reference frame of the moving product.
Although no information on the grain size was reported in the experiments, it is interesting to have a 323
look to the at the distributions of grain density and grain size in the slurry zone, shown in Fig. 4e and 324
4f, respectively. The variations of both grain size and grain density are mainly in the vertical direction 325
and the highest values of both are located at the packing front. With the exception of a thin layer close 326
to the liquid region, in most of the slurry region the grain density varies from around 8·1010 to 1.8·1011 327
grains/m3 and the grain size from around 75 to 130 µm. These variations are not exceedingly large
328
and they can justify the assumption of a fixed grain size that was adopted by Vreeman et al. [14]. The 329
main limitation of such an assumption is that the grain size becomes an input parameter of the model 330
that is difficult to determine a priori. 331
The microstructure was simulated with two different dendrite tip models, leading to significantly 332
different predictions of the equiaxed grain morphology. Fig. 5 shows the internal solid fraction in the 333
mushy zone obtained with both tip models. A packing fraction of 𝑔"# = 0.2 was used in both 334
simulations. The paraboloidal tip model predicts fully globular grains in the whole mushy zone, i.e. 335
a globular morphology from nucleation until packing of the grains. Contrarily, the hemispherical 336
model predicts a rapid dendritization of the grains and an evolution of the morphology. Nevertheless, 337
the grains remain dendritic until they pack. The internal solid fraction at the packing front, 𝑔'D, is 338
characteristic of the final grain morphology. The predicted morphology profiles across the billet 339
radius in terms of this criterion are shown in Fig. 6. The profiles are given for simulations with both 340
dendrite tip models and using envelope packing fractions between 0.10 and 0.55. The plot clearly 341
shows that the parabolic tip model predicts globular grains and the hemispheric tip model predicts 342
dendritic grains. The latter model also indicates somewhat less pronounced dendritic morphologies 343
in the core than at the billet surface as an overall trend. The predictions depend weakly on the packing 344
fraction, with the tendency of giving somewhat more globularized morphologies at higher packing 345
fractions, especially in the region that coincides with the most inclined part of the packing front. The 346
tendency of the hemispherical tip model to predict a more pronounced dendritization of the grains 347
than the parabolic tip model has already been reported in literature [38]. 348
Figure 5: Internal solid fraction in the mushy zone obtained with both dendrite tip models: (a) paraboloidal, (b) hemispherical tip model. The packing fraction is gep = 0.20 in both cases.
349
Figure 6: Internal solid fraction at packing (gip) for both tip growth models, hemispherical (solid
lines) and paraboloidal (dashed lines).
350
4.2. Comparison to measurements of temperature and sump shape
351
Before analyzing the model predictions in more detail, it is essential to validate the computed thermal 352
field by comparison to the experiment. The comparison between the experimental temperature 353
profiles and the present model (using gep=0.20 and the paraboloidal tip model), as well as with the
354
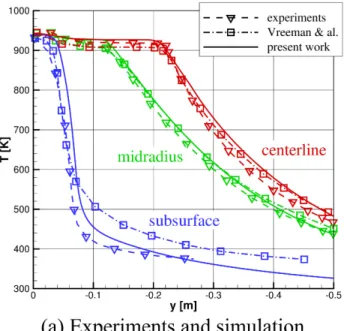
model of Vreeman et al. [14] is shown in Fig. 7a. The agreement between the experimental and the 355
predicted profiles is very good in the center of the ingot and at mid-radius. The subsurface profile is 356
also accurately predicted and globally fits better to the experiment than the simulations of Vreeman 357
et al., despite the use of the generic Weckman-Niessen thermal boundary condition instead of a fit to 358
the measurements. The centerline temperature profiles indicate that the mushy zone is nearly 359
isothermal up to a depth of 20 cm in the ingot center. This isothermal zone reaches down to more 360
than half way through the packed mushy layer (and does not end at the packing front as suggested in 361
[14]). 362
The effect of the packing fraction on the thermal field is illustrated in Figs. 7b and 7c, for the 363
paraboloidal and the hemispherical tip model, respectively. An increase of the packing fraction leads 364
to a significant temperature decrease in the core of the billet, especially at the centerline. When the 365
grains pack at a higher volume fraction, a larger proportion of the solid in the mushy zone is mobile. 366
Because of this, the latent heat transport from the billet core to the periphery, induced by grain motion 367
in the opposite direction, is intensified. This effect is more significant when the grains are globular 368
(Fig. 7b) than when they are dendritic (Fig. 7c). The reason is that the solid fraction of globular grains 369
at packing is higher than that of dendritic grains by a factor of gip-1 and therefore a larger amount of
370
solid is set in motion. 371
Figure 7: Comparison of measured and computed vertical temperature profiles at three different radius in the ingot (subsurface in blue, midradius in green and centerline in red). (a) Comparison of simulations with globular grains (paraboloidal tip model) and gep=0.2 with experiments and with simulations of Vreeman et al. [14]. (b) Influence of the packing fraction on the temperature profiles for globular grain morphology (paraboloidal tip model). (c) Influence of the packing fraction on the temperature profiles for dendritic grain morphology (hemispherical tip model).
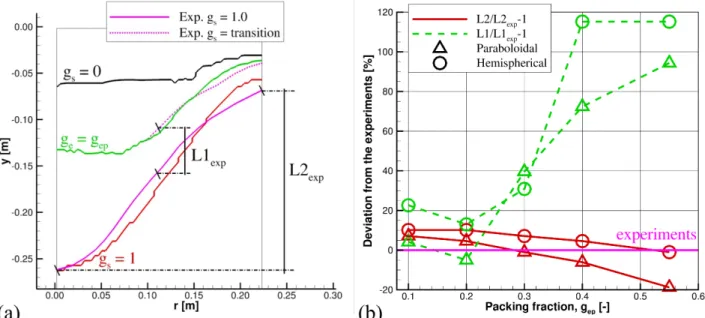
A comparison between experimental and simulated sump geometries is shown in Fig. 8. In Fig. 8a 373
the sump shape measured in the refined billet is superimposed on the packing and the solidus fronts 374
predicted by the model (using gep=0.20 and the paraboloidal tip model, which gave the most accurate
375
results). The data are shifted such that the solidus fronts are aligned at the centerline. We can see that 376
the fit is very good, both in terms of shape and overall dimensions. In order to determine the best 377
value of gep by comparison with the experiment, two characteristic dimensions of the sump were
extracted from the experimental measurements. The distance between the packing front and the 379
solidus at mid-radius, L1, represents the thickness of the mushy zone (L1exp = 5 cm) and L2 is the
380
height of the solidus front (L2exp = 19.3 cm). In Fig. 8b these two dimensions from a series of
381
simulations using both dendrite tip models and a wide range of packing fractions are compared to the 382
experimental values. We can see that the solidus height L2 is well estimated overall. It decreases with 383
increasing packing fraction. This is a consequence of an enhancement of the cooling of the core 384
through latent heat transport by grain motion, as explained earlier. This effect is more pronounced 385
with globular grains, as predicted by the paraboloidal tip model, than with dendritic grains, predicted 386
by the hemispherical tip model. The prediction of the mushy zone thickness L1 is much more sensitive 387
to the packing fraction. The simulations give rather accurate results for small packing fractions (gep
388
= 0.10 – 0.20). For larger packing fractions, the mushy zone thickness at mid-radius is clearly 389
overestimated. The main reason is that at higher packing fractions (between 0.30 and 0.40) the plateau 390
of the packing front in the core widens and its characteristic inflection shifts further outwards 391
(compare Figs. 9a,c to Figs. 9b,d). This clearly indicates that the extent of the packed layer is 392
overestimated when using high packing fractions. The predicted increase of the packing layer with 393
an increasing packing fraction is stronger with the hemispherical tip model. 394
395
Figure 8: (a) Comparison of the sump shape obtained with the paraboloidal tip growth model and gep = 0.20 to the experimental sump shape. (b) Relative error of the lengths L1 and L2 as a function of the packing fraction, shown for simulations with both tip models.
The validation of the model by comparison to measurements of temperature in the billet and to 396
experimentally determined sump shape and dimensions has shown that the model predictions 397
significantly depend on the packing fraction of the free-floating equiaxed grains. The packing fraction 398
determines the intensity of the heat transfer due to the transport of latent heat by grain motion in the 399
sump. This effect is particularly strong when the grains are globular due to a larger proportion of 400
moving solid in the mushy zone. Dendritic grains have a considerably weaker influence on the heat 401
transfer and less impact on the thermal state in the casting. 402
4.3. Macrosegregation in the grain refined billet
404
The formation of the macrosegregation in the billet is shown in Fig. 9 for four cases: with globular 405
and dendritic grain morphologies (stemming from the use of the two dendrite tip models), each for 406
two packing fractions (gep = 0.20 and gep = 0.40). The field of the average “mixture” composition,
407
𝐶E = 1 − 𝑔' ⟨𝐶*⟩* + 𝑔
'⟨𝐶'⟩', and the streamlines of the liquid velocity are represented. We can 408
distinguish four zones of segregation formation [1]: 409
• the slurry zone, where a natural convection flow caused by thermosolutal buoyancy and grain 410
motion determines the solute transport; 411
• the packing front, where the sudden accumulation of solute-lean grains causes a negative jump 412
of the solute concentration; 413
• the moderately permeable packed layer (moderate gl), where the natural convection and the
414
shrinkage-induced flow determine the path of the liquid and the segregation caused thereby; 415
• the weakly permeable packed layer (low gl), where shrinkage flow dominates the solute
416
transport, leading to a negative segregation tendency in the center and positive at the 417
periphery. 418
The coupling and superposition of these phenomena, the roots of the final macrosegregation pattern, 419
were investigated in detail in [1,45]. It was shown that the grain transport is not only directly 420
responsible for the creation of the negative centerline segregation, but also changes the sump shape 421
and thus modifies the trajectory of the natural convection and shrinkage flow and the segregation they 422
cause. The cooperation of the listed transport phenomena results in a radial segregation profile, shown 423
in Fig. 10. The predicted profile is qualitatively similar to the experiment and both show a strong 424
negative segregation in the billet center, a weak positive segregation from the mid-radius outwards, 425
and a neutral or slightly negative segregation at the surface of the billet. 426
Figs. 9 and 10 show that the shape and the intensity of the predicted macrosegregation are strongly 427
dependent on the morphology of the equiaxed grains. To a smaller, but significant degree the 428
predicted segregation also depends on the packing fraction used in the computations. The segregation 429
in case of globular morphologies is systematically stronger than in case of dendritic morphologies. 430
The most striking difference is a stronger negative centerline segregation. The negative centerline 431
segregation is favored by settling of solute-lean grains and expulsion of solute-rich liquid. If the grains 432
have a globular morphology, they settle into a compact packing, carrying a large volume of solute-433
lean solid phase. In comparison, ramified dendritic grains create a loose packing, with a smaller 434
volume of solid phase replacing the solute-rich liquid. Supposing that the globular and dendritic 435
grains pack at the same envelope fraction, the ratio of solid fraction in the packed layer between 436
dendritic and globular grains is of the order of gip, the internal solid fraction of the dendritic grains at
437
the packing front. The difference in the segregation induced by settling can be seen in the average 438
concentration of the sedimentation layer at the packing front, which is much lower in the case of 439
globular grains (Fig. 9a) than in the case of dendritic grains (Fig. 9b). 440
Figure 9: Macrosegregation of copper in the billet. Fields of average concentration for packing fractions of gep = 0.20 and gep = 0.40 and both dendrite tip models: (a) paraboloidal tip model and (b) hemispherical tip model.
Figure 10: Macrosegregation in the grain-refined billet. Profiles of copper concentration from simulations with different packing fractions and both dendrite tip models: (a) paraboloidal tip model and (b) hemispherical tip model. The model predictions are compared to the experimental profiles and to simulations of Vreeman et al. [14].
443
Figure 11: Macrosegregation in the non grain-refined billet. Profiles of copper concentration from simulations with different nucleation densities and both dendrite tip models: (a) paraboloidal tip model and (b) hemispherical tip model. The model predictions are compared to the experimental profiles and to simulations of Vreeman et al. [14]. N0 refers to the distribution of nucleation sites shown in Fig. 3.
A further effect of the morphology is the drastic influence on the hydrodynamic permeability of the 445
packed layer. The more closely packed globular grains result in a packed layer with a solid fraction 446
of gep. This packed zone is less permeable than the loosely packed layer of dendritic grains, whose
447
solid fraction is lower, i.e., gip gep. The flow of intergranular liquid in the packed layer is a result of a
448
balance between buoyancy forces, suction due to solidification shrinkage, and drag forces exerted by 449
the matrix of packed grains. Inertial forces become negligible and in steady state the force balance 450
can be approximated by the Darcy equation: 𝑔*W𝜇
* 𝐾 𝑣* *− 𝑣' ' ≈ −𝑔*𝛻𝑝 + 𝜌*_𝑔*𝑔. At low 451
permeability, such as in the closely packed globular layer, the drag forces increase, making the 452
buoyancy negligible. The percolation through the packed layer is then governed by a subtle interplay 453
of drag and solidification shrinkage and its trajectory largely depends on the shape of the field of gl
454
(the shape of the packed layer and the progression of solidification within). In a dendritic packed 455
layer the permeability at the packing front is larger, which allows the buoyancy forces to exert an 456
influence on the flow up to a certain depth into the packed layer. This modifies the trajectory of the 457
liquid through the mushy zone and thus impacts the macrosegregation, generally diminishing the 458
negative segregation in the center [1]. Our interpretations are based on simulations that use the same 459
characteristic microstructure length for the permeability (lc = 75 µm in Eq. (11)) for globular and for
460
dendritic packed layers. This is done due to lack of accurate information on the grain size and the 461
dendrite spacing from the experiment. It is not clear whether this assumption is always reasonable. 462
The characteristic length for permeability is often approximated by the secondary dendrite arm 463
spacing (SDAS) in dendritic layers and by the grain size in globular layers. Dendritic grains are larger 464
than globular grains, but if their SDAS is very fine (which is not the case for coarse dendrites often 465
encountered in DC casting), the characteristic length for permeability in a dendritic packed layer can 466
be smaller than that of the globular packed layer. Therefore, the permeability of a dendritic packed 467
layer is not necessarily larger. 468
The effect of the packing fraction is similar for both grain morphologies (Fig. 10). An increase of the 469
packing fraction leads to an amplification of the negative centerline segregation and to a shift of the 470
positive segregation towards the billet surface. More extensive settling of solute-lean grains amplifies 471
the negative segregation in the ingot center. In reaction, it enhances the positive segregation in the 472
rest of the billet. However, due to the cylindrical geometry the amplification of the positive 473
segregation is less marked in the concentration profile. The shift of the positive segregation towards 474
the ingot surface is linked to the modification of the flow pattern. The raise of the packing front 475
displaces the main flow loop towards the billet surface (Fig. 9a–b and c–d) and thus impacts the flow 476
that is responsible for the macrosegregation formation. 477
The packing fraction impacts on the flow in two ways. First, the flow intensity increases due to an 478
enhanced sedimentation of the solid grains, which drag along the liquid. When the packing fraction 479
varies from 0.20 to 0.40, the maximum liquid velocity increases from 1.2 cm/s to 1.6 cm/s for globular 480
grains and from 0.09 cm/s to 1.5 cm/s for dendritic grains. The enhanced sedimentation is mainly due 481
to a larger grain size. Because the grains grow up to a higher envelope fraction before packing, the 482
equivalent grain diameter at packing increases from 125 to 150 µm for globular grains and from 140 483
to 170 µm for dendritic grains. Because the ratio of buoyancy to drag forces increases with the grain 484
size, the settling velocity thus increases with the packing fraction. At the same equivalent diameter, 485
the settling velocity of dendritic grains is smaller than that of globular grains due to the larger drag. 486
The second effect of the grain packing fraction concerns the region where the liquid flow develops. 487
Delaying the packing in terms of grain fraction does not imply a deepening of the sump as could 488
possibly be expected. Instead, a global upward shift of the whole mushy zone occurs due to enhanced 489
cooling and due to enhanced motion of grains to the center. The depth of both the mushy zone and of 490
the liquid zone decrease. It is interesting to note that this decrease is more pronounced with globular 491
grains. The reason is a larger enhancement of the heat transfer due to a more intense transport of the 492
solid phase. Conversely, the decrease of the liquidus depth is stronger with dendritic grains, because 493
a larger portion of the mushy zone is affected by the modification in the packing fraction (the grains 494
globularize, this means that the increase of the envelope fraction is slower than the increase of the 495
solid fraction). 496
Overall, the best agreement of the simulations with the experiment on the grain refined billet is 497
obtained with the paraboloidal tip model (predicting globular grains) and with an envelope packing 498
fraction of gep = 0.20. This holds for all compared characteristics: the segregation profile, the thermal
499
field and the sump geometry. This packing fraction is smaller than the solid packing fraction of gsp=
500
0.30 that was used in previous simulations of this billet [14]. Vreeman et al. commented that a better 501
fit for the sump shape would be obtained with a solid packing fraction lower than 0.30. Note that the 502
packing fractions used in both model studies are much lower than the maximum value for random 503
close packing of monodisperse spheres, which is around 0.65 [46,47]. Values of solid fraction at 504
packing usually used in DC casting modeling range from 0.15 to 0.3 [1,22,26,45,48,49]. It is also 505
interesting to note that in the Al–6 wt%Cu alloy, the density of the liquid phase becomes higher than 506
the solid density when the solid fraction increases above 0.4. Thus the grains have the tendency of 507
floating instead of settling. It is possible that the packing of the grains is affected by this inversion of 508
the density difference. 509
510
4.4. Influence of the amount of grain refiner on the macrosegregation and
511
discussion on the non grain refined billet
512
In DC casting, inoculants are usually added to the melt in order to refine the grain size. The absence 513
of grain refinement affects the microstructure as well as the macrosegregation. Generally, 514
experimental observations have shown an increase of grain size, a dendritization of the grain 515
morphology and weaker macrosegregation at the centerline [2,12,17,19]. In the billet analyzed by 516
Vreeman et al. [14], the removal of grain-refiner led to a slight decrease of macrosegregation. This 517
can be seen by comparison of the experimental profiles shown in Figs. 10 and 11. Although 518
characterizations of the microstructure have not been performed in the experiments, we can 519
reasonably assume that in a non grain refined ingot the average grain size is larger and the grain 520
morphology is more dendritic. The model should be able to reproduce such a transition of 521
microstructure and macrosegregation between a refined and a non-refined casting. 522
The modeling of a non grain refined casting is not straightforward. Vreeman et al. assumed a fixed 523
solid phase in their simulations of the non grain refined billet. As seen in Fig. 11, this strategy gave 524
incorrect results. The assumption of a fixed solid would be adequate for a columnar microstructure. 525
However, the measured macrosegregation profiles as well as other experiments on non grain refined 526
DC castings [12,18,50] indicate that the microstructure remains mostly equiaxed even in the absence 527
of grain refinement. The present model is well adapted for describing heterogeneous athermal 528
nucleation on inoculant particles with a known size distribution. In the absence of inoculant particles 529
the population and the distribution of nucleation sites are not known. We tried to reproduce the 530
influence of the grain refiner by altering the total population of the inoculant particles in the 531
simulations. The nucleation was thus still described by the athermal heterogeneous nucleation model, 532
but with a smaller number of nucleation sites. The level of refiner addition was varied by factors 10 533
with respect to the nominal refiner density of N0 =1 kg/t. Four levels of grain refinement were
534
simulated: 10 kg/t (N0×10), 1 kg/t (N0), 0.1 kg/t (N0/10) and 0.01 kg/t (N0/100). The same type of
535
particle size distribution (as shown in Fig. 3) was used; only the population density of all inoculant 536
particle classes was modified by the same factor. The envelope packing fraction was set to gep =0.20
537
in all simulations, since it gave the most accurate results for the grain-refined billet. The goal is not 538
only to check whether the model is able to reproduce the experimentally observed macrosegregation 539
in the non-refined billet, but also to analyze the effect of the refiner level on the structure. 540
Figs. 12a and 12b provide information about the microstructure in the billet predicted by our model. 541
They show the effect of the refiner addition level on the average grain size (represented by the mean 542
final equivalent grain diameter, 𝑑') and on the grain morphology (represented by the mean internal 543
solid fraction at the packing front, gip), as predicted by both dendrite tip models. The mean final
544
equivalent grain diameter is calculated as the equivalent grain diameter after complete solidification 545
and by excluding the eutectic fraction: 546
𝑑' = ‚ GVBZªz ƒ•„
G `
, (13)
where 𝑔"Iv is the mean eutectic volume fraction predicted by the model and 𝑁' is the mean grain 547
density. The effect of the inoculant density (grain refiner level) is similar for the two dendrite tip 548
models: a reduction of the refiner level leads to an increase of the grain size and to a more dendritic 549
morphology. On the opposite, an increase of the refiner level leads to smaller and more globular 550
grains. However, important differences remain in the microstructure predictions, depending on the 551
tip model used. The refiner level has a greater impact on the microstructure when the hemispherical 552
model is considered, both in terms of grain size and morphology. With the hemispherical tip growth 553
model, grains are already dendritic for the highest refiner level, and become even more dendritic 554
when the refiner level is lowered. With the paraboloidal tip growth model, only the lowest refiner 555
level leads to a significant reduction of the mean internal fraction. With higher refiner levels grains 556
remain globular. 557
558
Figure 12: Microstructure and macrosegregation as a function of the nucleation density, predicted by both dendrite tip models. N0 refers to the distribution of nucleation sites shown in Fig. 3. (a) Mean final grain density and mean equivalent grain diameter. (b) Mean internal solid fraction at packing (gip) and mean segregation index. Full symbols indicate globular and empty symbols dendritic grain