HAL Id: ensl-00132163
https://hal-ens-lyon.archives-ouvertes.fr/ensl-00132163
Submitted on 20 Feb 2007HAL is a multi-disciplinary open access
archive for the deposit and dissemination of sci-entific research documents, whether they are pub-lished or not. The documents may come from teaching and research institutions in France or abroad, or from public or private research centers.
L’archive ouverte pluridisciplinaire HAL, est destinée au dépôt et à la diffusion de documents scientifiques de niveau recherche, publiés ou non, émanant des établissements d’enseignement et de recherche français ou étrangers, des laboratoires publics ou privés.
phosphorylation of histone H3 in chromosomal
subdomains
Karine Monier, Sandrine Mouradian, Kevin Sullivan
To cite this version:
Karine Monier, Sandrine Mouradian, Kevin Sullivan. DNA methylation promotes Aurora-B-driven phosphorylation of histone H3 in chromosomal subdomains. Journal of Cell Science, Company of Biologists, 2007, 120 (1), pp.101-114. �10.1242/jcs.03326�. �ensl-00132163�
Introduction
The view establishing the cell nucleus as a highly structured organelle, where the confinement of enzymatic reactions to nuclear sub-domains dictates functional organization, has gained increasing support (Hall et al., 2003; Sugiyama et al., 2005; Taddei et al., 2001). At the molecular level, attention has focused on post-translational modifications affecting DNA-packaging proteins called histones. Histone post-translational modifications act sequentially or in combination to form a histone code that is read by other proteins to bring about distinct downstream events (Strahl and Allis, 2000). A chromatin environment with a distinctive biochemical identity results, for instance, from the concentration of tri-methyl histone H3-Lys 9 (H3K9me3) in heterochromatin. H3K9 methylation is mediated in part by histone methyl transferase SUV39H1 (Aagaard et al., 1999; Rea et al., 2000), which creates high-affinity binding sites for heterochromatin protein 1 (HP1) (Lachner et al., 2001). In addition, constitutive heterochromatin exhibits a high density of methyl cytosines, established and maintained by the local recruitment of DNA methyl transferases (DNMT) (Li, 2002). Like methyl histone, methyl DNA provides high-affinity binding sites for
methyl-binding-domain proteins (Wade, 2001). Thus, distinctive combinations of histone and DNA modifications can specify the functional properties of a chromosomal domain via the recruitment of effector proteins (Richards and Elgin, 2002).
Constitutive heterochromatin is primarily concentrated around centromeres in the interphase nucleus. We will refer to these domains as pericentromeres. Variable amounts of heterochromatin are found in pericentromeres of different chromosomes (Miller and Therman, 2000). Cytogenetic studies have shown that human chromosome 1 contains the largest block of pericentromeric heterochromatin, followed by chromosomes 9 and 16, whereas the acrocentric chromosomes (13,14,15,21,22) contain medium-sized blocks of heterochromatin at pericentromeres (Lee et al., 1997). Other human chromosomes like chromosomes 2, 18 and 20 possess very small blocks of heterochromatin at pericentromeres. Three different families of satellite sequences comprise these heterochromatin blocks. For instance, satellite 2 is the main component of pericentromeres of chromosome 1 and 2, whereas satellite 3 is the component of pericentromere of chromosome 9 and one of the components of pericentromeres of acrocentric chromosomes (Lee et al., 1997). However, aside Confinement of enzymatic reactions to nuclear and
chromosomal subdomains regulates functional organization of the nucleus. Aurora-B kinase regulates cell-cycle-dependent phosphorylation of chromosomal substrates through sequential localization to a series of sites on chromosomes and the mitotic spindle. In G2 nuclei, Aurora-B recruitment to heterochromatin restricts histone H3S10 phosphorylation to a domain around centromeres (pericentromeres). However, no intrinsic chromosomal determinants have been implicated in Aurora-B recruitment to interphase pericentromeres. Using cyclin B1 as a cell-cycle marker, we found that the great majority of nuclei exhibiting H3S10 phosphorylated foci were positive for cyclin B1, thus revealing that H3S10 phosphorylation arises at pericentromeres during late S phase and persists in G2. By immunofluorescent in situ hybridization, Aurora-B and H3S10 phosphorylated foci were found more
frequently at larger pericentromeres than at smaller ones, revealing a preferential phosphorylation of pericentromeres, exhibiting a high density of methyl cytosines. Disruption of DNA methylation inhibited pericentromeric Aurora-B targeting and H3S10 phosphorylation in G2 nuclei, thus demonstrating the role of DNA methylation in Aurora-B targeting to pericentromeres. These results favour the idea that DNA methylation maintains a local environment essential for regulating the functional properties of sub-chromosomal domains during S-G2 progression.
Supplementary material available online at
http://jcs.biologists.org/cgi/content/full/120/1/101/DC1
Key words: Pericentromeres, Heterochromatin, Aurora-B, Histone H3 phosphorylation, DNA methylation, G2 phase
Summary
DNA methylation promotes Aurora-B-driven
phosphorylation of histone H3 in chromosomal
subdomains
Karine Monier1,2,*, Sandrine Mouradian2and Kevin F. Sullivan1,‡
1The Scripps Research Institute, Department of Cell Biology, CB163, 10550 N. Torrey Pines Road, La Jolla, CA 92037, USA
2Group Epigenetics of Pericentromeres, Laboratory of Molecular Biology of the Cell, CNRS UMR 5161, INRA U 1237, IFR 128, Ecole Normale
Supérieure de Lyon, 46 allée d’Italie, 69364 Lyon CEDEX 07, France
*Author for correspondence (e-mail: kmonier@ens-lyon.fr)
‡Present address: Department of Biochemistry, National University of Ireland, Galway, University Road, Galway, Ireland
Accepted 23 October 2006
Journal of Cell Science 120, 101-114 Published by The Company of Biologists 2007 doi:10.1242/jcs.03326
Jour
from gene-silencing effects (Richards and Elgin, 2002), the chromosomal function associated with the size and composition of heterochromatin blocks at pericentromeres is unknown.
Several lines of evidence have shown that histone post-translational modifications can be submitted to cyclic variations during transcription, the cell cycle, cell differentiation and tumorigenesis (Bannister and Kouzarides, 2005; Fischle et al., 2003). For instance, highly localized histone H3S10 phosphorylation correlates with transcriptional stimulation of euchromatic genes (reviewed by Berger, 2001). In addition, histone H3S10 phosphorylation was found to mark pericentromeres in G2 cells and to decorate mitotic chromosomes (Hendzel et al., 1997), accumulating during G2-M in synchronized cells (Shelby et al., 2000). Evidence towards a function of mitotic histone H3 phosphorylation in chromosome segregation was found in Tetrahymena, fission yeast and humans (Mellone et al., 2003; Ota et al., 2002; Wei et al., 1999). So far, the biochemical pathway linking histone H3 phosphorylation to chromosome segregation has not been deciphered.
Mitotic phosphorylation of histone H3 at Ser10 is governed by Aurora-B (Aur-B) (Crosio et al., 2002; Giet and Glover, 2001; Hsu et al., 2000). Although the related kinase Aurora A (Aur-A) is capable of phosphorylating histone H3S10, mitotic histone H3 phosphorylation was only reduced when Aur-B levels, but not Aur-A levels were decreased by RNA interference (Giet and Glover, 2001; Hsu et al., 2000; Scrittori et al., 2005). During interphase Aur-B is localized in the nucleus, while Aur-A localization is restricted to the cytoplasm (Ducat and Zheng, 2004). Aur-B localization evolves during mitosis, following the pattern of canonical ‘chromosome passenger’ proteins and is sequentially nuclear, centromeric, mid-spindle and midbody associated (Crosio et al., 2002; Earnshaw and Bernat, 1991; Zeitlin et al., 2001b). Confinement and trafficking of these enzymes to specific cellular domains appears to be a key mechanism for regulating catalytic activity against specific substrates.
Aur-B functions during mitosis to ensure accurate chromosome segregation and timely cytokinesis (Andrews et al., 2003; Shannon and Salmon, 2002) via sequential association with inner centromere domains and spindle midzone. Consistent with a role of Aur-B in chromosome stability, Aur-B is frequently overexpressed in cancer (Meraldi et al., 2004). In vitro experiments have shown that the vertebrate Aur-B kinase exists in a passenger protein complex with INCENP (inner centromeric protein), survivin and borealin (Vagnarelli and Earnshaw, 2004). Depletion of any of these four proteins generally causes mitotic mislocalization of the other passengers, resulting in loss of function (Andrews, 2005). In mammals, Aur-B first localizes to pericentromeres in G2 or even S phase (Crosio et al., 2002; Zeitlin et al., 2001b). However, the reason behind the affinity of passenger proteins for pericentromeres has remained obscure. Understanding the basis for cell-cycle-specific targeting of Aur-B is important for understanding its role in the regulated progression of interphase and mitotic events.
In this study, we investigated the initial recruitment and associated activity of Aur-B on histone H3S10 in human interphase nuclei. S and G2 markers were used to dissect the occurrence of H3S10P foci during the cell cycle, and
immunofluorescent in situ hybrdization (immuno-FISH) approaches were performed to investigate the frequency of H3S10P and Aur-B foci at specific pericentromeres. Finally, two approaches leading to DNA demethylation were applied to unravel the role of DNA methylation in targeting Aur-B to pericentromeres in G2 cells.
Results
Pericentromeric foci of phosphorylated histone H3S10 colocalize with Aurora-B and fail to appear upon kinase inhibition
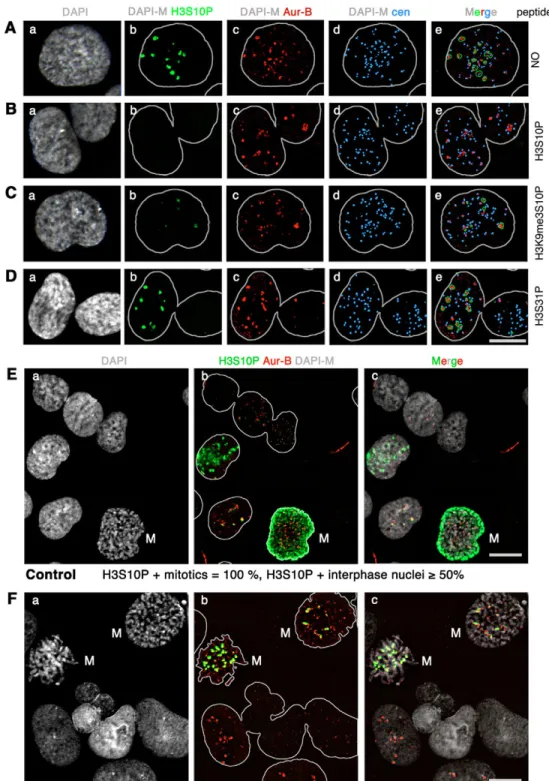
To gain insights into intrinsic chromosomal determinants that drive Aurora-B (Aur-B) recruitment, we focused on the detection of local Aur-B activity at pericentromeres in interphase nuclei, by localizing the phosphorylated form of histone H3S10 (H3S10P) in interphase nuclei. To facilitate the analysis of large numbers of nuclei exhibiting pericentromeric H3S10P foci, we chose the human embryonic carcinoma NT2/D1 cells for their high proportion of G2-M cells (Fig. 6Ba, ~29%). Immunodetection of phosphorylated histone H3S10 appeared as compact nuclear foci (Fig. 1Ab, green), in a subset of interphase NT2 nuclei (for quantification see Fig. 1E). The great majority of H3S10P foci (96%, n=248) colocalized with foci detected with an antibody against Aur-B kinase (Fig. 1A, red), in NT2 nuclei exhibiting between 1 and 40 foci. These nuclear foci were always in the vicinity of a centromere locus (Fig. 1Ad-e), in agreement with a previous report (Hendzel et al., 1997). Pre-incubation with the immunizing H3S10P peptide totally abolished staining obtained with the H3S10P antibody in nuclei exhibiting Aur-B localization at centromeres (Fig. 1Aur-Bb), thus demonstrating antibody specificity. Competition with the doubly modified H3K9me3-S10P peptide did not inhibit H3S10P labelling (Fig. 1Cb), although not as many cells exhibited foci compared with matching controls (Fig. 1Ab,Cb). These results indicate that the H3S10P antibody is highly specific for recognizing the phospho-H3S10 epitope, but can also recognize the H3K9me3-S10P epitope to a certain extent. In any case, focal sites of H3S10 phosphorylation colocalize with Aur-B at pericentromeres.
Aur-B was shown to be the kinase responsible for mitotic phosphorylation of histone H3 at Ser10 (Crosio et al., 2002; Giet and Glover, 2001; Hsu et al., 2000). To formally assess whether pericentromeric H3S10P foci result from Aur-B activity a treatment with VX-680, a potent Aurora kinase inhibitor (Harrington et al., 2004), was performed on NT2 cells. A 300 nM concentration of VX-680 was sufficient to inhibit H3S10P foci in all interphase nuclei (Fig. 1F), which otherwise exhibit foci at a frequency greater than 50% (Fig. 1E). The presence of nuclei exhibiting foci of Aur-B kinase in VX680-treated population (Fig. 1Fb,c, red) indicated that Aur-B activity is not necessary for targeting to pericentromeres. In summary, our results demonstrate (1) Aur-B targeting to pericentromeres in interphase is not dependant upon its kinase activity and (2) pericentromeric H3S10P foci are dependant upon an active Aur-B kinase localized at pericentromeres. Phosphorylated H3S10 delineates pericentromeres in late-S-phase cells and persists during G2
H3S10P foci were previously reported to appear primarily during the G2 phase in HeLa cells (Hendzel et al., 1997). Since
Jour
NT2 populations exhibit more than 50% H3S10P-positive nuclei (Fig. 1E) and were estimated with a 29% G2-M content by flow cytometry analysis (Fig. 6Ba), we asked when H3S10 phosphorylation occurs relative to DNA replication in these cells. To directly assess H3S10P phosphorylation in S-phase cells, DNA replication sites were labelled with a pulse of BrdU, which was then co-detected with H3S10 antibody (Fig. 2A). Image analysis was carried out to determine the percentage of double negative nuclei (Fig. 2Aa-c, BrdU–/H3S10P–), single positive nuclei (Fig. 2Ad-f, BrdU+/H3S10P– and Fig. 2Aj-l, BrdU–/H3S10P+) and double positive nuclei (Fig. 2Ag-i,
BrdU+/H3S10P+). Among NT2 nuclei, 34% were positive for both BrdU and H3S10P (Fig. 2Ag-i), whereas 24% were exclusively positive for BrdU (Fig. 2Ad-f), thus indicating that more than half of the BrdU-positive nuclei exhibited H3S10P foci. It should be noted that double positive cells displayed a late-S-phase replication pattern, consistent with the occurrence of H3S10P foci in late-S-phase cells (Fig. 2Ah). In addition, a lower number of H3S10P foci were found per nucleus exhibiting dual labelling (Fig. 2Ai, 6±2, n=37) compared with the population exclusively positive for H3S10P (Fig. 2Al, 27±18, n=37). This result is consistent with a progressive
Fig. 1. Pericentromeric foci of
phosphorylated histone H3S10 colocalize with Aurora-B and fail to appear upon kinase inhibition. (A) Images of an interphase NT2 nucleus counterstained with DAPI (a) and labelled with the H3S10P (b, green), Aur-B (c, red) and centromeric proteins (d, blue). A merged image generated with a green mask to visualize H3S10P foci is shown (e). (B-D) A peptide competition assay was performed before immunodetection with H3S10P peptide (B), H3K9me3-S10P peptide (C) and an irrelevant H3S31P peptide (D). (E-F) Control (E) and VX-680 treated NT2 cells (F) were counterstained with DAPI (a,c) and labelled with H3S10P and Aur-B (b,c, green and red respectively).
Percentages of mitotic cells (labeled M) and interphase nuclei positive for H3S10P are indicated below. DAPI-M, DAPI mask. Bars, 10 m.
Jour
appearance of H3S10P foci at an increasing number of pericentromere sites from late S to G2 phases. Similar
conclusions were drawn from HeLa cell analysis (data not shown). Therefore our results support the occurrence of H3S10P foci at pericentromeres in late-S-phase cells.
To extend our cell-cycle analysis, we co-detected cyclin B1 together with H3S10P in NT2 nuclei (Fig. 2B). Cyclin B1 accumulates in the cytoplasm of cells during S phase and persists during G2, prior to nuclear internalization at mitosis onset (Pines and Hunter, 1991). Nuclei negative for H3S10P (Fig. 2Ba-f, 41.5%) were predominantly negative for cyclin B1 (Fig. 2Ba-f, 34% of Cyc B1–/H3S10P–). This result is consistent with a deficiency in H3S10P foci in G1 and early S-phase cells, as confirmed when detection was performed on NT2 cells, flow sorted according to their DNA content (data not shown). Nuclei positive for H3S10P (Fig. 2Bg-l, 58.5%) were predominantly positive for cyclin B1 (Fig. 2Bg-l, 54% of Cyc B1+/H3S10P+). To summarize, the presence of H3S10P foci in the nucleus correlates to a great extent with the cytoplasmic accumulation of cyclin B1. Therefore, these results demonstrate the persistent occurrence of H3S10P foci at pericentromeres in a great majority of cells in late S and G2 phases.
Large pericentromeres colocalize more frequently with H3S10P foci than small pericentromeres The progressive appearance of H3S10P foci could reflect sequential H3S10 phosphorylation at specific chromosomes or reflect a stochastic phosphorylation at random chromosomes. To distinguish these possibilities, pericentromeres of individual chromosomes were co-detected with H3S10P (Fig. 3A-C) using a two-step immuno-FISH protocol. Image analysis was performed on image projections constructed from deconvolved optical sections, to evaluate colocalization of FISH signals with H3S10P foci (Fig. 3D, percentage of H3S10P positive pericentromeres). Chromosome 1 signals were very frequently phosphorylated in NT2 nuclei exhibiting H3S10P foci (Fig. 3A,D; 85%). The frequency of a stochastic phosphorylation at random chromosomes can be approximated by the fraction specific chromosomes represent within a nucleus. In NT2, chromosomes 1 represent 6.3% of the total number of chromosomes (4/63). Thus, the measured frequency is about 15 times greater than expected for a random model (85%/6.3%), thus arguing against stochastic phosphorylation at random chromosomes. Rather, pericentromeres of chromosome 1 are preferential targets of H3S10 phosphorylation in human cells, as confirmed by the 14-times-greater measured frequency of the same event in human diploid primary cultures (59%/4.3%).
To determine whether heterochromatin block size at pericentromeres is a crucial factor for defining a chromosome as a frequent site of phosphorylation, we analyzed human chromosome 9, which possess a relatively large pericentromere (Lee et al., 1997) and represent 4.8% (3/63) of the chromosomes in NT2 cells. The 27% frequency measured for H3S10P-positive chromosome 9 signals in NT2 nuclei (Fig. 3D, red bar) was about five times greater (27%/4.8%) than the
Fig. 2. H3S10P foci are enriched in late S-phase cells and correlate with
cyclin B1 expression. (A) NT2 cells submitted to a short BrdU pulse were counterstained with DAPI (grey) and labelled with BrdU (green) and H3S10P (red). Merged images illustrate the four classes of nuclei analyzed:
BrdU–/H3S10P–(c), BrdU+/H3S10P–(f), BrdU+/H3S10P+(i) and
BrdU–/H3S10P+(l). The percentage of nuclei falling into each category is
indicated on the right, as well as the number of H3S10P foci (mean ± s.d.). (B) NT2 cells were counterstained with DAPI (grey) and labelled with cyclin B1 (Cyc B1, green) and H3S10P (red). Merged images illustrate the four classes of nuclei analyzed: Cyc B1–/H3S10P–(c), Cyc B1+/H3S10P–(f), Cyc
B1–/H3S10P+(i), Cyc B1+/H3S10P+(l). The percentage of nuclei falling into
each category is indicated on the right. Bars, 10 m.
Jour
expected frequency for a random model, thus identifying pericentromeres of chromosome 9 as preferential sites for histone H3 phosphorylation. To confirm the large-size rule, we analyzed acrocentric chromosomes 14 and 22, possessing relatively large heterochromatin block (Lee et al., 1997) at pericentromeres and representing 7.9% of the chromosomes in NT2 cells (Fig. 3C-D). As expected, pericentromeres of
chromosomes 14 and 22 (Fig. 3D, pink) were about three times more frequently phosphorylated than expected for a random model (25%/7.9%). The positive correlation between heterochromatin block size and pericentromeric histone H3 phosphorylation frequency was further illustrated with the analysis of chromosomes 18, 20 and 2 (Fig. 3B,D light and dark green). These chromosomes possess pericentromeres with small heterochromatic block size (Lee et al., 1997) and represent respectively 6.3% and 3.2% of the chromosomes in NT2 cells, respectively. Ratios obtained between measured and expected phosphorylation frequencies were close to 1 for pericentromeres of chromosomes 18 and 20 (7%/6.3%) as well as for chromosome 2 (4%/3.2%), thus defining these chromosomes as non-preferential sites for H3S10 phosphorylation. Altogether these results demonstrate differential frequencies of pericentromeric histone H3 phosphorylation at individual chromosomes correlated with heterochromatin block size, thus identifying a set of chromosomes with large pericentromeres (chromosomes 1, 9, 14 and 22) as preferential sites of histone H3S10 phosphorylation.
Differential frequencies of pericentromeric Aur-B localization with passenger proteins parallels H3S10P preferential appearance in interphase To investigate whether recruitment of Aur-B kinase was involved in the regulation of differential histone H3 phosphorylation at pericentromeres, immuno-FISH was carried out to detect Aur-B and pericentromeres of chromosomes 1 and 2 (Fig. 4A-B). Colocalization between Aur-B foci and pericentromeres of chromosome 1 and 2 was determined by image analysis in NT2 cells (Fig. 4B). As previously reported for phosphorylation, many chromosome 1 signals were positive for Aur-B kinase in nuclei exhibiting Aur-B foci (Fig. 4B, purple, 97%), whereas few positive signals were obtained with chromosome 2 (Fig. 4B, green, 5%). In summary, Aur-B localization at pericentromeres is also differentially regulated at individual chromosomes, paralleling the large-size rule observed above for the distribution of its catalytic activity. In agreement with a role of Aur-B in the regulation of histone H3 phosphorylation at pericentromeres, we observed that inhibition of Aur-B targeting at large pericentromeres results in a low frequency of H3S10P appearance at pericentromeres in U2-OS cells (data not shown). Therefore, Aur-B recruitment controls the preferential occurrence of H3S10P sites.
To assay whether Aur-B activity was associated with kinase co-activators in interphase, as occurs in mitosis (Bolton et al., 2002; Honda et al., 2003; Wheatley et al., 2004), survivin and INCENP were immunodetected in NT2 nuclei (Fig. 4C-F). At interphase, both survivin and INCENP label nuclear foci in a subset of nuclei (Fig. 4Cb,Db), whereas in mitotic cells, the typical passenger protein pattern was observed for both proteins (see Fig. S1 in supplementary
Fig. 3. Large pericentromeres colocalize more frequently with H3S10P foci than
small pericentromeres. (A-C) Immuno-FISH images display pericentromeres of human chromosome 1 (A), chromosome 2 (B) and chromosomes 14 and 22 (C) in NT2 nuclei exhibiting fewer than ten (a-d), or more than ten H3S10P foci (e-h). Bar, 10 m. (D) Percentage of phospho-H3 positive pericentromeres in populations of NT2 nuclei exhibiting phospho-H3 foci is shown for seven human chromosomes, as indicated. The number of FISH signals analyzed is indicated for each chromosome (with legends).
Jour
material for survivin), as previously reported (Adams et al., 2001). The great majority of INCENP and survivin foci colocalize with Aur-B foci in interphase NT2 nuclei (Fig. 4Ed,Fd). As in mitosis, survivin and INCENP are associated with Aur-B kinase in interphase nuclei, in agreement with the detection of its catalytic activity at pericentromeres (see above and Fig. 1) and biochemical observations indicating that these three proteins always interact (Bolton et al., 2002). In summary, our results show clear evidence of in situ colocalization of INCENP and survivin with Aur-B. The differential frequencies of pericentromeric Aur-B localization with passenger proteins parallel the preferential appearance of H3S10P in interphase nuclei.
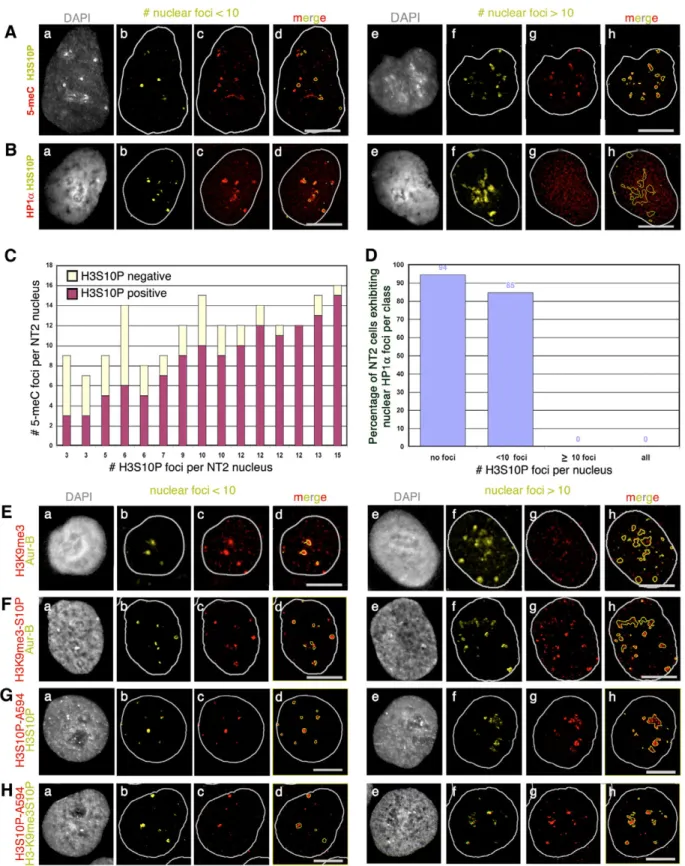
Heterochromatin composition of large pericentromeres in interphase nuclei exhibiting less than 10 H3S10P foci In the search for a sequence-independent factor concentrated at large pericentromeres when Aur-B was recruited, we examined the distribution of heterochromatic marks, namely
5-methylcytosine (5-meC), HP1␣, H3K9me3 and the doubly modified epitope H3K9me3-S10P (Fig. 5). Detection of 5-meC in NT2 nuclei (Fig. 5A) revealed the presence of 7-16 large accumulations per nucleus (Fig. 5C). In nuclei exhibiting up to 10-15 H3S10P foci, more than 95% of H3S10P foci colocalized with the largest 5-meC accumulations (Fig. 5C), indicating that DNA is methylated at large pericentromeres when H3S10 gets phosphorylated. The heterochromatic composition of large pericentromeres was confirmed when HP1␣, was codetected with H3S10P in NT2 nuclei (Fig. 5B). Indeed, H3S10P foci colocalized to a great extent with HP1␣ accumulations in nuclei exhibiting no more than ten H3S10P foci (Fig. 5Ba-d). Altogether, these results show that composition of large pericentromeres includes DNA methylation and HP1␣, in nuclei exhibiting H3S10 phosphorylation at less than ten pericentromeres.
To investigate the permanence of these heterochromatic marks, the composition of large pericentromeres was analyzed by immuno-fluorescence with cell-cycle markers. In nuclei
Fig. 4. Aur-B foci colocalize more frequently
with large pericentromeres and other passenger proteins in interphase nuclei. (A,B) Aur-B colocalizes frequently with pericentromeres of chromosome 1 in interphase NT2 nuclei. Aur-B (c, blue) was immunodetected with pericentromeres of chromosome 1 (b, pC1, red) in NT2 nuclei, counterstained with DAPI (a). Percentages of Aur-B positive pericentromeres in populations of NT2 nuclei exhibiting Aur-B foci are shown for chromosomes 1 and 2 (B). The number of FISH signals analyzed is indicated for each chromosome (n). (C,D) NT2 cells counterstained with DAPI (a) were detected separately with survivin (Cb, green) and INCENP (Db, green). Both passenger proteins labelled foci in a subset of interphase nuclei. (E-F) NT2 cells counterstained with DAPI (a) were co-detected with survivin and Aur-B (E) or INCENP and Aur-B (F). Merged images show that the great majority of foci detected with survivin or INCENP colocalize with Aur-B (d). Detection of survivin and INCENP in mitotic cells follow the typical passenger protein pattern (see Fig. S1 in supplementary material for survivin). Bars, 10 m.
Jour
Fig. 5. Heterochromatic nature of large pericentromeres in nuclei exhibiting no more than ten H3S10P or Aur-B foci. (A-B) NT2 nuclei
immunodetected with H3S10P (yellow) and 5-meC (red in A) or HP1␣ (red in B), exhibiting fewer than ten (a-d) or more than ten H3S10P foci (e-h). (C) Histogram of the total number of 5-meC accumulations, positive (red) or negative (yellow) for H3S10P according to the number of foci per NT2 nucleus, as displayed in A. (D) Histogram of the percentage of 94 randomly taken NT2 cells exhibiting HP1␣ accumulations, as shown in B, according to the presence of pericentromeric H3S10P foci (no foci, fewer than ten foci, at least ten foci). (E,F) H3K9me (red in E) or H3K9me3-S10P (red in F) foci colocalize with Aur-B (yellow) in NT2 nuclei exhibiting fewer than ten (a-d) or more than ten nuclear foci (e-h). (G,H) H3S10P-A594 foci (red) colocalize with H3S10P (yellow in G) and H3K9me3S10P (yellow in H) in NT2 nuclei exhibiting fewer than ten (a-d) or more than ten nuclear foci (e-h). Bars, 10 m.
Jour
exhibiting more than ten H3S10P foci, 5-meC accumulations were still present and appeared to colocalize with a subset of H3S10P foci (Fig. 5Ae-h). Accumulations of 5-meC were also detected in mitotic cells as well as in H3S10P-negative interphase nuclei (data not shown), thus illustrating the
permanent nature of DNA methylation at pericentromeres during the cell cycle. By contrast, HP1␣ appeared as a diffuse nuclear staining in nuclei exhibiting more than ten H3S10P foci (Fig. 5Be-h), thus suggesting a dissociation of HP1␣ from large pericentromeres in G2 nuclei. The disappearance of
Fig. 6. 5-Azacytidine-induced
DNA demethylation partially inhibits Aur-B driven
phosphorylation of histone H3 at pericentromeres in interphase nuclei. (A) Images of NT2 nuclei, control (a) or treated with 5-azacytidin (b), counterstained with DAPI and immunodetected with 5-methylcytosine (green). For comparison purposes, 5-methylcytosine images are displayed with the same dynamic scale. Nuclear intensity of 5-methylcytosine signals was quantified on control and 5-AzaC-treated populations (c). Histogram of the integrated intensity per nucleus for both populations normalized by the nuclear integrated intensity of negative control population (c, third column, no HCl). Error bars correspond to s.d. of the analyzed populations and n corresponds to the number of analyzed nuclei. (B) Cell-cycle analysis of exponentially growing NT2 cells by flow cytometry. The ModFit LT software was used to estimate the percentage of cells with a G1, S and G2-M content in control (a) and 5-azacytidin treated populations (b). (C) Western blot analysis of whole NT2 extracts detected with Aur-B (top) and H3S10P (bottom), in equally loaded populations of control (lane 1) and 5-AzaC-treated cells (lanes 2 and 3). (D,E) Analysis of cyclin B1 expression in NT2 cells treated with 5-AzaC. Representative fields of views of control (Da) and 5-AzaC treated NT2 cells (Db) counterstained with DAPI (insets, grey) and labelled with cyclin B1 (green) and H3S10P (red). Table shows the percentages of cyclin B1 and H3S10P positive nuclei (E, second and third row, respectively) and of doubly labelled nuclei (E, fourth row) obtained in control (E, second column) and in 5-AzaC treated NT2 cells (E, third column). The total number of
analyzed cells, n, is indicated. (F,G) Analysis of HS10P and Aur-B expression in NT2 cells treated with 5-AzaC. Representative field of views of NT2 cells, control (Fa) or treated with 5-AzaC (Fb), counterstained with DAPI (insets, grey) and immunodetected with H3S10P (green) and Aur-B (red). (G) Table of the percentage of cells exhibiting H3S10P foci and uniform H3S10P labelling obtained in control and in 5-AzaC-treated NT2 cells. The total number of analyzed cells, n, is indicated. Bars, 10 m.
Jour
HP1␣ accumulations was only observed in nuclei exhibiting ten and more H3S10P foci (Fig. 5D, ⭓10 foci, 0% positive) and not in nuclei negative for H3S10P (Fig. 5D, no foci, 94% positive), nor in nuclei exhibiting fewer than ten H3S10P foci (Fig. 5D, <10 foci, 85% positive). Therefore, our data are consistent with the maintenance of DNA methylation and the disappearance of HP1␣ foci in G2 nuclei following H3S10P appearance at ten large pericentromeres.
To investigate whether disappearance of HP1␣ foci resulted from the loss of a mark favouring its binding to chromatin, H3K9me3 was codetected with Aur-B in NT2 cells (Fig. 5E). As described above for 5-meC and HP1␣, large pericentromeres labelled by Aur-B colocalize with H3K9me3, in nuclei exhibiting no more than ten Aur-B foci. This result corroborates the heterochromatic composition of large pericentromeres in nuclei exhibiting no more than ten Aur-B foci. Like HP1␣, H3K9me3 foci could not be detected in nuclei exhibiting more than ten Aur-B foci (Fig. 5Ee-h), indicative of a loss of H3K9me3 antigenicity in G2 cells. However, results obtained by immunofluorescence with the doubly modified H3K9me3-S10P epitope (Fig. 5-FH), argued against a real loss of H3K9me3 in interphase nuclei, but rather favour the hypothesis that the addition of a phosphate group on S10 altered the recognition of K9me3 with the single modification-specific antibody. Collectively, these results demonstrate that 5-meC, HP1␣ and H3K9me3 were present at large pericentromeres at the time Aur-B was recruited and activated, and highlight the loss of HP1␣ foci in G2 cells independent of H3K9me3.
Genomic DNA demethylation by 5-azacytidine inhibits pericentromeric appearance of H3S10 foci in G2 cells To investigate whether disruption of one of the cell-cycle permanent heterochromatic marks at large pericentromeres could modify the appearance of histone H3 phosphorylation, we used 5-azacytidine (5-AzaC), which interferes with S-phase maintenance of DNA methylation. NT2 cells treated with 5-AzaC at a concentration of 10 M for 24 hours, displayed a lower 5-meC staining intensity (Fig. 6Ab) compared with control cells (Fig. 6Aa). Images acquired with similar conditions were used to assess 5-meC signal intensities according to negative control cells, for which the essential HCl step was omitted. Quantification of the nuclear 5-meC signals showed a decrease in the normalized integrated intensity, from 1.4 (n=46) in the control population to 1.16 (n=20) in the treated population (Fig. 6Ac). These results highlighted a significant but not complete depletion of 5-meC signal upon a 24-hour treatment with 5-AzaC, thus indicating that a single cell cycle is sufficient to induce a decrease in methyl cytosine level.
Cell-cycle analysis of these populations by flow cytometry (Fig. 6B) revealed an overall decrease in the S-phase fraction for populations treated with 5-AzaC (26%, Fig. 6Bb), compared with the control (34%, Fig. 6Ba), to the benefit of the G1-phase fraction (50% compared with 37%, Fig. 6B). Our results are in agreement with previous observations supporting a G1 cell-cycle arrest (Lavelle et al., 2003). The percentage of cells with a G2-M DNA content did not seem to be affected in NT2 cells treated with 5-AzaC for 24 hours (Fig. 6B) or 48 hours (data not shown). In addition, the amount of Aur-B kinase detected by western blot on NT2 cell extracts was
comparable between 5-AzaC treated samples and a matching control (Fig. 6C, top), thus indicating that 5-AzaC did not inhibit Aur-B kinase expression. Consistent with a reduced Aur-B activity, a small decrease in H3S10P was observed with treatment with 10 M 5-AzaC (Fig. 6C, bottom).
To further examine cell-cycle progression upon 5-AzaC treatment, we analyzed cyclin B1 in 5-AzaC treated populations (Fig. 6D), a late S and G2-M cell-cycle marker (Pines and Hunter, 1992). In control NT2 nuclei, 61% were positive for cyclin B1, whereas 59% were positive for cyclin B1 in the 5-AzaC-treated population (Fig. 6E). This result demonstrates that a major regulator of the cell cycle is cytologically normal after 5-azaC treatment, thus confirming that this treatment does not alter cell-cycle progression during late S and G2 phases. Collectively, our results argue against a grossly abnormal cell-cycle progression during the G2 phase.
To determine whether DNA demethylation induced by 5-azacytidin altered the appearance of Aur-B-mediated histone H3 phosphorylation, microscopy analysis was carried out in control and treated NT2 populations (Fig. 6D,F). In several independent experiments, a great decrease in the percentage of nuclei exhibiting H3S10P foci (85% decrease in Fig. 6E and 68% decrease in Fig. 6G) was observed in 5-AzaC-treated populations compared with matching controls, whereas no systematic difference was observed for the H3S10P-positive mitotic fraction in the 5-AzaC-treated population (Fig. 6G). Therefore, our results support a partial inhibition of H3S10P foci at pericentromeres of cells treated with 5-AzaC. The fact that cyclin-B1-positive nuclei rarely exhibit H3S10P foci in the 5-AzaC-treated population compared with the control (Fig. 6E, 8% in treated vs 54% in control) indicates that only a minority of late S and G2 cells exhibit H3S10P foci. Moreover, detection of Aur-B in 5-AzaC-treated NT2 populations revealed a great decrease in the number of nuclei exhibiting Aur-B foci compared with the matching control (Fig. 6G). Altogether, these results demonstrate that 5-AzaC alters the spatio-temporal appearance of H3S10P pericentromeric foci in G2 cells, by interfering with Aur-B kinase recruitment at pericentromeres.
DNMT1 depletion inhibits pericentromeric appearance of H3S10P foci in G2 cells
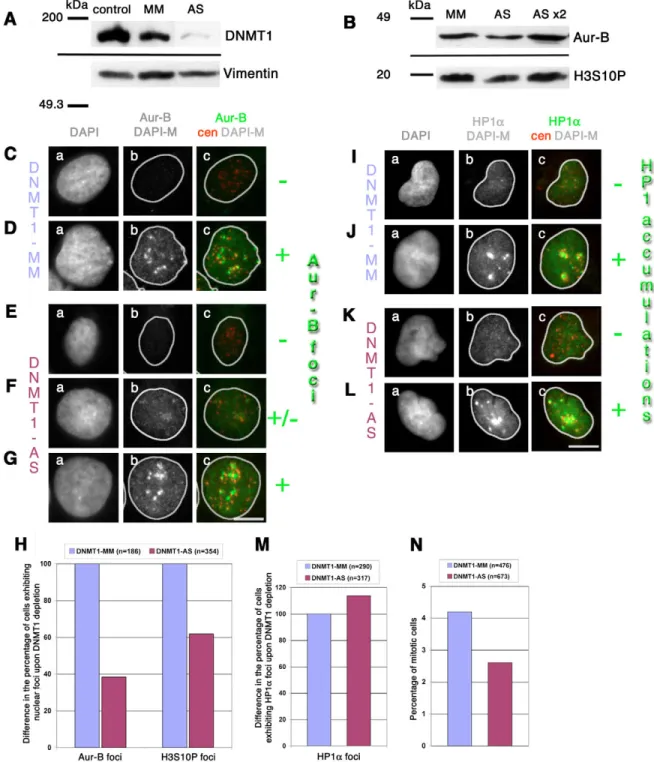
To further probe the role of DNA methylation in Aur-B recruitment and phosphorylation of histone H3 at pericentromeres, an independent method was used to induce genomic hypomethylation. DNA methyl transferase 1 (DNMT1) was knocked down using an anti-sense oligonucleotide (AS), resulting in a decrease of at least 90% in DNMT1 abundance relative to a matching control (population transfected with a mismatch oligonucleotide MM, Fig. 7A). This depletion occurred without significantly affecting Aur-B or phospho-H3 abundance (Fig. 7B). Microscopic analysis of Aur-B in DNMT1-AS cells (Fig. 7C-L) showed a 62% decrease in nuclei with Aur-B foci relative to control cells, whereas the percentage exhibiting nuclear phospho-H3 foci was decreased by 38% (Fig. 7H). A diffuse Aur-B staining was observed in 20% of AS-treated nuclei (Fig. 7Hb, +/–). These results demonstrate that DNMT1 depletion causes Aur-B mislocalization and inhibition of pericentromeric H3S10 phosphorylation. Consistent with our previous results, DNMT1 depletion did not inhibit HP1␣ appearance as nuclear foci (Fig.
Jour
Fig. 7. DNMT1 depletion inhibits Aur-B-mediated histone H3 phosphorylation at pericentromeres. (A) Transfection with antisense
oligonucleotide (AS) resulted in >90% depletion of DNMT1 compared with a mismatched oligonucleotide control (MM). Vimentin was detected as a loading control in western blots. (B) Reduction in Aur-B and phospho-H3 is not greater than 50% in these populations. (C-N) Microscopic analysis of Aur-B, phospho-H3 and HP1␣ in cells transfected with DNMT1-AS and DNMT1-MM oligonucleotides. (C-G) Aur-B and centromere colocalization in cells transfected with DNMT-MM (C,D) and DNMT1-AS (E-G). Examples of cells without (C,E labelled –) and with (D,G labelled +) focal accumulations of Aur-B are shown, as was a third population seen in DNMT1-AS-treated cells that showed a diffuse localization of Aur-B (F, labelled +/–). (H) Histogram summarizing quantification of Aur-B and H3S10P pericentromeric foci in oligonucleotides-treated cells. In each case the DNMT1-MM population was used as a standard, revealing a 62% and 38% decrease in DNMT1-AS cells exhibiting Aur-B and phospho-H3 pericentromeric foci, respectively. (I-N) HP1␣ and centromere colocalization in cells transfected with DNMT1-MM (I,J) and DNMT1-AS (K,L). Examples of cells exhibiting no focal accumulations of HP1␣ (I,K labelled –) and with focal accumulations (J,L labelled +). Bars, 10 m. (M) Histogram represents quantification of cells with focal accumulations of HP1␣ with DNMT1-MM (blue), set as the standard in comparison with DNMT1-AS (red). Number of analyzed nuclei is reported above. (N) Histogram of percentage of mitotic cells scored in the DNMT1-MM (blue) and the DNMT1-AS (red) populations. Number of analyzed nuclei is reported above.
Jour
7I-M), thus indicating that HP1␣ was not a dominant determinant for Aur-B recruitment at pericentromeres. Contrary to 5-AzaC treatment, a decrease in the percentage of mitotic cells from 4.2% in the DNMT1-MM population to 2.6% in the DNMT1-AS population was observed (Fig. 7N). Collectively, our results demonstrate that DNA methylation promotes Aur-B recruitment to large pericentromeres. Discussion
Histone post-translational modifications participate in building up local chromatin environments (Strahl and Allis, 2000). For instance, pericentromeres form variably sized blocks of heterochromatin around centromeres, exhibiting SUV39H1-mediated tri-methyl histone H3-K9, HP1␣ and methyl cytosine (Richards and Elgin, 2002). Histone H3S10 phosphorylation (H3S10P) is found exclusively at pericentromeres of G2 cells, and spreads to chromosome arms during mitosis (Hendzel et al., 1997). Our results are consistent with the exclusive concentration of H3S10P at pericentromeres in late S and G2 cells, and its preferential localization at large pericentromeres in human cells. Cell-cycle-regulated H3S10P is mediated by Aurora-B kinase (Aur-B) in mitotic cells (Crosio et al., 2002; Giet and Glover, 2001; Hsu et al., 2000). Our study provides evidence that Aur-B activity promotes pericentromeric histone H3 phosphorylation in interphase cells (Fig. 1E-F) and is most frequently found at large pericentromeres (Fig. 4B). As a passenger protein, Aur-B localization in mitosis depends on its association with other members of the passenger protein complex (Vagnarelli and Earnshaw, 2004). However, no chromosomal determinants involved in Aur-B recruitment to interphase pericentromeres have been identified to date. In this work, we have used two independent means of inhibiting genomic DNA methylation to show that DNA demethylation inhibits Aur-B recruitment and activity at pericentromeres of interphase nuclei.
The concentration of H3S10P at pericentromeres in late S and G2 cells, is supported by the facts that more than half of the cells incorporating BrdU exhibit H3S10P foci (Fig. 2A) and that the presence of H3S10P foci correlate with cytoplasmic accumulation of cyclin B1 (Fig. 2B), a late S and G2 marker (Pines and Hunter, 1992). These results extend previous observations by Hendzel et al. (Hendzel et al., 1997), by demonstrating that H3S10P foci located at pericentromeres are also present in late S-phase cells. This study corroborates pericentromeric H3S10 phosphorylation in G2 cells, and demonstrates H3S10P persistence at pericentromeres throughout the G2 phase (Fig. 2B). In addition, this study supports the progressive appearance of histone H3S10 phosphorylation at increasing number of pericentromeres as cells progress from S to G2 phase. Therefore, our results are consistent with the view of pericentromeric H3S10P as a physiological timeline initiating at a subset of pericentromeres in late S-phase cells and completing at all pericentromere sites in mid-to-late G2 cells (Zeitlin et al., 2001a).
To detail H3S10P foci progression, the selective appearance at specific chromosomes was conducted by immuno-FISH approaches. Arguing against stochastic phosphorylation at random chromosomes, pericentromeres of chromosomes 1 and 9, containing the largest blocks of constitutive heterochromatin in the human genome (Miller and Therman, 2000), are found to be positive for H3S10P foci 15 and 5
times, respectively, more frequently than expected for a random model in NT2 cells (Fig. 3A,D). By contrast, pericentromeres of chromosome 2, containing a small block of heterochromatin, with the same satellite DNA family as pericentromeres of chromosome 1 (Lee et al., 1997), were not found to be any more frequently positive for H3S10P than expected for a random model (Fig. 3B,D). Therefore, the DNA sequence by itself cannot account for differential histone phosphorylation frequencies at pericentromeres. Rather, the size of pericentromeres modulates the number of heterochromatin-specific modifications affecting histones and DNA and could thereby promote preferential phosphorylation at large pericentromeres.
Aur-B recruitment appears to be the dominant factor in the chromosome-specific appearance of pericentromeric histone H3 phosphorylation. Foci of histone H3S10P fail to appear in interphase nuclei upon kinase inhibition by treatment with the drug VX-680 (Fig. 1E-F). In addition, recruitment of Aur-B to specific pericentromeres parallels that of focal H3S10P. Indeed, Aur-B foci are found more frequently at large pericentromeres than at small ones (Fig. 4B). Consistent with the presence of an active Aurora-B kinase in late S and G2 nuclei, survivin and INCENP are detected at pericentromeres of interphase nuclei with Aur-B (Fig. 4C-F), suggesting that an activated Aur-B complex is recruited to pericentromeres.
The heterochromatic nature of large pericentromeres at the time Aur-B was recruited and activated in interphase is illustrated by the presence of methyl cytosines, methyl H3-K9 and HP1␣ (Fig. 5). However, in nuclei exhibiting several H3S10P foci (around ten in NT2 cells), pericentromeres lose labelling with HP1␣, a major heterochromatin marker (Fig. 5Be-h,D). This loss was not correlated with a change in the tri-methylated form of H3-K9 – the HP1␣ binding site – as shown by staining with an antibody directed against the doubly modified H3K9me3-S10P (Fig. 5F). In agreement, we found that depletion of DNMT1, with concomitant loss of pericentromeric H3S10 phosphorylation, led to an increase in the percentage of NT2 cells exhibiting HP1␣ (Fig. 7M). These observations are consistent with the idea that pericentromeric histone H3 phosphorylation promotes HP1␣ dissociation from heterochromatin in interphase cells. Our results are in agreement with the Aur-B-dependant HP1 dissociation observed in mitotic cells by others (Fischle et al., 2005; Hirota et al., 2005). In this respect, DNA methylation does not share HP1␣ dynamics because it persists at large pericentromeres throughout the G2 phase and mitosis (Fig. 5A).
With respect to the mechanism of demethylation-induced suppression of pericentromeric histone H3 phosphorylation two competing hypotheses can be considered. The first is that genomic DNA demethylation induces changes in gene expression patterns that compromise normal progression through the cell cycle and thereby leads to defects in H3 phosphorylation during G2. The second is that local DNA demethylation leads to a non-permissive environment that fails to promote Aurora-B recruitment and H3 phosphorylation. Two lines of evidence are consistent with the latter hypothesis. Firstly, the quantitative distribution of cyclin B1, a major cell-cycle regulator expressed in late S-G2, is unaffected by 5-AzaC treatment (Fig. 6D-E). Secondly, the abundance of Aur-B in 5-AzaC and DNMT1 AS-treated cells is very similar to control cells (Fig. 6C, Fig. 7B, respectively), arguing against defects
Jour
in the accumulation of the enzyme but rather in localization and activity. These observations suggest that the G2 phase of the cell cycle is grossly normal after hypomethylation, supporting the interpretation that it is defects in heterochromatin-associated DNA methylation that lead to defects in Aurora-B targeting and pericentromeric histone H3 phosphorylation. Defects in H3 phosphorylation at pericentromeres were previously reported in mammalian cells where the histone methyl transferase SUV39H was either overexpressed or deleted (Melcher et al., 2000). We propose that histone H3K9 methylation and DNA methylation act synergistically to regulate histone H3 phosphorylation at pericentromeres of G2 cells. It was also shown that perturbation of the hypoacetylated environment of pericentromeres, by histone deacetylase inhibitors, resulted in a decrease of Aur-B foci and of H3S10P foci (Robbins et al., 2005), in agreement with a supporting role of histone hypoacetylation in Aur-B recruitment. Thus, in addition to these data indicating a role for H3K9 methylation in Aurora-B recruitment, our results support an essential role for DNA methylation in promoting Aur-B-induced histone H3 phosphorylation at pericentromeres of late S and G2 nuclei (Figs 6, 7). Determining the precise mechanism through which DNA methylation influences Aur-B recruitment to pericentromeres will be a challenge for the future.
DNA methylation patterns are commonly altered in human cancer cells (Laird and Jaenisch, 1996). Hypomethylation, a hallmark of tumor cells, affects not only promoter gene regions, but also very large genomic regions like heterochromatic DNA repeats (Ehrlich, 2002). A causal role for DNA hypomethylation in tumor formation was recently shown, with the development of T-cell lymphomas in mice carrying a hypomorphic Dnmt1 allele (Gaudet et al., 2003). Therefore, DNA hypomethylation can be a leading cause of tumorogenesis, although no mechanisms have been suggested to explain the observed increase in chromosome instability (Eden et al., 2003). We showed that DNA hypomethylation inhibits Aur-B recruitment to interphase pericentromeres. As in DNMT1-depleted cells, we found that Aur-B and H3S10P foci are present with a very low frequency in the G2 fraction of several tumor-derived cell lines exhibiting hypomethylated satellite DNA (our unpublished data). Thus, Aur-B mislocalization in interphase may be a contributing factor in chromosome instability subsequent to DNA hypomethylation. Therefore, deciphering the targeting mechanisms involved in Aur-B recruitment to large methylated pericentromeres and how these mechanisms are modified in transformed cells, will yield important insight into cellular regulation of chromosome function in G2 and mitosis.
Materials and Methods
Cell culture and flow cytometry analysis
NT2/D1 were cultured in DMEM supplemented with 10% foetal calf serum, glutamine, non-essential amino acids and antibiotics. For immunofluorescence, cells were grown on 12-mm coverslips for 1-2 days. For Aur-B inhibition, cells were treated with 300 nM of VX-680 (Kava technology) for 24 hours. For BrdU experiments a 40 M BrdU pulse was performed for 15 minutes and cells were fixed immediately. Treatment with 10 M 5-azacytidine was performed for a total of 24 hours. For cell-cycle analysis, exponentially growing cultures were fixed with ethanol and stained with Hoechst 33258 at a concentration of 1 g/ml. Determination of phases of the cell cycle was performed with the ModFit LT software. For anti-sense experiments, NT2 cells were cultured to 50% confluency
and transfected for 24 hours with 90 nM of 4⫻4 hybrid
2⬘-O-methylphosphorothioate antisense (AS, MG88) and mismatched (MM, MG208)
oligonucleotides against human DNMT1 (Fournel et al., 1999), using Mirus TKO reagent, according to the manufacturer’s instructions.
DNA probes and antibodies
Plasmid probes specific for pC1 [pUC 1.77 (Cooke and Hindley, 1979)], pC9 [pMR9a (Rocchi et al., 1991)] and pC14-22 [pZ13A (Archidiacono et al., 1995)] were labelled by random priming with Biotin-dUTP (BioPrime, Gibco-BRL) or TR-dUTP (Molecular Probes). pBS4D (Rocchi et al., 1990) was used to detect both pC2 (major hybridization sites) and pC18-20 (minor hybridization sites). Biotinylated probes and antibodies were detected with streptavidin-A488 (1:400, Molecular Probes). Rabbit sera were used to detect phospho-histone H3S10 [1:300 for IF and 1:3000 for WB (Hendzel et al., 1997)], H3K9me3-S10P [1:500, (Fischle et al., 2005)] and H3K9-me3 [1:1000 (Maison et al., 2002)], INCENP [1:1000 (Cooke et al., 1987)], DNMT1 [1:2500 for WB (Robert et al., 2003)] and a CREST serum was used to detect centromeres (1:1000). The direct coupling of H3S10P antibody with a modified form of Alexa Fluor A594 was performed to obtain H3S10P-A594 according to the supplier’s instructions (Molecular Probes). Image-iT FX signal enhancer (Molecular Probes) was used to replace the blocking buffer and improve the signal to noise ratio when IF was performed with H3S10P-A594. A biotinylated sheep polyclonal antibody was used to detect BrdU (1:200, Biodesign int.). Monoclonal antibodies were used at the following dilutions: anti-Aur-B (1:100 for IF and 1:250 for WB, Transduction Labs), anti-5-meC (1:50), HP1␣ (1:4500, Chemicon, clone 2HP-1H5, MAB3584) and anti-vimentin (1:2000 for WB, Sigma). A goat antibody was used to detect survivin (1:100, Santa-Cruz). Secondary antibodies were obtained from Jackson Immuno Research labs and Molecular Probes.
FISH and immunofluorescence
Basic IF experiments were mainly performed as described previously (Sullivan et al., 1994) and coverslips were mounted with Fluoromount G (EM Sciences) containing 400 ng/ml DAPI. Peptide competition assays were performed by incubating diluted antibodies with a 30 M concentration of modified histone H3 peptides (Upstate or Abcam) for 1 hour at 37°C. For BrdU detection, fixation was performed in 2% paraformaldehyde (PFA) for 10 minutes followed by a 10-minute step in cold methanol:PBS (9:1). Primary antibodies were incubated for 1 hour in 66 mM Tris, 0.66 mM MgCl2, 1 mM 2-mercaptoethanol, pH 8, containing 0.1%
Triton X-100 and 1.6 U/ml of DNAse. For 5-meC detection, cells were fixed in PFA-methanol followed by a 10-minute 2N HCl treatment (de Capoa et al., 1996). In order to maintain fluorescence intensities, H3S10P and centromeres were detected before HCl treatment and post-fixed for 10 minutes in 2% PFA. Immuno-FISH was performed in three steps: basic IF protocol, post-fixation for 10 minutes in 2% PFA and FISH. The FISH procedure was mainly performed as described (Solovei et al., 2002).
Microscopic image acquisition and analysis
Images of cells were obtained with a Delta-Vision wide-field optical sectioning system, based on an Olympus IX70 epifluorescence microscope (Applied Precision, Issaquah, WA). 100⫻ (NA 1.35) or 40⫻ (1.35 NA) neofluor oil-immersion lenses were used with filters optimized to collect fluorescence emission for DAPI, FITC, TR and Cy5 emissions. Alternatively, a motorized Zeiss Axioplan using a 63⫻ objective lens (NA 1.4), equipped with a CoolSNAP HQ CCD camera driven by Metamorph (Molecular Devices, v. 6.3) was used. Five to nine images were collected at intervals of 0.2 to 0.3 m in the z axis for all cells. Image stacks were processed using a 3D constrained iterative deconvolution algorithm (Softworx analysis software, Applied Precision) or a 3D deconvolution procedure (Metamorph) using the measured PSF. Three to five sections containing focused signals were chosen for projection onto one plane for analysis. Projections were further processed to generate digital masks using the magic wand and stroke tools in Adobe®Photoshop to ease visualization of as many as four fluorescent channels.
Quantification on immuno-FISH images (Fig. 3D, Fig. 4B) was assessed as follows. The number of protein and FISH signals were counted for each nucleus analyzed. Colocalization of each FISH signal with phospho-H3 or Aur-B foci was evaluated and scored independently of their colocalization extent. Quantification of 5-meC intensity was performed on single optical section containing the brightest signal using a nucleus mask to assess the integrated intensity value with morphometric tools in Metamorph. A normalization was performed with the integrated intensity of a negative control population, where the HCl step was omitted before immunodetection with 5-meC.
Electrophoresis and immunoblotting
Proteins were resolved by electrophoresis on SDS-PAGE gels (Laemmli, 1970), transferred to PVDF membranes and immunoblotted as previously described (Sullivan et al., 1994).
We acknowledge Fabienne Simian-Lermé and Chantal Bella, heads of the PLATIM Microscopy and Flow Cytometry facilities of the IFR 128 (Lyon, France), respectively. We thank Ana Angulo for kind gift
Jour
of the NT2/D1 cell line. We thank Dave Allis for kind gift of H3S10P antibody and H3K9me3-S10P peptide, Thomas Jenuwein for kind gift of H3K9-me3 antibody, Robert Mac Leod for kind gift of DNMT1 antibody, William C. Earnshaw for kind gift of INCENP antibody and Alain Niveleau for kind gift of 5-meC antibody. K.M. was supported by a fellowship from the Rett Syndrome Research Foundation (RSRF) and from the Foundations Groupama pour la Sante and la Recherche Médicale (FRM). Work in the K.M. laboratory was supported by the Ligue contre le Cancer, Comité du Rhône. Work in the K.F.S. laboratory was supported by the NIH (RO1 GM39068) and a grant from Science Foundation Ireland. Authors thank Sam Zeitlin for critical reading of the manuscript.
References
Aagaard, L., Laible, G., Selenko, P., Schmid, M., Dorn, R., Schotta, G., Kuhfittig, S., Wolf, A., Lebersorger, A., Singh, P. B. et al. (1999). Functional mammalian homologues of the Drosophila PEV-modifier Su(var)3-9 encode centromere-associated proteins which complex with the heterochromatin component M31. EMBO J. 18, 1923-1938.
Adams, R. R., Carmena, M. and Earnshaw, W. C. (2001). Chromosomal passengers and the (aurora) ABCs of mitosis. Trends Cell Biol. 11, 49-54.
Andrews, P. D. (2005). Aurora kinases: shining lights on the therapeutic horizon?
Oncogene 24, 5005-5015.
Andrews, P. D., Knatko, E., Moore, W. J. and Swedlow, J. R. (2003). Mitotic mechanics: the auroras come into view. Curr. Opin. Cell Biol. 15, 672-683. Archidiacono, N., Antonacci, R., Marzella, R., Finelli, P., Lonoce, A. and Rocchi, M.
(1995). Comparative mapping of human alphoid sequences in great apes using fluorescence in situ hybridization. Genomics 25, 477-484.
Bannister, A. J. and Kouzarides, T. (2005). Reversing histone methylation. Nature 436, 1103-1106.
Berger, S. L. (2001). An embarrassment of niches: the many covalent modifications of histones in transcriptional regulation. Oncogene 20, 3007-3013.
Bolton, M. A., Lan, W., Powers, S. E., McCleland, M. L., Kuang, J. and Stukenberg, P. T. (2002). Aurora B kinase exists in a complex with survivin and INCENP and its kinase activity is stimulated by survivin binding and phosphorylation. Mol. Biol. Cell 13, 3064-3077.
Cooke, C. A., Heck, M. M. and Earnshaw, W. C. (1987). The inner centromere protein (INCENP) antigens: movement from inner centromere to midbody during mitosis. J.
Cell Biol. 105, 2053-2067.
Cooke, H. J. and Hindley, J. (1979). Cloning of human satellite III DNA: different components are on different chromosomes. Nucleic Acids Res. 6, 3177-3197. Crosio, C., Fimia, G. M., Loury, R., Kimura, M., Okano, Y., Zhou, H., Sen, S.,
Allis, C. D. and Sassone-Corsi, P. (2002). Mitotic phosphorylation of histone H3: spatio-temporal regulation by mammalian Aurora kinases. Mol. Cell. Biol. 22, 874-885.
de Capoa, A., Menendez, F., Poggesi, I., Giancotti, P., Grappelli, C., Marotta, M. R., Di Leandro, M., Reynaud, C. and Niveleau, A. (1996). Cytological evidence for 5-azacytidine-induced demethylation of the heterochromatic regions of human chromosomes. Chromosome Res. 4, 271-276.
Ducat, D. and Zheng, Y. (2004). Aurora kinases in spindle assembly and chromosome segregation. Exp. Cell Res. 301, 60-67.
Earnshaw, W. C. and Bernat, R. L. (1991). Chromosomal passengers: toward an integrated view of mitosis. Chromosoma 100, 139-146.
Eden, A., Gaudet, F., Waghmare, A. and Jaenisch, R. (2003). Chromosomal instability and tumors promoted by DNA hypomethylation. Science 300, 455.
Ehrlich, M. (2002). DNA methylation in cancer: too much, but also too little. Oncogene 21, 5400-5413.
Fischle, W., Wang, Y. and Allis, C. D. (2003). Histone and chromatin cross-talk. Curr.
Opin. Cell Biol. 15, 172-183.
Fischle, W., Tseng, B. S., Dormann, H. L., Ueberheide, B. M., Garcia, B. A., Shabanowitz, J., Hunt, D. F., Funabiki, H. and Allis, C. D. (2005). Regulation of HP1-chromatin binding by histone H3 methylation and phosphorylation. Nature 438, 1116-1122.
Fournel, M., Sapieha, P., Beaulieu, N., Besterman, J. M. and MacLeod, A. R. (1999). Down-regulation of human DNA-(cytosine-5) methyltransferase induces cell cycle regulators p16(ink4A) and p21(WAF/Cip1) by distinct mechanisms. J. Biol. Chem. 274, 24250-24256.
Gaudet, F., Hodgson, J. G., Eden, A., Jackson-Grusby, L., Dausman, J., Gray, J. W., Leonhardt, H. and Jaenisch, R. (2003). Induction of tumors in mice by genomic hypomethylation. Science 300, 489-492.
Giet, R. and Glover, D. M. (2001). Drosophila aurora B kinase is required for histone H3 phosphorylation and condensin recruitment during chromosome condensation and to organize the central spindle during cytokinesis. J. Cell Biol. 152, 669-682. Hall, I. M., Noma, K. and Grewal, S. I. (2003). RNA interference machinery regulates
chromosome dynamics during mitosis and meiosis in fission yeast. Proc. Natl. Acad.
Sci. USA 100, 193-198.
Harrington, E. A., Bebbington, D., Moore, J., Rasmussen, R. K., Ajose-Adeogun, A. O., Nakayama, T., Graham, J. A., Demur, C., Hercend, T., Diu-Hercend, A. et al. (2004). VX-680, a potent and selective small-molecule inhibitor of the Aurora kinases, suppresses tumor growth in vivo. Nat. Med. 10, 262-267.
Hendzel, M. J., Wei, Y., Mancini, M. A., Van Hooser, A., Ranalli, T., Brinkley, B. R., Bazett-Jones, D. P. and Allis, C. D. (1997). Mitosis-specific phosphorylation of histone H3 initiates primarily within pericentromeric heterochromatin during G2 and spreads in an ordered fashion coincident with mitotic chromosome condensation.
Chromosoma 106, 348-360.
Hirota, T., Lipp, J. J., Toh, B. H. and Peters, J. M. (2005). Histone H3 serine 10 phosphorylation by Aurora B causes HP1 dissociation from heterochromatin. Nature 438, 1176-1180.
Honda, R., Korner, R. and Nigg, E. A. (2003). Exploring the functional interactions between Aurora B, INCENP, and survivin in mitosis. Mol. Biol. Cell 14, 3325-3341. Hsu, J. Y., Sun, Z. W., Li, X., Reuben, M., Tatchell, K., Bishop, D. K., Grushcow, J.
M., Brame, C. J., Caldwell, J. A., Hunt, D. F. et al. (2000). Mitotic phosphorylation of histone H3 is governed by Ipl1/aurora kinase and Glc7/PP1 phosphatase in budding yeast and nematodes. Cell 102, 279-291.
Lachner, M., O’Carroll, D., Rea, S., Mechtler, K. and Jenuwein, T. (2001). Methylation of histone H3 lysine 9 creates a binding site for HP1 proteins. Nature 410, 116-120.
Laemmli, U. K. (1970). Cleavage of structural proteins during the assembly of the head of bacteriophage T4. Nature 227, 680-685.
Laird, P. W. and Jaenisch, R. (1996). The role of DNA methylation in cancer genetic and epigenetics. Annu. Rev. Genet. 30, 441-464.
Lavelle, D., DeSimone, J., Hankewych, M., Kousnetzova, T. and Chen, Y. H. (2003). Decitabine induces cell cycle arrest at the G1 phase via p21(WAF1) and the G2/M phase via the p38 MAP kinase pathway. Leuk. Res. 27, 999-1007.
Lee, C., Wevrick, R., Fisher, R. B., Ferguson-Smith, M. A. and Lin, C. C. (1997). Human centromeric DNAs. Hum. Genet. 100, 291-304.
Li, E. (2002). Chromatin modification and epigenetic reprogramming in mammalian development. Nat. Rev. Genet. 3, 662-673.
Maison, C., Bailly, D., Peters, A. H., Quivy, J. P., Roche, D., Taddei, A., Lachner, M., Jenuwein, T. and Almouzni, G. (2002). Higher-order structure in pericentric heterochromatin involves a distinct pattern of histone modification and an RNA component. Nat. Genet. 30, 329-334.
Melcher, M., Schmid, M., Aagaard, L., Selenko, P., Laible, G. and Jenuwein, T. (2000). Structure-function analysis of SUV39H1 reveals a dominant role in heterochromatin organization, chromosome segregation, and mitotic progression. Mol.
Cell. Biol. 20, 3728-3741.
Mellone, B. G., Ball, L., Suka, N., Grunstein, M. R., Partridge, J. F. and Allshire, R. C. (2003). Centromere silencing and function in fission yeast is governed by the amino terminus of histone H3. Curr. Biol. 13, 1748-1757.
Meraldi, P., Honda, R. and Nigg, E. A. (2004). Aurora kinases link chromosome segregation and cell division to cancer susceptibility. Curr. Opin. Genet. Dev. 14, 29-36.
Miller, O. J. and Therman, E. (2000). Human Chromosomes. New York: Springer. Ota, T., Suto, S., Katayama, H., Han, Z. B., Suzuki, F., Maeda, M., Tanino, M.,
Terada, Y. and Tatsuka, M. (2002). Increased mitotic phosphorylation of histone H3 attributable to AIM-1/Aurora-B overexpression contributes to chromosome number instability. Cancer Res. 62, 5168-5177.
Pines, J. and Hunter, T. (1991). Human cyclins A and B1 are differentially located in the cell and undergo cell cycle-dependent nuclear transport. J. Cell Biol. 115, 1-17.
Pines, J. and Hunter, T. (1992). Cyclins A and B1 in the human cell cycle. Ciba Found.
Symp. 170, 187-196; discussion 196-204.
Rea, S., Eisenhaber, F., O’Carroll, D., Strahl, B. D., Sun, Z. W., Schmid, M., Opravil, S., Mechtler, K., Ponting, C. P., Allis, C. D. et al. (2000). Regulation of chromatin structure by site-specific histone H3 methyltransferases. Nature 406, 593-599. Richards, E. J. and Elgin, S. C. (2002). Epigenetic codes for heterochromatin formation
and silencing: rounding up the usual suspects. Cell 108, 489-500.
Robbins, A. R., Jablonski, S. A., Yen, T. J., Yoda, K., Robey, R., Bates, S. E. and Sackett, D. L. (2005). Inhibitors of histone deacetylases alter kinetochore assembly by disrupting pericentromeric heterochromatin. Cell Cycle 4, 717-726.
Robert, M. F., Morin, S., Beaulieu, N., Gauthier, F., Chute, I. C., Barsalou, A. and MacLeod, A. R. (2003). DNMT1 is required to maintain CpG methylation and aberrant gene silencing in human cancer cells. Nat. Genet. 33, 61-65.
Rocchi, M., Baldini, A., Archidiacono, N., Lainwala, S., Miller, O. J. and Miller, D. A. (1990). Chromosome-specific subsets of human alphoid DNA identified by a chromosome 2-derived clone. Genomics 8, 705-709.
Rocchi, M., Archidiacono, N., Ward, D. C. and Baldini, A. (1991). A human chromosome 9-specific alphoid DNA repeat spatially resolvable from satellite 3 DNA by fluorescent in situ hybridization. Genomics 9, 517-523.
Scrittori, L., Skoufias, D. A., Hans, F., Gerson, V., Sassone-Corsi, P., Dimitrov, S. and Margolis, R. L. (2005). A small C-terminal sequence of Aurora B is responsible for localization and function. Mol. Biol. Cell 16, 292-305.
Shannon, K. B. and Salmon, E. D. (2002). Chromosome dynamics: new light on Aurora B kinase function. Curr. Biol. 12, R458-R460.
Shelby, R. D., Monier, K. and Sullivan, K. F. (2000). Chromatin assembly at kinetochores is uncoupled from DNA replication. J. Cell Biol. 151, 1113-1118. Solovei, I., Cavallo, A., Schermelleh, L., Jaunin, F., Scasselati, C., Cmarko, D.,
Cremer, C., Fakan, S. and Cremer, T. (2002). Spatial preservation of nuclear chromatin architecture during three-dimensional fluorescence in situ hybridization (3D-FISH). Exp. Cell Res. 276, 10-23.
Strahl, B. D. and Allis, C. D. (2000). The language of covalent histone modifications.
Nature 403, 41-45.
Sugiyama, T., Cam, H., Verdel, A., Moazed, D. and Grewal, S. I. (2005).
RNA-Jour
dependent RNA polymerase is an essential component of a self-enforcing loop coupling heterochromatin assembly to siRNA production. Proc. Natl. Acad. Sci. USA 102, 152-157.
Sullivan, K. F., Hechenberger, M. and Masri, K. (1994). Human CENP-A contains a histone H3 related histone fold domain that is required for targeting to the centromere.
J. Cell Biol. 127, 581-592.
Taddei, A., Maison, C., Roche, D. and Almouzni, G. (2001). Reversible disruption of pericentric heterochromatin and centromere function by inhibiting deacetylases. Nat.
Cell Biol. 3, 114-120.
Vagnarelli, P. and Earnshaw, W. C. (2004). Chromosomal passengers: the four-dimensional regulation of mitotic events. Chromosoma 113, 211-222.
Wade, P. A. (2001). Methyl CpG-binding proteins and transcriptional repression.
BioEssays 23, 1131-1137.
Wei, Y., Yu, L., Bowen, J., Gorovsky, M. A. and Allis, C. D. (1999). Phosphorylation of histone H3 is required for proper chromosome condensation and segregation. Cell 97, 99-109.
Wheatley, S. P., Henzing, A. J., Dodson, H., Khaled, W. and Earnshaw, W. C. (2004). Aurora-B phosphorylation in vitro identifies a residue of survivin that is essential for its localization and binding to inner centromere protein (INCENP) in vivo. J. Biol.
Chem. 279, 5655-5660.
Zeitlin, S. G., Monier, K. and Sullivan, K. F. (2001a). Phospho-histone antibody immunofluorescence for analysis of cell cycle progression in G2 and prophase.
Chemtracts Biochem. Mol. Biol. 14, 557-562.
Zeitlin, S. G., Shelby, R. D. and Sullivan, K. F. (2001b). CENP-A is phosphorylated by Aurora B kinase and plays an unexpected role in completion of cytokinesis. J. Cell
Biol. 155, 1147-1157.