HAL Id: tel-03123005
https://tel.archives-ouvertes.fr/tel-03123005
Submitted on 27 Jan 2021HAL is a multi-disciplinary open access archive for the deposit and dissemination of sci-entific research documents, whether they are pub-lished or not. The documents may come from teaching and research institutions in France or abroad, or from public or private research centers.
L’archive ouverte pluridisciplinaire HAL, est destinée au dépôt et à la diffusion de documents scientifiques de niveau recherche, publiés ou non, émanant des établissements d’enseignement et de recherche français ou étrangers, des laboratoires publics ou privés.
the Pourbaix diagram in noncomplexing medium and
characterization of astatine-mediated halogen bonds
Lu Liu
To cite this version:
Lu Liu. Exploration of astatine chemistry in solution : focus on the Pourbaix diagram in noncom-plexing medium and characterization of astatine-mediated halogen bonds. Radiochemistry. Ecole na-tionale supérieure Mines-Télécom Atlantique, 2020. English. �NNT : 2020IMTA0205�. �tel-03123005�
T
HESE DE DOCTORAT DE
L
’É
COLEN
ATIONALES
UPERIEUREM
INES-T
ELECOMA
TLANTIQUEB
RETAGNEP
AYS DE LAL
OIRE-
IMT
A
TLANTIQUE ECOLE DOCTORALE N°596Matière, Molécules, Matériaux
Spécialité : Chimie Analytique et Radiochimie
Exploration de la chimie de l'astate en solution : Focalisation sur le
diagramme de Pourbaix en milieu non complexant et caractérisation
de liaisons halogènes induites par l'astate
Thèse présentée et soutenue à Nantes, le 28 octobre 2020 Unité de recherche : SUBATECH, UMR 6457
Thèse N° : 2020IMTA0205
Par
Lu LIU
Rapporteurs avant soutenance :
Claire LE NAOUR Chargée de recherche, HDR, CNRS, IJCLab Jean AUPIAIS Directeur de recherche, CEA, DAM
Composition du Jury :
Président : Christophe DEN AUWER Professeur, Université de Nice, ICN
Rapporteurs : Claire LE NAOUR Chargée de recherche, HDR, CNRS, IJCLab Jean AUPIAIS Directeur de recherche, CEA, DAM
Examinateurs : Philippe MOISY Directeur de Recherche, CEA, Marcoule Bernd GRAMBOW Professeur, IMT Atlantique, SUBATECH Dir. de thèse : Gilles MONTAVON Directeur de recherche, CNRS, SUBATECH
Encadrants : Julie CHAMPION Maître de conférences, IMT Atlantique, SUBATECH Rémi MAURICE Chargé de recherche, CNRS, SUBATECH
I
Acknowledgements
My Ph.D. project was realized in the radiochemistry group at SUBATECH under the direction of Dr. Gilles Montavon, Dr. Julie Champion and Dr. Re mi Maurice. As arriving at the end of this Ph.D. project, I would like to express my gratitude to all those people who made this work possible and an unforgettable experience for me.
I owe my deepest gratitude to my supervisors, Gilles, Julie and Re mi. During this three-year period of my doctoral stage, they have all been very enthusiastic, reactive and complementary to each other concerning my research activities. I would like to thank them for the very nice and close daily guidance for designing, executing, analyzing and enhancing the research works. Their help delivered me a strong scientific background and prepared me for the forthcoming scientific journey.
My special words of thanks should also go to my colleagues in SUBATEH, especially to Sylvain Pardoue, Ve ronique Baty, Ce line Bailly, Guillaume Blain, Nicolas Bessaguet, Katy Perrigaud, Anne Piscitelli, Karine David and Vale rie Bosse , for their help on the use of experimental equipment and devices such as the HPLC, COT meter, glove boxes, etc. I also would like to thank Romain Berny, Ronald Jahke , Maxime Birot, for the radioprotection service.
I would like to acknowledge my coauthors of articles, Ning Guo, Cecilia Gomez Pech, Nicolas Galland, Seyfeddine Rahali, Je ro me Graton and Jean-Yves Le Questel, for their efforts and expertise on astatine, halogen bonds and quantum mechanical calculations, which lead to the publication of ours articles.
I wish to express my sincere gratitude to all the jury members of my defense, Dr. Claire Le Naour, Prof. Christophe Den Auwer, Prof. Philippe Moisy, Dr. Jean Aupiais and Prof. Bernd Grambow. I am very grateful that they took much time to review my thesis very carefully
II
and gave me many suggestions to improve my dissertation.
I would like to deliver my special thanks to my schoolmates in Subatech, Haohan, Fengqi, Yifeng, Yajing, Yuwei, Anne-Laure, Yahaya, Emeline, and my friends Ziling, Kan, Zijun, Zijie, Yajun. They helped me a lot to integrate into life in France and they make my life in this country more colorful.
Last but not least, I would like to thank my whole family, who have supported me in carrying a Ph.D. study abroad. And special thanks to my boyfriend, Liangzhao, who has always accompanied me, encouraged me and supported me during my Ph.D. studentship.
III
Contents
Acknowledgements ... I List of abbreviations and symbols ... VII List of figures ... XI List of tables... XIX
Introduction ... 1
Chapter 1. Literature survey ... 5
1.1 Generality of astatine ... 5
1.1.1 Discovery of astatine ... 5
1.1.2General properties of the astatine atom ... 6
1.1.3Two representative isotopes: 210At and 211At ... 7
1.2 Medicinal perspective for 211At ... 8
1.2.1Nuclear medicine... 9
1.2.1.1 Nuclear medical imaging ... 10
1.2.1.2 Targeted radiation therapy... 11
1.2.2 Radiolabeling ... 12
1.2.3Application of 211At in targeted alpha-particle therapy ... 14
1.2.3.1 Characteristics of the 211At radionuclide ... 14
1.2.3.2 Radiolabeling with 211At ... 14
1.2.3.3 In vivo stability of 211At-labeled complexes ... 17
1.3 The chemistry of astatine in solution ... 17
1.3.1Production of 211At ... 18
1.3.2Speciation studies ... 20
IV
1.3.2.2 Quantum chemistry methods ... 22
1.3.3 Speciation of astatine in aqueous solutions in the absence of a complexing agent... 23
1.3.5Complexation between astatine cations and inorganic ligands ... 34
1.3.6Complexation between astatine cations and organic ligands ... 38
1.3.7Halogen bonding with Lewis bases ... 40
1.4 Scientific motivations ... 41
Chapter 2. Methodologies and materials ... 43
2.1 Experimental methodologies ... 44
2.1.1Electromobility ... 44
2.1.2HPIEC ... 48
2.1.3Liquid/liquid competition ... 50
2.2 Analytical tools ... 52
2.2.1Liquid scintillation counter ... 52
2.2.2COT measurements ... 53
2.2.3pH/E measurements ... 53
2.3 Simulations ... 53
2.3.1Analytical expressions ... 54
2.3.1Numerical codes ... 55
2.3.3Quantum mechanical calculations ... 55
2.4 Materials ... 56
2.4.1Chemicals ... 56
2.4.2Radioactive sources ... 57
2.5 Summary ... 58
Chapter 3. Pourbaix diagram of astatine: Focus on alkaline conditions ... 61
3.1 Introduction ... 61
3.2 Objective... 64
3.3 Experimental details ... 66
V
3.3.2HPIEC experiments ... 67
3.3.3Electromobility measurements ... 69
3.3.4Liquid/liquid competition experiments ... 70
3.4 Results and discussions ... 72
3.4.1 Potential interactions between the medium chemicals and astatine species ... 72
3.4.2Identification of species occurring in alkaline conditions ... 74
3.4.2.1 HPIEC ... 74
3.4.2.2 Electromobility ... 77
3.3.3Characterization of the At–/Atox speciation change ... 81
3.4.3Pourbaix diagram of astatine ... 87
3.5 Conclusion ... 90
Chapter 4. Advances on the At-mediated halogen bonds: Completeness of the AtI basicity scale ... 93
4.1 Introduction ... 93
4.2 Experimental details ... 96
4.2.1Liquid/liquid competition experiments ... 96
4.2.2TOC meter measurements ... 98
4.3 Results ... 98
4.3.1Conditions for evidencing complexation and formation constants ... 99
4.3.2Formation of one to one complex (BAtI) ...100
4.3.3Exceptional case of Bu3PO: formation of two complexes ...106
4.3.4Summary of equilibrium constants ...109
4.4 Discussion...110
4.4.1Confrontation with theoretical calculations ...110
4.4.2pKBAtI basicity scale ...114
4.5 Conclusions ...116
Conclusions and perspectives ... 117
VI
Perspectives ...118
Appendix A. Supplementary data ... 121
Appendix B. Résumé de la thèse en français ... 125
VII
List of abbreviations and symbols
Atox Astatine species presenting in alkaline and non-reductive conditions
Atred
Astatine species presenting in alkaline and reducing conditions
BFC Bifunctional Chelating agent
(BuO)3PO Tributyl phosphate
Bu2SO Dibutyl sulfoxide
Bu3PO Tributylphosphine oxide
CAS Chemical Abstracts Service
CFRP Chromatography at Fixed Redox Potential
cHex Cyclohexane
cHexanone Cyclohexanone
DAt Distribution coefficient of astatine
DFT Density Functional Theory
DIPE Diisopropyl ether
DMAc Dimethylacetamide
DMAM Dimethylcyanamide
DTPA Diethylenetriaminepentaacetic acid
DTT DL-dithiothreitol
E Potential
EAS Electrophilic Aromatic Substitution
EC Electron Capture
EDTA Ethylenediaminetetraacetic acid
Et2O Diethyl ether
VIII
Hept Heptane
HPGe High-Purity Germanium
HPIEC High-Performance Ion Exchange Chromatography
HSAB Hard and Soft Acids and Bases
I Ionic strength
IC Inorganic Carbon
LET Linear Energy Transfer
LLC Liquid/Liquid Competition
LLNL Lawrence Livermore National Laboratory
M mol·L–1
Me(EtO)2PO Diethyl methylphosphonate
Me2Se Dimethyl selenide
Me6Ph Hexamethyl benzene
MePh Toluene
NAS Nucleophilic Aromatic Substitution
NHE Normal Hydrogen Electrode
NTA Nitrilotriacetic acid
OS Oxidation State
PBS Phosphate-Buffered Saline
PET Positron Emission Tomography
Ph3PS Triphenylphosphine sulfide
PIPPS Piperazine-1,4-bis(propanesulfonic acid) pKBI2 Diiodine basicity scale
PrCOOEt Ethyl butyrate
RP Radiopolarography
SAB Succinimidyl astatobenzoate
IX
SPECT Single Photon Emission Computed Tomography
TAT Targeted Alpha-particle Therapy
TC Total Carbon ThioAcetamide Thioacetamide ThioCamph Thiocamphor TLC Thin-Layer Chromatography TMeThioUrea Tetramethylthiourea TMeUrea Tetramethylurea
TOC Total Organic Carbon
tSIE Transformed Spectral Index of External Standard
UV Ultraviolet
XI
List of figures
Figure 1.1 Simplified scheme illustrating the decay of 210At with data from IAEA Nuclear
Data Section. ... 7
Figure 1.2 Simplified scheme illustrating the decay of 211At with data from IAEA Nuclear Data Section. ... 8
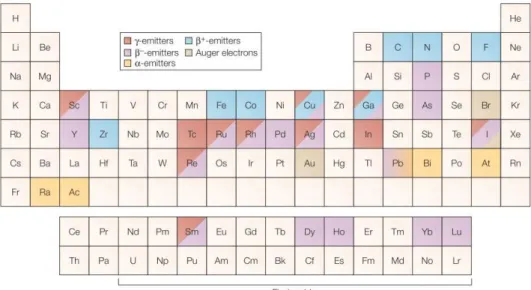
Figure 1.3 A representation of the periodic table, highlighting the elements of interest in nuclear medicine. The color defines the emission type.[26] ... 10
Figure 1.4 A PET scanner used to take images of a specific area of a patient. ... 11
Figure 1.5 Schemes of radiolabeling through a) direct radiolabeling, b) indirect radiolabeling. ... 13
Figure 1.6 Examples of 211At-targeting agents and 211At-BFCs: a) MABG, b) 211At-labeled
methylene blue and c) SAB. ... 15
Figure 1.7 Examples of astatinated and functionalized boron clusters: a) a nido-carborane derivative, b) a bis-nido-nido-carborane derivative and c) a closo-decaborate derivative. Filled circles represent C atoms while empty ones represent B atoms. ... 16
Figure 1.8 Examples of stable complexes with 211At– attached to a) Rh (III), and b) Ir (III)
soft metal cations. ... 17
Figure 1.9 Fit of the cross-sections for 209Bi(α, 2n)211At and 209Bi(α, 3n)210At
reactions.[51] ... 19
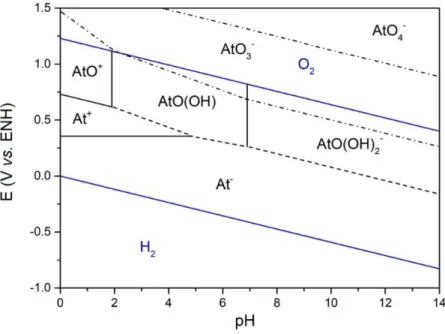
Figure 1.10 Pourbaix diagram of astatine (25°C). The blue solid lines refer to the stability zone of water; the black solid lines correspond to directly determined boundaries with data reported by Champion et al.[10–12]; the dashed lines indicate the boundaries
XII
deduced from known equilibria; the dashed dot lines relate to undetermined or uncertain boundaries. ... 33
Figure 1.11 Schematic representation of an R−X⋯B halogen bond.[106] ... 40 Figure 2.1 Schematic representation of the methodologies for studying the chemistry of
astatine in the framework of this work. ... 44
Figure 2.2 Diagram of the electromobility device. a. migration tube; b. electrolyte cells; c. hydrodynamic resistor; d. Pt-electrode; e. glass cylinder; f. γ-ray detector; 01. outlet for the injection of solution containing radioactive sample; 02. outlets used to insert the voltage-measuring electrodes; 03. outlets used to measure the temperature of the medium inside the migration tube with a thermometer probe; 04. outlet for filling the migration tube with the electrolyte; 05 and 06. outlets used to refresh the electrolyte in the cells; 07. outlets for the junction of the cells; ①, ②, ③, ④. outlets for the water bath.[9] ... 45
Figure 2.3 Activity of 123I as a function of the position along the migration tube: 123I ∼
500 kBq (10 μL), I = 0.1 M (0.1 M NaCl, 0.1 mM NaOH, 0.1 mM DTT), V = 7.9 ± 0.1 V·cm–1, T = 25 ± 1°C. a) Activity distribution at different times; b) Peak fitting of the
activity distribution. ... 47
Figure 2.4 Schematic representation of an HPIEC unit. ① Solvent reservoirs, ② solvent degasser, ③ gradient valve, ④ mixing vessel for delivery of the mobile phase, ⑤ high-pressure pump, ⑥ switching valve in “inject position”, ⑦ sample injection loop, ⑧ pre-column, ⑨ analytical column, ⑩ UV detector, ⑪ γ-ray detector, ⑫ waste collector, ⑬ data acquisition. ... 50
Figure 3.1 Pourbaix diagram of astatine (25°C). The blue solid lines indicate the stability zone of water; the black solid lines correspond to directly determined boundaries with data reported by Champion et al.[10–12]; the dashed lines indicate the
XIII
undetermined or uncertain boundaries. ... 63
Figure 3.2 Schematic representation of the strategy for completing the Pourbaix diagram of astatine in alkaline conditions. Squares correspond to the experimental conditions for HPIEC measurements; stars indicate the conditions for electromobility measurements; arrows refer to the conditions for liquid/liquid competition experiments. ... 65
Figure 3.3 Molecular structure of PIPPS and DTT. ... 66
Figure 3.4 HPIEC UV-chromatograms and radio-chromatogram obtained without the separation column for a NaI-123 and a NaI-127 sample (in 0.1 M NaClO4/10–4 M
NaOH solution) with 350 μL·min–1 eluent containing 0.1 M NaClO4/10–4 M NaOH.
... 68
Figure 3.5 HPIEC radio-chromatograms obtained with 350 μL·min–1 eluent containing
0.1 M NaCl, 10–3 M PBS, and 10–3/10–4 M S2O32–/ SO32– on two samples: (a) At in 0.1
M NaCl, 10–3 M PBS, and 10–3/10–4 M S2O32–/ SO32–; (b) At in 0.1 M NaCl, 10–3 M PBS,
and 10–3 M DTT. ... 73
Figure 3.6 Distribution coefficient of astatine in biphasic aqueous/DIPE system with the presence of Na2S2O8 (square) or Na2SO4 (circle) in the aqueous phase in acidic
conditions. ... 74
Figure 3.7 HPIEC radio-chromatogram of an Atred sample. Measurement of 350 μL·min– 1 eluent containing 0.1 M NaCl/10–4 M M NaOH/10–4 M DTT on an At sample in 10– 4 M M NaOH/10–4 M DTT. ... 75
Figure 3.8 HPAEC results for Atred (squares), I– (circles), and Br– (diamond) and S2O32–
(triangles) under alkaline and reducing conditions: plot of the retention factor k as a function of NaCl molarity in the NaCl/10–4M NaOH/10–4M DTT eluent. The flow
rate was fixed at 350 mL·min–1. ... 75
XIV
eluent containing 0.05 M NaClO4/10–4 M M NaOH on an At samples in 10–4 M NaOH.
... 76
Figure 3.10 HPAEC results for Atox (squares), I– (circles), and Br– (diamond) and S2O32–
(triangles) under alkaline and oxidizing conditions: plot of the retention factor k as a function of NaClO4 molarity in the NaClO4/10–4 M NaOH eluent. The flow rate was
fixed at 350 mL·min–1. ... 77
Figure 3.11 Pourbaix diagram of iodine (25°C).[121] The stars indicate the applied
experimental conditions for the electromobility measurements. ... 78
Figure 3.12 Activity of 123I and 211At as a function of the position along the migration
tube at different times. The electrolytes and samples were prepared with (a) a 10– 4 M NaOH/10–4 M DDT/0.1 M NaCl solution, (b) a 10–4 M NaOH/0.1 M NaClO4
solution... 79
Figure 3.13 Example of data analysis: position as a function of time for 123I (square) and 211At (circle). The electrolytes and samples were prepared with (a) 10–4 M
NaOH/10–4 M DDT/0.1 M NaCl solution, (b) 10–4 M NaOH/0.1 M NaClO4 solution.
The lines are the fitting results using Equation (2.2). ... 79
Figure 3.14 Distribution coefficient of At in biphasic aqueous/DIPE system at fixed pH (8.37) as a function of potential of the aqueous phase. ... 81
Figure 3.15 Distribution coefficient of At in the biphasic aqueous/DIPE system at fixed pH (8.37) as a function of potential of the aqueous phase. Lines correspond to the fitting with the model considering the formation of AtOx(OH)(n-2x)- by capture of
n electrons from At–. ... 84
Figure 3.16 Distribution coefficient of At in the biphasic aqueous/DIPE systems at fixed pH as a function of potential of the aqueous phase. Lines correspond to the fitting with the model considering the formation of AtO(OH)2– rom At– by exchange of 4
XV
Figure 3.17 Relationship between apparent potential and pH for the reaction between At– and AtO(OH)2–. The solid line corresponds to linear fitting. ... 87
Figure 3.18 Pourbaix diagram of astatine (25°C) constructed by considering EAt+/At-0 =
0.37 V, EAtO(OH)2-/At-0 = 0.86 V, log KAtO+,hyd,1 = –1.9 and log KAtO+,hyd,2 = –6.9. The points in the diagram are experimental results in the literature and in this work. The color of symbols is in agreement with the considered boundary. ... 89
Figure 4.1 Schematic representation of an R−X⋯B halogen bond.[106]... 93 Figure 4.2 Molecular structure of selected Lewis bases. The name given is the
parentheses is the abbreviation used in this chapter. ... 96
Figure 4.3 Speciation diagram of astatine in 0.1 M HClO4 aqueous solution as a function
of the I– concentration, based on published equilibrium constants for the
formation of AtI and AtI2− species.[14,16] ... 97
Figure 4.4 Distribution coefficient of At in biphasic aqueous/cHex system in the presence of DMAM. ... 99
Figure 4.5 Distribution coefficient of At in biphasic aqueous/Hept system in the presence of TMeUrea. The hollow symbols indicate data without ligand (initial distribution). The solid lines correspond to the fitting with the Model 1 that considering the formation of the 1:1 complex between AtI and ligand in the organic phase. ...100
Figure 4.6 Distribution coefficient of At in biphasic aqueous/cHex system in the presence of cHexanone, and in biphasic aqueous/Hept system in the presence of ThioCamph. The hollow symbols indicate data without ligand (initial distribution). The solid lines correspond to the fitting with the model 1 that considering the formation of the 1:1 complex between AtI and ligand in the organic phase. ...102
XVI
Figure 4.7 Distribution coefficient of At in biphasic aqueous/cHex system in the presence of DMAc. The hollow symbols indicate data without ligand (initial distribution). Dashed lines correspond to the simulation of DAt by considering the
formation of the 1:1 complex between AtI and ligand in the organic phase with a formation constant being 100.7. ...102
Figure 4.8 Distribution coefficient of At in biphasic aqueous/Hept system in the presence of TMeThioUrea. The hollow symbols indicate data without ligand (initial distribution). The dashed lines correspond to the fitting with the Model 1 that considering the formation of the 1:1 complex between AtI and ligand in the organic phase. The solid lines correspond to the fitting with Model 2 that considering additionally the distribution of the 1:1 complex in two phases. ...103
Figure 4.9 Distribution coefficient of At in biphasic aqueous/Hept system in the presence of ThioAcetamide, and in biphasic aqueous/cHex system in the presence of Me2Se. The hollow symbols indicate data without ligand (initial distribution).
The solid lines correspond to the fitting with Model 2 that considering the formation of 1:1 complex between AtI and ligand in the organic phase plus the distribution of the 1:1 complex in two phases. ...104
Figure 4.10 Distribution coefficient of At in biphasic aqueous/cHex system in the presence of Bu3PO for [I–] = 0.01, 0.1 and 0.2 M. The hollow symbols indicate data
without Bu3PO (initial distribution). Data fitted with a, b, c) Model 1, considering
the formation of the 1:1 Bu3PO···AtI adduct in the organic phase, d, e, f) Model 3,
also allowing the formation of the 2:1 2Bu3PO···AtI adduct, g, h, i) Model 4,
considering in addition the partial solubility of the 2:1 adduct in the aqueous phase. ...106
Figure 4.11 Distribution coefficient of At in biphasic aqueous/cHex system in the presence of Bu3PO for [I–] = 0.05 and 0.07 M. The hollow symbols indicate data
XVII
formation of the 1:1 Bu3PO···AtI and 2:1 2Bu3PO···AtI adduct in the organic phase,
plus the partial solubility of the 2:1 adduct in the aqueous phase. ...107
Figure 4.12 Speciation diagrams of At in the presence of I– at a fixed concentration, as a
function of the initial concentrations of Bu3PO, obtained by considering the
experimentally determined KBAtI and KB2AtI values. Species in the organic and
aqueous phases are not distinguished. Purple solid lines correspond to AtI, blue dot lines correspond to AtI2–, red dash dot lines correspond to Bu3PO⋯AtI (noted
BAtI) and black dash lines correspond to 2Bu3PO⋯AtI (noted B2AtI). The other
astatine species (< 0.1%) are not presented. ...108
Figure 4.13 Structure of the most stable 1:1 complex between AtI and Bu3PO calculated
at the B3LYP/AVDZ level of theory...111
Figure 4.14 Relationship between the experimentally deduced pKBAtI scale and
theoretically deduced pKBAtI scale for the same Lewis bases. Error bars represent
two standard deviations of uncertainty. ...112
Figure 4.15 Structure of the most stable 1:2 complex between AtI and Bu3PO calculated
at the B3LYP/SVPD level of theory. ...113
Figure 4.16 Astatine monoiodide basicity chart for functional groups. The C, O, S and Se bases are grouped on different vertical axes. ...114
Figure 4.17 Relationship between pKBAtI scale and pKBI2 scale for the same Lewis bases.
Error bars represent two standard deviation of uncertainty. The numbers in parenthesis in the analytical expression correspond to one standard deviation. ...115
Figure A.1 Diagramme de Pourbaix de l’astate (25°C) construit en considerant
EAt+/At−0 = 0,37 V, EAtO(OH)2−/At−0 = 0,86 V, log 𝐾AtO+,hyd,1 = − 1,9 and log
𝐾AtO+,hyd,2= − 6,9. Les points du diagramme sont des re sultats expe rimentaux
XVIII
frontie res des espe ces conside re e. ...130
Figure A.2 L’e chelle de basicite pKBAtI pour les bases de Lewis. Les bases de C, O, S et Se
XIX
List of tables
Table 1.1 Characteristics of different radiation types. ... 9
Table 1.2 Potential candidates of α-emitting radionuclides for the application in nuclear medicine. ... 12
Table 1.3 Chromatography measurements for At species in acidic solution oxidized by Cr2O72–. ... 27
Table 1.4 Electromobility investigations of At species in different media. ... 30
Table 1.5 Redox potential of At species in the literature. Data obtained through different methods: electromigration (Elc), the liquid/liquid competition (LLC) method, solid/liquid competition method (SLC), radiopolarography (RP) and chromatography at fixed redox potential (CFRP). ... 32
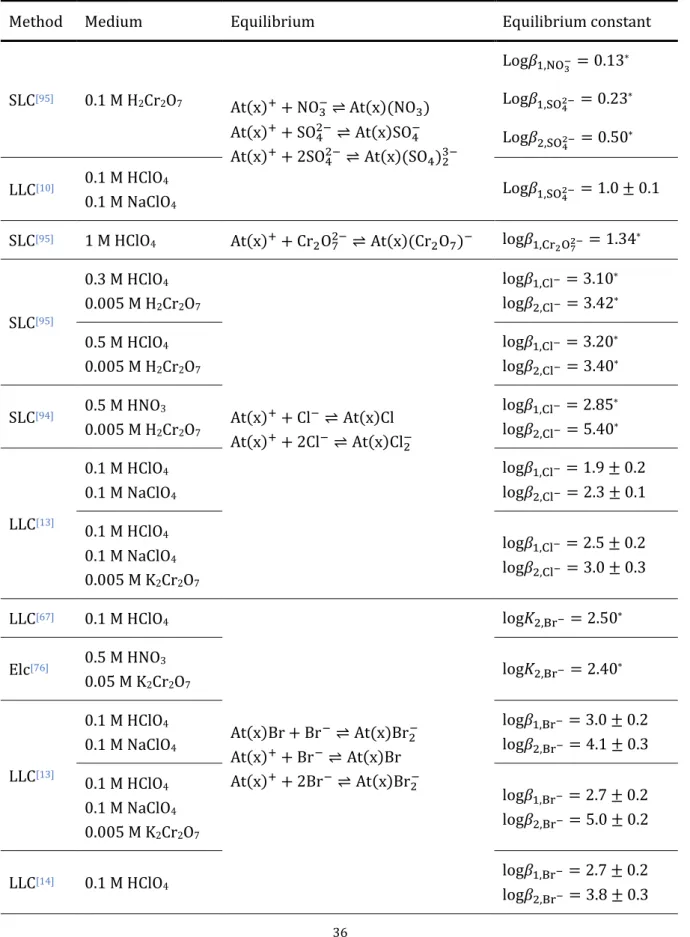
Table 1.6 Overview of the reactions between At cationic species and inorganic ligands through different methods: electromigration (Elc), the liquid/liquid competition (LLC) method or solid/liquid competition method (SLC)... 36
Table 1.7 Formation constant between At(x)+ species and organic compounds ... 39
Table 1.8 Equilibrium constants of AtI with different Lewis bases[16] ... 41
Table 2.1 Comparison of electromigration measurements (Elc), HPIEC measurements, and liquid/liquid competition experiments (LLC)……….…….59
Table 3.1 Apparent mobility of At and I species in oxidizing or reducing conditions in alkaline solutions*………..80
Table 3.2 Redox potential related to the speciation change between At– and AtO(OH)2– in
XX
Table 4.1 Distribution coefficient of Lewis bases in the alkane/aqueous system and equilibrium constants between AtI and Lewis bases in an alkane solvent…………..109
Table A.1 List of equilibria and their associated thermodynamic constants added in the JCHESS database for modeling astatine behaviors………..121
Table A.2 Adjustable parameters obtained from the fitting of the distribution coefficient measurements with different models presented in chapter 4 for all experimental data related to the halogen bonding between AtI and Lewis bases. ...122
Table A.3 Adjustable parameters obtained from the fitting of the distribution coefficient measurements with Model 3 presented in chapter 4 for all experimental data related to the halogen bonding between AtI and Bu3PO. ...123
1
Introduction
In 1869, when Dmitri Mendeleev published his periodic table, the space under iodine, i.e. the element 85, was empty. In 1940, Dale R. Corson, Kenneth R. MacKenzie, and Emilio G. Segre synthesized for the first time the element 85 by bombarding bismuth-209 with accelerated alpha particles in a cyclotron at University of California, Berkeley (USA).[1]
This element was named “astatine” (with chemical symbol “At”) afterward, from the Greek astatos (α στατος), meaning “unstable”.[2,3] As reflected by its name, astatine is a
radioelement. Since its discovery, 39 isotopes have been experimentally identified, all of them being radioactive and actually short-lived (t1/2 ≤ 8.1 h).[4] Astatine is one of the rarest
naturally occurring element in the Earth’s crust. The total amount is estimated at less than 30 grams at any given time.[5] Thus, it is difficult to collect it, and the major route for
obtaining astatine is through production via nuclear reactions, in fact in minute quantities. All the chemical studies on astatine are conducted at ultra-trace concentrations (typically between 10–10 and 10–15 mol·L–1), which makes the classic spectroscopic tools
inapplicable to scrutinize astatine chemistry at the molecular level. Even 80 years after the discovery of astatine, its chemistry remains poorly known.
Among its isotopes, astatine-211 (211At) has attracted some particular attention owing to
its potential application in nuclear medicine. Indeed, 211At has a half-life of 7.2 hours. It
decays through a double-branched pathway producing overall one α particle per decay.[6]
The average energy of the emitted α-particles is 6.8 MeV, and the mean linear energy transfer (LET) in tissues is 97 keV·μm–1,[7] thus being powerful enough for destroying the
diseased cells. These favorable properties make 211At a promising candidate for targeted
alpha-particle therapy (TAT). It is based on the injection of radioactive isotopes undergoing alpha decay into the patient to treat diseased tissue at close proximity. A prerequisite for the application is to label 211At in a stable manner to a carrier-targeting
2
agent, which requires knowledge on astatine chemistry, in particular on its speciation and reactivity in solution.
The high-energy ARRONAX cyclotron in Nantes is capable of producing 211At, which has
led several teams, notably radio-, theoretical, and synthetic chemists, to gather for investigating its chemistry and radiolabeling. The project developed at the Subatech laboratory (UMR 6457), in collaboration with the CEISAM laboratory (UMR 6230), aims at exploring the chemistry of astatine in solution by combining experimental and computational approaches. Subatech has initiated this research more than fifteen years ago. The efforts made by Julie Champion and Ning Guo, the first Ph.D. students on this project at Subatech, led to important advances in the speciation of astatine in aqueous solution and in the reactivity of basic astatine species. More precisely, they have identified three oxidation states (OS) in the aqueous medium (–1, +1 and +3) as At–, At+, AtO+,[8–10]
and also hydrolysis products of AtO+,[11,12] which are key information to construct the
Pourbaix diagram of astatine. They have also investigated the reactivity of the cationic species of astatine with some inorganic ligands (Cl–,[13] Br–,[13,14] I–,[14] and SCN–[15]) and
also to some organic ones,[15,16] which led to the study on the halogen bonds involving
astatine. The present Ph.D. project has two main objectives. The first one is to complete the lacking information of the Pourbaix diagram of astatine in alkaline conditions by actually characterizing the speciation change between AtO(OH)2– and At–. The second
objective is to study the capacity of astatine, in particular inside the AtI unit, to form halogen bonds with different Lewis bases.
This dissertation is organized in four main chapters, briefly introduced in the following paragraphs.
The first chapter presents a literature survey on the general property of astatine, the application of 211At in nuclear medicine, and the chemistry of astatine in solution.
The primary constraint for studying astatine, regarding its low availability, is to work at ultra-trace scales (10–10 – 10–15 mol·L–1). The nature of the species proposed in the
3
literature is thus deduced from indirect methods based on radiochemistry techniques, such as electromobility, chromatography, or competition methods. The general methodology applied in the framework of this thesis will be presented in the second chapter.
Knowledge on the Pourbaix diagram is essential for chemists. Information is lacking in alkaline conditions because the passage between the two supposed species, At– and
AtO(OH)2–, has not been directly characterized. This aspect will be exposed in the third
chapter.
As a member of the halogen family of elements, halogen-bonded adducts between astatine and Lewis bases have been recently evidenced. The fourth chapter focus on completing the work on At-mediated halogen bonds by extending the preliminary basicity scale with a larger set of Lewis bases and halogen-bond strengths.
5
Chapter 1. Literature survey
The objective of this chapter is to illustrate the importance of knowing chemical properties of astatine compounds, especially for nuclear medicine applications. Firstly, a brief summary of astatine features will be presented, from its discovery to its general physical properties. Then, the keen interest of astatine in nuclear medicine will be discussed and, in this context, several recent developments on labeling strategies will be highlighted. Although some approaches appear efficient for starting clinical trials, problems are yet to be resolved, emphasizing the urgent need to better understand the basic chemistry of this element. The objectives of the thesis topic will be finally presented in the light of current knowledge of the chemistry of astatine.
1.1 Generality of astatine
Astatine is a radioactive chemical element with the symbol At and atomic number 85. In the periodic table, it belongs to the halogen group, below iodine. This part will focus on the generality of this element, including the history of discovery and the general physical properties, in order to gain overall information of this element.
1.1.1 Discovery of astatine
When Dmitri Mendeleev published his periodic table in 1869, the space underneath iodine, i.e., the element 85, was empty. It was called “eka-iodine” because of its position. Scientists tried to look for it in nature, while considering its extreme rarity, these attempts resulted in several refuted discoveries.
The first widely popularized claim was reported by American physicist Fred Allison in 1931 at the Alabama Polytechnic Institute. He developed a new method called the magneto-optic method. He examined some typical halogen-containing matrices such as
6
seawater and monazite sand. He claimed to find the element 85 and named it “alabamine”.[17]However, his method and the validity of his discovery were disproved by
MacPherson in 1934.[18]
Inspired by the work of Allison, Indian chemist Rajendralal De tried to search for eka-iodine in monazite sand by chemical separation. He detected a black substance and named it “dakin” in 1937.[19] Nevertheless, the description of dakin is inconsistent with the
chemical properties of astatine identified afterward.
In 1936, Romanian physicist Horia Hulubei and French physicist Yvette Cauchois claimed to have discovered the element 85 through X-ray analysis of radon samples and named it “dor” later. Even though Hulubei and Cauchois’s samples did contain astatine, their means to detect it were too weak to be accepted as a firm identification.[19]
In 1940, Swiss chemist Walter Minder announced the discovery of the element 85 as the beta decay product of radium A (polonium-218) by α-particle detection of radon samples, choosing the name “helvetium”.[20] In 1942, Minder, in collaboration with the English
scientist Alice Leigh-Smith, announced the detection of another isotope of the element 85, presumed to be the product of thorium A (polonium-216) beta decay. They named this substance “anglo-helvetium”.[21] These discoveries were disproved by Karlik and Bernert
because they were unable to reproduce the experiments.[19]
The first reliable report of the discovery and identification of eka-iodine appeared in 1940 by D. R. Corson, K. R. MacKenzie, and E. Segre . Instead of searching in nature, the scientists synthesized the element 85 by bombarding bismuth-209 with alpha particles in a cyclotron of University of California in the USA.[1] They suggest the name “astatine”, from
the Greek astatos (α στατος), meaning “unstable”.[2,3] This work is still considered as the
true discovery of astatine, thus credited to Corson, MacKenzie and Segre .
1.1.2 General properties of the astatine atom
7
Astatine is the Block p, Group 17, Period 6 element. Its ground-state atomic electron configuration is [Xe]4f145d106s26p5. Its Van der Waals radius is 202 pm.[22] In its elemental
form, astatine’s Chemical Abstracts Service (CAS) number is 7440-68-8.
2) Isotopes
There are 39 known isotopes of astatine, with atomic masses (mass numbers) of 191–229. Theoretical modeling suggests that 37 more isotopes could exist.[4] Neither stable or
long-lived astatine isotope has been observed, nor is one expected to exist.[23]
3) Natural occurrence
Four of astatine’s isotopes can be found in nature as a result of the decay of radioactive thorium and uranium ores, and trace quantities of 237Np. 215At and 219At exist in the decay
chain of 235U. 218At can be found in the decay chain of 238U. 217At is produced through the
decay of 237Np. However, the total amount of astatine in the Earth’s crust is estimated to
be at most 30 grams at any given time.[5,24] Astatine is considered as the rarest naturally
occurring element.
1.1.3 Two representative isotopes:
210At and
211At
1) 210At
8
210At is the most stable isotope of astatine with a half-life time of 8.1 hours. As shown in Figure 1.1, 210At decays via two branches. The primary decay mode (98.83%) is by
electron capture (EC) with positron emission to 210Po. The latter possesses a half-life of
138.4 days and decays to stable 206Pb by the emission of 5.41 MeV α-particles. The other
route (0.17%) is by direct emission of 5.63 MeV α-particles to 206Bi, and then decays to
stable 206Pb by EC with positron emission. One should note that among the decay products
of 210At, 210Po is extremely toxic to humans (it has been used as a poison[25]).
2) 211At
Figure 1.2 Simplified scheme illustrating the decay of 211At with data from IAEA Nuclear Data Section. 211At is the second long-lived isotope of astatine. It has a half-life of 7.2 hours and decays
through a double-branched pathway (see Figure 1.2) producing one α particle per decay. The first route (58.2%) is by EC to 211Po with a half-life of 0.52 seconds, which is
immediately excited by the emission of 7.45 MeV α-particles to stable 207Bi. The second
route (41.8%) is by direct emission of 5.87 MeV α-particles to 207Bi, which has a long
half-life of 31.5 years, and then decays to stable 207Pb by EC with positron emission.
1.2 Medicinal perspective for
211At
The 211At radionuclide is considered as a promising candidate as a radiation source in TAT.
9
be firstly given, with a focus on its two branches — the imaging (diagnostic) and the targeted radiation therapy. Then, the characteristics that make 211At a good candidate for
TAT as well as the trials to label targeting agents with 211At will be presented. Finally, the
actual difficulties related to the application of 211At will be discussed.
1.2.1 Nuclear medicine
The principle of nuclear medicine is to make use of radioactivity for diagnosis and/or therapy. In “molecular” nuclear medicine (by opposition to direct beam irradiation), radioactive isotopes are conditioned so as to target specific organs to diagnose or treat disease.
Several types of radioactive emissions are distinguished, leading to general features for their interactions with the human body depending on the radiation type. Table 1.1
summarizes the characteristics of different types of radioactive missions.
Table 1.1 Characteristics of different radiation types.
Radiation type Identity Energy
transfer Penetrating power
α-particle Helium nucleus Very high Very short, will not penetrate skin
β–-particle Electron Intermediate Short, will slightly
penetrate skin and tissues
β+-particle Positron, generating γ-rays
after annihilation with electron Very low
Deep, will deeply penetrate tissues
γ-ray Electromagnetic radiation Very low Deep, will deeply penetrate tissues
Auger (e–) Electron Very low Minimal
Based on these properties, two main axes of nuclear medicine were distinguished: imaging and therapy. Imaging is possible for isotopes whose decay leads to direct or indirect emission of gamma radiation. Indeed, it is the most energetic radiation in the
10
photonic spectrum and therefore has a high-penetrating power which allows them to “leave” the body and thus be detected for imaging purposes. For therapy, the concept is different: the energy resulting from radioactive decays must be localized at the level of the area to be treated. In this case, “particulate” radiations are preferred, in particular α-particle emission in the context of astatine.
Figure 1.3 shows the elements with potential interests for nuclear medicine in the periodic table.
Figure 1.3 A representation of the periodic table, highlighting the elements of interest in nuclear medicine. The color defines the emission type.[26]
1.2.1.1 Nuclear medical imaging
Nuclear medical imaging techniques are based on the use of a radioactive tracer, which emits radiations detectable by a radiosensitive device. In general, the biological vectors of radioisotopes are chosen to ensure the preferential fixation on a particular type of cell according to the established diagnosis. Once the organ or the tissue is targeted, the radiation directly emitted by the radionuclide or resulting from a subsequent decay event is captured by an external detector and formed pictures of the target. The images obtained allow notably to diagnose the state of health of the patient. To this end, the radiation emitted by the radiotracer should have a high penetration ability to pass through the body
11
to reach the detector, usually being γ-rays. Therefore, the radiotracers applied are either those directly emitting γ-rays, such as 99mTc, 123I, 131I, 111In, or those emitting β+-particles
and generate γ-rays after annihilation with the electrons, like 18F, 11C, 82Rb, 13N, 15O and 68Ga, and 89Zr. Actually, based on this principle, two major nuclear medical imaging
techniques, Single Photon Emission Computed Tomography (SPECT) and Positron Emission Tomography (PET) have been developed as standard nuclear medicine services.
Figure 1.4 A PET scanner used to take images of a specific area of a patient. 1.2.1.2 Targeted radiation therapy
Considering that most tumors can be diagnosed by the imaging methods mentioned above, it is important to develop an effective approach to treat these diseases. The targeted radiation therapy, delivering a high dose of radiation into the patient to treat tumors at close proximity, presents great interests. The essential of this approach is to eliminate cancerous cells efficiently while reducing the damage to the surrounding healthy cells. Though some radionuclides present intrinsic properties for the targeting, such as I– for
the thyroid or Ra2+ for the bones, in the most of cases, the targeting is carried out via a
biological vector (antibody, antibody fragment, peptide, sugar, etc.). In this framework, antibody fragments are potential candidates of radioisotope carriers to tumors since they are known to be used by the immune system to target and inhibit specific antigens located either at the tumor surface or inside it. Therefore, the selection of the radionuclide becomes an important issue that should meet several criteria such as emission type, energy transfer, penetration range, half-life, ability to be fixed on the biological vector, and
12
also the toxicity of the daughter radionuclides. Regarding to the emission type, the α- and β-particle emitters have received much attention. Due to the relative long penetration and sparse scattering transfer of β-particle, they are appropriate for large tumors. The typical radionuclides are 90Y, 131I, 177Lu, 186Re, 212Pb. However, these properties can also be
disadvantages because they can lead to harmful radiation of healthy tissues beyond the targeted cells when the tumor is small. Compared to β-particle emitters, the short penetration range α-emitting nuclides are ideal for the treatment of small tumors or residual diseases after surgery. Table 1.2 lists promising candidates of α-emitting radionuclides applied in nuclear medicine. To date, a drug containing the α-particle emitting nuclide 223Ra, Alpharadin® (radium-223 chloride), is already available on the
market for use on patients with bone metastases.
Table 1.2 Potential candidates of α-emitting radionuclides for the application in nuclear medicine.
Radionuclides Half-life α-emission energy (MeV) Advantages Disadvantages
212Bi 60.6
min 7.8 Production yield can be controlled 2.6 MeV γ-ray exposure
225Ac 10 d 6 – 8.4 5 α-emissions Immense α-particle
recoil energy
213Bi 45.6
min 6 – 8.4 Labeling reaction rapid and effective Radiation damage to the biological vectors
211At 7.21 h 6.8 Appropriate
half-life Production is facility-dependent
223Ra 11.4 d 6 4 α-emissions Gaseous product 219Rn
distributes in vivo
149Tb 4.15 h 4 Weak specific
irradiation Decay products may deposit in bone mineral
227Th 18.7 d 6 5 α-emissions Gaseous product 219Rn
distributes in vivo
1.2.2 Radiolabeling
For most cases, once the best couple of biological vector and radionuclides is selected, it is important to link them together; this process is called the radiolabeling. The goal of this
13
step is to achieve a biological vector-radionuclide system with adequate in vivo stability. Current radiolabeling protocols are usually based on the following two strategies.
a) Direct radiolabeling
The direct radiolabeling mechanism is meant to link the radionuclide directly to a biological vector as shown in Figure 1.5 a. This mechanism is strongly dependent on the basic chemistry of the applied radionuclide. A good example is the straightforward integration of 131I into phenyl rings of terminal tyrosine groups of antibodies through
electrophilic substitution.[27,28]
b) Indirect radiolabeling
The indirect radiolabeling mechanism involves the application of a bifunctional chelating agent (BFC) who serves as a linker for the radionuclide and the biological vector, as shown in Figure 1.5 b.
In this mechanism, as suggested by its name, the BFC plays a double role: through one functional group it binds the radionuclide, and through the other one it sticks to the biological vector.[26,29] It is worth noting that BFCs are quite specific to given radionuclides,
as for instance the preferred coordination number(s) may depend on the radionuclide.[26]
14
1.2.3 Application of
211At in targeted alpha-particle therapy
1.2.3.1 Characteristics of the 211At radionuclide
As previously discussed, TAT involving an α-particle emitter is on the paper preferred for treating small tumors or the residual diseases after surgery. Among the α-emitting radionuclides, 211At is considered to be a promising candidate due to the following
assets:[30–32]
➢ 211At has a half-life of 7.21 h, which is long enough to complete the complicated
radiolabeling strategies, and short enough to control what happens after injection.
➢ 211At is a 100% α-particle emitter with sufficient energy, on average 6.8 MeV.
➢ The LET of its α-particles is, on average, 97 keV·μm–1, is close to the value needed to
achieve the highest relative biological effectiveness of ionizing radiation.
➢ The energy range of its α-particles corresponds to 55–80 μm, limiting the additional damage to adjacent healthy tissues.
➢ The X-rays generated through the EC decays of 211At to 211Po, with energy up to 92 keV,
provide a valuable means for tracking 211At in laboratory studies. The 211At activity
distribution can be imaged and quantified by planar and SPECT imaging.
1.2.3.2 Radiolabeling with 211At
Medicinal chemists and oncologists have started (or at least attempted) to make profit of the favorable characteristics of 211At to treat cancers for decades. So far, two phase I
clinical tests have already been completed[33,34] and one phase II one is ongoing
(NCT03128034). More radiopharmaceuticals are in development, and the challenge is still the establishment of an efficient and reliable radiolabeling protocol. Guided by the radiolabeling with iodine radioisotopes, three main strategies have been envisaged: radiolabeling through At-C bonds, through At-B bonds, and through At-metal bonds.
15
1) Radiolabeling through At-C bond
Since the direct electrophilic aromatic substitution (EAS) approach is used to directly label iodine radioisotopes to the aryl C atoms of terminal tyrosine residues in antibodies, the same approach for the radiolabeling of 211At has been considered.[27,28] However, the 211At-labeled compounds by this approach has shown to be highly unstable in vivo,
presumably due to the rather weak bond formed between At and C atoms.[35] Therefore, it
is more reasonable to label 211At to biological vectors through BFCs or to targeting agents
than direct radiolabeling.
To this end, a lot of targeting agents and BFCs, retaining 211At via an At-C bond have started
to be developed. Interesting compounds have been successfully synthesized with At+
through EAS, or with At– through nucleophilic aromatic substitution (NAS). For example, 211At-astatobenzylguanidine (MABG, Figure 1.6 a) was found to be able to bind selectively
to neuroblastoma tumors.[36] 211At-labeled methylene blue (Figure 1.6 b) is a targeting
agent that binds almost exclusively to melanoma tumors.[37] Succinimidyl 211
At-astatobenzoate (SAB, Figure 1.6 c) has been successfully linked to specific antibodies, and the complex has been attempted clinically.[38,39]
Figure 1.6 Examples of 211At-targeting agents and 211At-BFCs: a) MABG, b) 211At-labeled methylene blue and c) SAB.
2) Radiolabeling through At-B bond
Boron compounds have been successfully used for cancer treatment within the boron neutron capture therapy. They can be easily conjugated to targeting agents if they are
16
appropriately functionalized. Since the I-B bonds are known to be significantly stronger than the I-C ones, it led to the idea that radiolabeling through 211At-B bonds will be more
stable than 211At-C bonds.[40] Based on this chemistry, Wilbur et al. developed and tested
several boron cluster reagents, such as nido- and closo-carboranes, for radiohalogenation of biomolecules.[40,41] These reagents have also been implemented in protein labeling and
were found to be more stable in vivo compared with the corresponding astatinated proteins labeled by aromatic reagents.[42–44] Recently, a phase I/II clinical trial is ongoing,
using a 211At-labeled monoclonal antibody conjugate produced with the B10-NCS, a
closo-decaborate compound.[45]
Figure 1.7 Examples of astatinated and functionalized boron clusters: a) a nido-carborane derivative, b) a bis-nido-carborane derivative and c) a closo-decaborate derivative. Filled circles represent C atoms while empty ones represent B atoms.
3) Radiolabeling through At-metal bond
A novel strategy to retain 211At in stable complexes has been recently proposed by
Pruszyn ski et al.[46–48] By extrapolating from I–, they assumed that At– would have soft
anion properties and be able to form strong interactions with soft metal cations, according to the hard and soft acids and bases (HSAB) theory of Pearson[49]. Therefore, their idea is
to attach At– to metal cations, which are themselves chelated by BFCs. Pruszyn ski has
notably reported the complexation of 211At with Rh(III) and Ir(III) metal cations retained
17
Figure 1.8 Examples of stable complexes with 211At–attached to a) Rh (III), and b) Ir (III) soft metal cations.
1.2.3.3 In vivo stability of 211At-labeled complexes
The synthesis of 211At-labeled complexes with adequate in vivo stability is a critical step
for the application of 211At in TAT, because free 211At in the human body will cause
undesired toxicity to patients. As mentioned in the previous section, different methodologies developed for radioiodine have been applied to astatine. Unfortunately, different extent of in vivo deastatination occurs in most of the cases, notably when the biological vector is metabolized, for uncertain reasons.[50] It becomes clear that the
improvement of the actual radiolabeling strategy and the development of specific strategies for 211At are crucial. This demands at least a decent understanding of the
chemical behavior of At in various conditions, allowing to apply the particular chemistry of astatine for the development of novel radiolabeling protocols while not the chemistry of iodine.
1.3 The chemistry of astatine in solution
Unraveling the fundamental chemistry of At is of great importance for the development of potential novel 211At radiolabeling strategies. Nevertheless, the current understanding of
its chemistry is very limited, even 80 years after the discovery of At, mainly due to its rarity and its radioactive nature. Referring to its position in the periodic table, At may act as a chemical chameleon. On the one hand, as a member of the halogen group, At should share properties with the other halogens. On the other hand, At may also bear some metallic characters as its neighbor, polonium, which is condensed in the “metalloid” flag. The
18
following part will describe the current understanding of the chemistry of At, starting from the production methods, to the analytical methods, and finally to the current “thermodynamic database” of At.
1.3.1 Production of
211At
Although 210At is the longest-lived isotope of At, it is not frequently used in chemistry
studies, principally because of its extremely radiotoxic decay product – 210Po. In fact, 210Po
is an α-emitter with a half-life time of 138.4 days. Therefore, it will interfere the identification of At (who is also an α-emitter) and severely complicate the waste management. Instead, 211At is more “easy going”, thus it is usually the selected
radionuclide. Since 211At exists in minimal quantity in the Earth’s crust, it is impossible to
collect it from nature. Therefore, the typical way to get access to 211At sources is through
intentional production.
1) Production through nuclear reaction 209Bi(α, 2n)211At by cyclotron
Currently, the most used method for producing 211At is direct production via the
bombardment of 209Bi with energetic α-particles.
The incident energy of the α-particles beam should satisfy several conditions. As shown in Figure 1.9, according to the excitation function of the 209Bi(α, 2n)211At reaction, the
reaction threshold is about 21 MeV and the maximum production yield is reached by using an α-beam of about 30 MeV. However, starting from 29 MeV, the competing reaction
209Bi(α, 3n)210At occurs, producing undesired 210At. In order to avoid the contamination
of 210At, the incident α-particles energy should be below the threshold for the 209Bi(α,
19
Figure 1.9 Fit of the cross-sections for 209Bi(α, 2n)211At and 209Bi(α, 3n)210At reactions.[51]
According to a recent review, 29 cyclotrons around the world are identified as having a characteristic α-particle beam to produce 211At. However, only a few of them routinely
produce 211At, which has led to a commercial shortage of At source.[52]
After the cyclotron irradiation, astatine needs to be isolated from the bismuth target. Generally, there are two approaches for the recovery of astatine: wet harvesting and dry distillation. In the former, the bismuth target is dissolved in concentrated acids, such as HNO3 or HClO4. Then astatine is extracted into an organic solvent such as butyl or
isopropyl ether.[53] Astatine partitioning between nitric acid and conventional solvents
have been recently investigated in order to improve the recovery efficiency.[54–56] After
that, astatine also has to be back-extracted from the organic phase to aqueous media to achieve a chemically useful form for further labeling.[56] Though this method results in
good yields, it is time-consuming because it involves multiple radioactive manipulation steps. The commonly used approach to isolate astatine from the bismuth target is dry distillation. The target is heated to around 650°C in a quartz vessel. Astatine is sublimated selectively and entrained using a stream of nitrogen or argon. The vaporized astatine is finally condensed and recovered by a small volume of a preferred solvent such as chloroform.[57,58]
20
2) Production by 211Rn/211At generator
Another possible route for producing 211At is through a 211Rn/211At generator. The
advantage of the generator is the longer half-life of 211Rn compared with 211At (14.6 h vs.
7.2 h). This will increase the distribution area of 211At from the production site with
maintained astatine activity compared with the delivery of 211At alone. The production of 211Rn can be made through nuclear reaction 209Bi(7Li, 5n)211Rn or by the decay of 211Fr.[59– 61] However, these productions necessitate the heavy-ion high-energy beam irradiation
and careful isolation and containment of the produced 211Rn, which is more technically
demanding than the former route.[52]
1.3.2 Speciation studies
1.3.2.1 Experimental methodsThough At is available through artificial productions, the source is still limited to minute quantities. For research purposes, one may work with astatine only at ultra-trace concentrations, typically below 10–10 mol·L–1, making the conventional spectroscopic tool
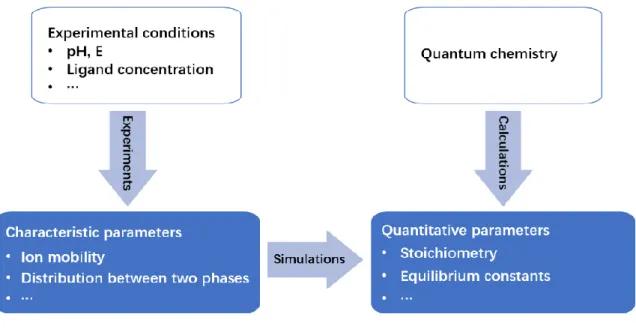
barely applicable. Therefore, in order to investigate the chemical properties of astatine in solution, indirect methods couple with a radioactivity detection system were used in the literature. These methods are mainly based on electromobility, chromatography and competition, and are presented in the following.
1) Electromobility measurements
In the electromobility measurements, a (high) voltage is applied in an electrolyte solution, creating a homogenous electric field. The sample containing At is injected into the electrolyte. Scanning by a γ-ray detector, the position of At can be recorded. At ions will move to cathode or anode, which gives the evidence of its charge. Moreover, the change of At position in function of time offers an evaluation of the mobility of the At ions in the sample, being a character of the charge/size ratio of these ions.[62]
21
2) High-performance ion exchange chromatography (HPIEC)
The principle of HPIEC measurements relies on the use of a column containing an ion exchange resin (served as the stationary phase). The column is coupled a γ-ray detector which produces radio-chromatogram signals due to the elution of species that contain
211At. In a typical HPIEC-based experiment, an eluent which contains the desired medium
(mobile phase) is first equilibrated with the system. The sample containing 211At is then
introduced and is taken by the eluent to pass through the column. The target analytes (anions or cations) are retained on the stationary phase, but can be detached from it by adding a similar kind of charge to the eluent. Depending on the eluent flow rate and the affinity of an At species for the exchange resin, it takes some time for that species to exit the column. This time is defined as the retention time and can be visualized on the radio-chromatogram. Important information such as the number of species and their charge (for ion exchange chromatography) can be obtained.
3) TLC measurements
Thin-Layer Chromatography (TLC) is a chromatography technique similar to HPIEC technique. TLC experiments use a sheet of glass, plastic, or aluminum foil, which is coated with a thin layer of adsorbent material, usually being silica gel, aluminum oxide, or cellulose, as the stationary phase. At sample is applied on the plate, a solvent or solvent mixture (known as the mobile phase) is drawn up the plate via capillary action. Because different analytes ascend the TLC plate at varying rates, separation is achieved. The distribution of At can be visualized by a γ radiation imaging system. To quantify the results, the distance traveled by the substance being considered is divided by the total distance traveled by the mobile phase. This ratio is called the retardation factor.
4) Competition experiments
This approach is based on the method described by Schubert adapted to the study of the elements present at trace levels.[63,64] The underlying principle is that an At species is
22
characterized by a given distribution coefficient in an immiscible biphasic system. If a change in the experimental conditions causes a change in the At speciation, then the distribution coefficient of astatine between the two phases may change. If a change in the distribution coefficient is observed, it must indicate a speciation change. This method is called liquid/liquid competition (LLC) when the biphasic system consists of two liquid phases, while if it refers to a solid and a liquid, then the method is classified as solid/liquid competition (SLC). By analyzing the change in the distribution coefficient as a function of key parameters, it is possible, by modelling, to identify the type of species present as well as the quantitative description of their formation.
1.3.2.2 Quantum chemistry methods
Theoretical chemistry based on quantum mechanical methods is nowadays performed almost routinely by computational chemists to understand, rationalize and even predict various properties concerning atoms, molecules, including chemical reactions. For astatinated species, quantum chemistry methods have to be applied in a context where experimental studies cannot lead to a full range of information. In particular, the absence of spectroscopic data severely limits the experimental knowledge of the nature and structures of molecules. However, a few key indices may pave the way for the computational study.
From the stoichiometry of a compound, quantum calculations coupled to an energy minimization algorithm allow to access the structure of a conformer of a compound by determining structural parameters such as inter-atomic distances and bond angles between different atoms, etc. These algorithms are said “local”, meaning that the optimized geometry depends on the starting geometry. Because of this, several starting geometries have to be considered, and several guesses for the electronic structure may also have to be considered for each starting geometry. The discrete set of optimizations may lead to only one stable structure, the minimum, or to various conformers, with one global minimum and at least one local minimum. Depending on the energy difference
23
between the conformer, the Gibbs free energy may be governed by the global minimum, or an ensemble of conformers may have to be considered.
At is a heavy main-group element; therefore, its computational treatment requires the consideration of relativistic effects, at least the scalar relativistic ones and also in general the spin-orbit coupling. The former ones cause corrections to the one-electron energies due to the mass-velocity dependence of electrons close to heavy nuclei. The latter one causes further energy corrections and changes in the ground-state wave function due to the effective interaction between the spin of the electrons and the magnetic field induced by their motion around the nuclei.[65]In order to deal with relativistic effects as well as
electron correlation, wave-function-based methods and density functional theory (DFT) methods within two-component frameworks may be employed.
In summary, the experimental methods mentioned above can offer some characteristics of At species, with their own advantages and disadvantages. However, they can only give information at the macroscopic scale, quantum chemistry methods represent a cost-effective tool to obtain information at microscopic scale, in order to help in analyzing the experimental outcomes, as illustrated in the article of Champion et al.[13] Details of the
methods will be given in the next chapter. Concrete examples of their use to better understand the chemistry of astatine are given below.
1.3.3 Speciation of astatine in aqueous solutions in the
absence of a complexing agent
Identifying the chemical forms of At in different physicochemical conditions, in particular pH and redox conditions, is of fundamental interest for chemists, so that one can proceed more straightforwardly with the assessment of its reactivity towards other chemical species. The diagram mapping the predominant species as a function of both pH and redox potential (E) of a given media is called the Pourbaix diagram. Knowledge of this diagram is of particular importance for the development of TAT based on 211At, since it determines