HAL Id: tel-01680738
https://tel.archives-ouvertes.fr/tel-01680738v2
Submitted on 12 Jan 2018
HAL is a multi-disciplinary open access archive for the deposit and dissemination of sci-entific research documents, whether they are pub-lished or not. The documents may come from teaching and research institutions in France or abroad, or from public or private research centers.
L’archive ouverte pluridisciplinaire HAL, est destinée au dépôt et à la diffusion de documents scientifiques de niveau recherche, publiés ou non, émanant des établissements d’enseignement et de recherche français ou étrangers, des laboratoires publics ou privés.
Céline Burel
To cite this version:
Céline Burel. Nanoparticles syntheses and assemblies. Chemical Physics [physics.chem-ph]. Université Pierre et Marie Curie - Paris VI, 2017. English. �NNT : 2017PA066207�. �tel-01680738v2�
1
Thèse présentée à
L’Université Pierre et Marie Curie
Ecole doctorale de Physique et Chimie des Matériaux
Synthèses et assemblages de nanoparticules
Nanoparticles syntheses and assemblies
par
Céline Burel
en vue de l’obtention du grade de
Docteur
Spécialité : Physique et Chimie des Matériaux
Le 25 septembre 2017
Devant le jury composé de :
Dr Véronique Schmitt Dr Benjamin Abécassis Dr Jean-Baptiste Salmon Dr Jean-François Joanny Dr Rémi Dreyfus Dr Bertrand Donnio Dr Ahmed Alsayed
Directeur de recherche, CNRS, CRPP, Bordeaux Chargé de recherche, CNRS, ENS, Lyon
Chargé de recherche, CNRS, LOF, Bordeaux Directeur de recherche, CNRS, UPMC, Paris
Chargé de recherche, CNRS, COMPASS, Bristol, USA Directeur de recherche, CNRS, IPCMS, Strasbourg Chercheur, Solvay, Bristol, USA
Rapporteur Rapporteur Examinateur Examinateur Directeur Co-directeur Invité
2
“The important thing in life is not the triumph but the struggle”. Pierre de Coubertain
3
Acknowledgments
There are many people without whom this thesis could not have been carried out. I am greatly indebted to all of them. First and foremost, I would like to express my gratitude to both my advisors, Rémi Dreyfus and Bertrand Donnio, for accepting me as their student. During my time, they contributed to an enriching research experience by giving me broad intellectual freedom in my research and by supporting my attendance at various conferences. Rémi, you have always engaged me in new ideas, and demanded a high quality of work from me in all my endeavors. Thank you so much for always pushing me further and for teaching me how to highlight and promote my work. Trugarez dit Bertrand for your most valuable input to the many discussions that helped shape this project. I have always much-appreciated your constant support and optimism. Additionally, I would like to thank my reviewers Dr. Véronique Schmitt and Dr. Benjamin Abécassis for their assessment of my work as well as for their useful comments and suggestions. I also thank Dr. Jean-François Joanny for accepting to chair the examinations board.
Every result described in this thesis was accomplished with the help and support of fellow lab mates and collaborators at the Laboratory of the Future, Complex Assemblies of Soft Matter and University of Pennsylvania. My sincere thanks go to Larry Hough, Jean-Yves Delannoy and Denis Bendejacq who provided me an opportunity to join COMPASS. I am indebted to Dr. Jean-Baptiste Salmon who hosted me at the LOF for about a year while I was waiting for my visa and taught me the technique of microfluidic pervaporation. Jean-Baptiste you also deserve credit for initiating me to Matlab. I deeply want to thank Ahmed Alsayed who provided scientific insight and expertise that greatly assisted the research. I gained a lot from his vast chemistry knowledge and scientific curiosity, his knack for solving technical difficulties and his cheerful mental support. I also want to acknowledge the participation of Ludivine Malassis in the beginning of the project and without whom my work would have undoubtedly been more difficult. I also greatly benefited from her personal scientific experience throughout my time at COMPASS. I am grateful to Professor Chris Murray and Professor Arjun Yodh for hosting me at UPenn for two years and graciously allowing me to use their facilities.
During my Ph.D., I had the opportunity to mentor two students, Balkis and Sarah, who tirelessly and with much enthusiasm tackled difficult projects over the course of two summers. I was also fortunate to have the chance to work with Stan Najmr, who patiently taught me his method for synthesizing nanophosphors, in addition to TEM techniques. I would like to show my special appreciation to Jissy José for our fruitful discussions about elastic shells synthesis. I express my sincere gratitude to Rémi Giordanengo, Sylvain Caravieilhes and Courtney Shedden for their advice regarding analyses carried out during my Ph.D.. My truthful thanks also go to Jaime Hutchinson for her valuable help in the set-up of side work antibacterial tests. I would be remiss if I did not thank Lisa DeGeorge and Yolanda Judge, who provided much needed assistance with administrative tasks, reminding me of impending deadlines, helping organizing meetings and
4
keeping my work running smoothly. I am also grateful for the funding sources that allowed me to pursue my graduate school studies: the ANRT, the GIE-AIFOR, Solvay and the CNRS.
Finally, I would like to acknowledge friends and family who supported me during my time here. First, I truly thank Carl for sticking by my side when I didn’t have faith in myself. I feel like we both learned a lot about each other through these past years and I have no doubt it strengthened our relationship for the long ride. I would like to thank the LOF’s Ph.D. students and postdocs: Charles, Laura, fréro, Alexis, Sami and Shenghong who made my time in Bordeaux tremendously enjoyable. My ribs are still sore from laughing too hard with you guys, it almost feels like we were meant to meet each other. I would also like to thank my friends from both continents for supporting me throughout this adventure. Kevin, Ben, Thomas, Sabri, Marie, Axel, Cécile, Liz, Tommy, Stephen, Big Mac, Penfold, Marc, John, thank you for all the parties, the many Risk games, helping fixing my car, the numerous food cookout, the unconditional mental support and the English corrections. I will forever be thankful to John and Sherri for being awesome housemates and adoption family. They have been tremendous people to live with. Thank you both for helping whenever I was feeling down or sick. John, thank you for being the best personal bread baker in Philadelphia. Lastly, there are many people who helped me, named and unnamed, on this great adventure and I am grateful to all of them.
5
TABLE OF CONTENTS
Acknowledgements ... 3
Introduction and objectives ... 9
Chapter 1: State of the art
1. Introduction ... 112. Nanoparticles properties and applications ... 11
2.1. Nanoparticles across the ages ... 11
2.2. Nanoparticles surface plasmon resonance ... 12
2.2.1. Understanding the surface plasmon resonance ... 12
2.2.2. Factors affecting the plasmon resonance ... 15
3. Common approaches for synthesis of nanospheres ... 20
3.1. Gold nanospheres syntheses ... 20
3.2. Silver nanoparticles syntheses ... 23
3.3. Formation and growth of nanoparticles ... 25
4. Nanoparticles self-assemblies ... 28
4.1. Common self-assembly techniques ... 28
4.1.1. Spontaneous self-assembly ... 28
4.1.2. Directed self-assembly ... 30
4.2. The microfluidic pervaporation ... 36
4.3. Assembly on droplets ... 45
5. Colloidosomes and microcapsules syntheses ... 53
6. Conclusion ... 58
Chapter 2: Directed assembly of nanospheres using
microfluidic pervaporation
1. Introduction ... 602. Fabrication of a microevaporator. ... 60
6
2.2. Manufacturing of the mold ... 62
2.3. Fabrication of the PDMS microchip ... 62
3. Calibration of a microevaporator... 63
3.1. Method ... 63
3.2. Application of the methods to all the channels... 64
4. Concentration of colloidal dispersions ... 66
4.1. Growth of dense states ... 66
4.2. Particles aggregation during microfluidic pervaporation ... 66
4.3. Latex particles ... 68
4.3.1. Commercial latex ... 69
4.3.2. Homemade polystyrene beads ... 76
4.4. Gold nanoparticles ... 78
4.4.1. Synthesis of gold nanospheres ... 78
4.4.2. Functionalization of gold nanospheres ... 80
4.4.3. Concentration of gold nanospheres by microfluidic pervaporation ... 81
5. Conclusion ... 86
Chapter 3: Fabrication of hybrid microcapsules from Pickering
emulsions
1. Introduction ... 892. Gold-silica microcapsules ... 89
2.1. Pickering emulsion formation ... 90
2.1.1. Adsorption at the interface ... 90
2.1.2. Number of nanoparticles ... 91
2.1.3. Decrease of an energy barrier... 93
2.2. Polycondensation of silica at the oil/water interface ... 94
2.3. Synthesis of gold-silica microcapsules ... 95
2.3.1. Effect of pH ... 95
2.3.2. Effect of butanol ... 98
2.3.3. Effect of PEOS concentration ... 98
7
3. The silver-silica microcapsules ... 104
3.1. Pickering emulsion formation ... 104
3.2. Synthesis of Ag-Si microcapsules ... 105
4. The gold silver silica microcapsules ... 107
5. The gold acrylate microcapsules... 109
5.1. Polymerization of acrylate at the oil/water interface ... 109
5.2. Synthesis of the gold-acrylate microcapsules ... 110
6. Conclusion ... 112
Chapter 4: Plasmonic microcapsules as optical strain and pH
sensors
1. Introduction ... 1142. Optical strain sensors ... 115
2.1. Current technologies ... 115
2.2. The gold-silica microcapsules ... 120
2.2.1. The gold silica microcapsules synthesis... 120
2.2.2. Fabrication of polymer film doped with gold-silica microcapsules ... 121
2.2.3. Stretching test ... 122
2.2.4. Impact test ... 127
2.2.5. Perforation test ... 128
2.2.6. Au-Si microcapsules film aging ... 128
2.3. The gold-acrylate microcapsules ... 130
2.3.1. Gold-acrylate microcapsules synthesis ... 130
2.3.2. Fabrication of elastic films doped with elastic microcapsules ... 131
2.3.3. Stretching test ... 132
2.4. Plasmon-based mechanochromic microcapsules vs other strain sensors ... 133
3. Optical pH sensors ... 134
3.1. Current technologies ... 134
3.2. pH responsive gold-acrylate microcapsules ... 138
3.2.1. pH sensitivity of Poly(acrylic acid) ... 138
8
3.2.3. Reversibility of the color change ... 145
3.2.4. Color as a function of pH ... 146
3.3. pH responsive microcapsules vs other pH sensors ... 149
4. Conclusion ... 150
Conclusion and perspectives ... 152
Bibliography ... 154
Annex 1: Characterizations ... 168
Annex 2: Publication ... 170
9
Introduction and objectives
In the last few decades, nanoparticles -very tiny dispersions on the nanoscale of materials- have emerged as one of the most interesting and promising building blocks in order to create new materials. They are interesting because they belong to and therefore connect many fields in science, from inorganic chemistry to quantum physics and from organic synthesis to optics. As such, they are remarkable objects to study and they have generated a wave of excitement in many scientific communities. They are also promising because the range of potential applications where these objects play a significant role is enormous and spans many fields such as diagnosis, water purification, surface treatment, bioremediation, electronics, photovoltaics and optics.
Many applications of these objects require fine-tuning and control of the way the nanoparticles are spatially organized. As such, there is a strong need to develop new processes to direct the assembly or self - assembly of nanoparticles. Many underlying general physical rules governing these processes remain to understand, and mastering of the physico-chemistry is a necessity.
In one sentence, my PhD work relates to the assembly of nanoparticles into bulky 3D materials and dispersed spherical materials.
The first chapter is devoted to a general state of the art summary in which this Ph.D. work lies. I will first present spherical gold nanoparticles, which are the ones I mainly studied throughout this work. I will describe their synthesis and I will emphasize on some of their optical properties, specifically their plasmonic properties. I will also describe the common methods used to assemble them.
The second chapter will be devoted to describing my efforts in mastering a specific technique of directed assembly of nanoparticles: the pervaporation technique. I will show how pervaporation can be used to assemble micron-size latex particles and gold nanospheres into nice 3D organized crystalline bulk materials. This work paves the way to further studies on assembling nanoparticles to create electromagnetic metamaterials.
In the third chapter, we will move beyond the assembly of nanoparticles into bulk materials, and show how nanoparticles can be assembled to form hollow hard and soft microcapsules. I have developed a novel way of synthesizing gold nanoparticle - based microcapsules which I will describe in detail in this chapter.
Finally, in the fourth and last chapter of this manuscript, I will present how these gold nanoparticles-based microcapsules can be used to develop new strain and pH sensors based on the optical plasmonic response of the nanoparticles. These sensors have many potential applications and this last part establishes the groundwork for myriad of future interdisciplinary research.
10
TABLE OF CONTENTS
1. Introduction ... 11
2. Nanoparticles properties and applications ... 11
2.1. Nanoparticles across the ages ... 11
2.2. Nanoparticles surface plasmon resonance ... 12
2.2.1. Understanding the surface plasmon resonance ... 12
2.2.2. Factors affecting the plasmon resonance ... 15
3. Common approaches for synthesis of nanospheres ... 20
3.1. Gold nanospheres syntheses ... 20
3.2. Silver nanoparticles syntheses ... 23
3.3. Formation and growth of nanoparticles ... 25
4. Nanoparticles self-assemblies ... 28
4.1. Common self-assembly techniques ... 28
4.1.1. Spontaneous self-assembly ... 28
4.1.2. Directed self-assembly ... 30
4.2. The microfluidic pervaporation ... 36
4.3. Assembly on droplets ... 45
5. Colloidosomes and microcapsules syntheses ... 53
11
1. Introduction
In this chapter, we present the main optical properties of gold and silver nanospheres. We show that their optical properties depend on their size, shape, environment and interparticles’ spacing. Then, we detail the main synthetic methods to produce these nanoparticles. We evidence that some synthetic processes are less time consuming than other and allow us to post-functionalize the nanoparticles. We also briefly explain how the nanoparticles form and grow during synthesis. Finally, we present several of the most commonly used nanoparticle self-assembly techniques. Among them, we focus on the microevaporation and the assembly on emulsion droplets because we use these two techniques to design novel optical materials (Chapters 3 and 4).
2. Gold and silver nanoparticles properties and applications
2.1. Nanoparticles across the ages
Nanoparticles have always existed in nature and their history can be traced back in time. Inorganic nanoparticles are naturally produced by volcanic eruptions, forest fires or even microbial processes. The unique optical properties of nanoparticles provide a strong color to the media in which they are dispersed. Therefore, for a long time nanoparticles were used as pigments in the making of glasswares and lusterwares (see Figure 1). By the 4th century, the Romans had colored a glass cup with silver and gold nanoparticles. This cup is one of the most well-known examples of stained glass because it has the ability to change color depending on whether light passes through it or not. It appears red when illuminated from the inside and green when illuminated from the outside. In the 9th century in Mesopotamia, metallic ornaments based on copper and silver nanoparticles were handcrafted.
The most distinctive contribution in the nanoparticles history has been brought a long time after by Michael Faraday about 160 years ago. He synthesized for the first time gold particles the size of which could be controlled by changing the experimental conditions. His synthesis method was based on the reduction of a solution of gold chloride (HAuCl4) by phosphor. He recognized
that the red color of the particle dispersion was due to the small size of the gold particles. He also observed that the color of thin particle films was varying depending on the mechanical compression applied. His discoveries on the electronic and optical properties of nanoparticles led to the emergence of the modern colloidal chemistry1.
12
Figure 1 : (a) Gold nanoparticles in a quartz2, (b) Roman Lycurgus up, 4th century kept at the British Museum, (c-d)
9th century lusterwares from Mesopotamia3.
2.2. Nanoparticles surface plasmon resonance
2.2.1. Understanding the surface plasmon resonanceGold and silver are conductive metals. The free electrons (d electrons of the conduction band responsible for the electric conductivity of the metal) can move freely within the nanoparticles but are confined in the particles4. This confinement give rise to new optical properties not existing in the bulk solid metals. When a metal nanoparticle is exposed to light, the oscillating electromagnetic field of light induces a collective oscillation of the free electrons of the metal.Indeed, within an electromagnetic field, the free electrons of the nanoparticle move together entailing an accumulation of negative charges on one side of the nanoparticle and of positive charges on the other side as schematized in Figure 2. The electromagnetic wave being sinusoidal, the electrons displacement is regularly inverted. It results in an oscillation of the metal particles surface electrons. The amplitude of the oscillation reaches a maximum at a specific frequency: the surface plasmon resonance. The surface plasmon resonance induces a strong absorption of the incident light by the nanoparticles and thus can be measured using a UV–Vis spectrophotometer.
13
Figure 2: Illustration of the nanoparticles surface plasmon5.
In 1908, Gustave Mie6 solved Maxwell equations to model the interaction of light with spherical nanoparticles. His theory describes the extinction (absorption plus scattering) of spherical nanoparticles of different sizes. He demonstrated that for nanoparticles of diameter much smaller than the incident light wavelength (2R << 𝜆, 2R < 20 nm), the extinction cross-section of a metal sphere of radius R is given by:
𝜎(𝜔) = 9𝜔ɛ𝑚 3/2 𝑐 4𝜋𝑅3 3 ɛ2 (ɛ1+ 2ɛ𝑚)2+ (ɛ2)2
Equation 1: Extinction cross-section of a metal sphere of radius R7.
Where ω is the pulse of the exciting light, c is the speed of light and ɛ𝑚 and ɛ𝑝 = ɛ1+ 𝑖ɛ2 are respectively the dielectric constants of the surrounding medium and the metal particle itself. ɛ𝑚 is
frequency-independent and ɛ2 shows a weak dependence on the UV-Visible. One can observe that
the maximum extinction occurs when the denominator of Equation 1 is minimal. This is the case when:
ɛ1(𝜔) = −2ɛm
Equation 2: Satisfied condition at the maximal extinction
When the condition in Equation 2 is attained, the surface plasmon resonance occurs and the light extinction (absorbance plus scattering) by the particle is maximal.
The extinction cross-section 𝜎 is related to the extinction coefficient ε (L. mol−1.cm−1) by Equation 3:
𝜀 = 10
−3
ln (10)𝑁𝐴 𝜎
14
And the absorbance measured by UV-spectrophotometry is directly related to the extinction cross-section by the Beer-Lambert law as shown in Equation 4.
𝐴 = 𝜎𝑁𝐴𝐶𝑙
10−3 ln (10)
Equation 4: Beer-lambert for a dispersion of nanoparticles. NA is the Avogadro number, C is the molar
concentration of gold and l is the length of the cuvette used to perform the measurement.
The surface plasmon resonance is much more intense for noble metal, especially Au and Ag than other metals. The real part (ɛ1) of the dielectric constant of the metal determines the surface
plasmon resonance peak position and the imaginary part (ɛ2) determines its bandwidth8. In the case
of gold and silver nanoparticles, the absorption occurs in the visible range of the electromagnetic spectrum which explains the color of the dispersions of these nanoparticles as shown in Figure 3. The red color of a dispersion of gold nanoparticles explains why the Lycurgus cup turns red when illuminated with a transmitted light.
Gold and silver colloidal nanoparticles also give rise to light scattering phenomena that result in dichroic effects. Both types of nanoparticles show a different color when illuminated in transmission or in reflection. This dichroism is illustrated by the Lycurgus cup in which the gold component is mainly responsible for the reddish transmission and the silver for the greenish reflection.
Figure 3: (a) Extinction spectrum of 13 nm gold nanoparticles and (b) of 10 nm silver nanoparticles in water9.
For larger nanoparticles (greater than about 20 nm in the case of gold), the expression of the extinction cross-section presented in Equation 1 becomes more complicated because one must take into account the dependency of the metal nanoparticle dielectric constant on the radius of the nanoparticles8. In the next section, we will show how the plasmon resonance wavelength and bandwidth is affected by the particle metal, size, shape, environment and interparticle distance.
15
2.2.2. Factors affecting the plasmon resonance
The plasmon resonance peak position and shape depend on the type, size and shape of nanoparticles as well as on the spacing between the nanoparticles and their surrounding media. In this part, we will discuss these effects focusing on spherical gold and silver nanoparticles.
• Effect of the metal nature
The Mie theory shows that there is a condition of resonance for very small metal nanoparticles compared to the incident light wavelength when ɛ1(𝜔) = −2ɛm. From this, it clearly appears that the resonance wavelength depends not only on the dielectric constant of the surrounding media but also on the nanoparticle dielectric constant. Silver and gold having different dielectric constants10, for similar nanoparticles size, the plasmon peak position will be different. Figure 4 shows the wavelength at which ɛ1(𝜔) = −2ɛm and therefore gives a first approximation
of the position of the maximum of the plasmon peak for gold and silver nanoparticles. We find that the plasmon peak position is respectively located at 520 nm for gold and 390 nm for silver. These values are of the order of the ones obtained experimentally: λAu = 540 nm and λAg = 396 nm
(Figure 3). The small difference in the position of the peak comes from the fact that the dielectric constants are obtained from measurements done on thin metal film whereas our experimental measurements are done on nanoparticles.
Figure 4: Real part (ɛ1) of the dielectric constant of gold and silver as a function of the wavelength (Johnson and
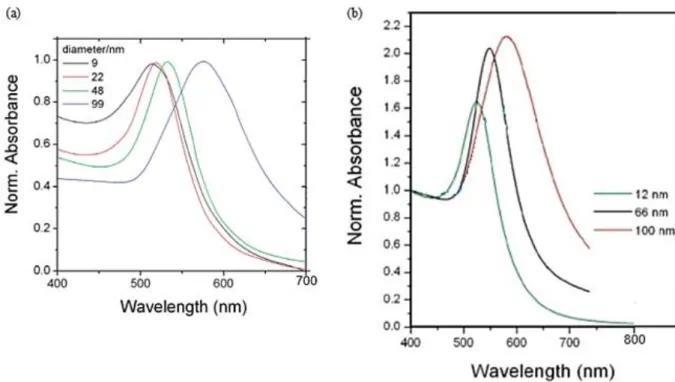
16 • Effect of the nanoparticles size
Marzan et al.12 have shown that the larger the gold nanospheres, the more red-shifted their plasmon peak is. In Figure 5 (a) we see that the position of the plasmon band is only slightly shifted for small gold spheres (from 9 to 22 nm) whereas it is strongly red-shifted for much bigger nanoparticles (from 22 to 99 nm). The size dependence of the plasmon bandwidth observed experimentally comes from the fact that the dielectric function of the metal nanoparticles itself is size dependent ɛ𝑝 (ω, R) thereby making the absorption cross-section size-dependent8.
Moreover, the width of the plasmon band decreases with the increase of the nanoparticle diameter. Indeed, it has been experimentally and theoretically demonstrated that the width of the plasmon peak is inversely proportional to the radius of small nanoparticles (for R < 50 nm)7,8.
The normalization at 400 nm (wavelength at which only zero gold (Au0) absorbs during
inter-band transition) of the spectrum in Figure 5 (b) shows that the larger the spherical nanoparticle, the higher the intensity of the plasmon peak. In accordance with Mie’s theory, the plasmon band intensity is directly proportional to the cubic radius of the nanoparticle (Equation 1).
Figure 5: Extinction spectra of different gold nanospheres sizes (a) normalized at the plasmon peak12 and (b)
17 • Effect of the nanoparticles shape
The nanoparticles shape strongly affects the plasmon band position and shape14,15. Chen et
al.15 (Figure 6) have shown that for spherical or close-to-spherical gold nanoparticles, the
extinction spectrum only shows one plasmon band whose position depends on the nanoparticle size. For gold nanorods, the extinction spectrum has two plasmon bands coming from two oscillation modes. The peak at the smaller wavelength is characteristic of the nanorod width and the peak at the larger wavelength is characteristic of its length. The transverse plasmon resonance does not depend on the nanorod aspect ratio and remains at the same wavelength than the one for gold nanospheres. As for the longitudinal plasmon, it increases with the aspect ratio.
Figure 6: TEM (Transmission Electron Microscopy) images and corresponding extinction spectra. (a) 15 nm gold
nanospheres; (b) 44 nm gold nanocubes; (c) 40 nm long and 17 nm large gold nanorods; (d) 55 nm long and 16 nm large gold nanorods; (e) 74 nm long and 17 nm large gold nanorods15.
18
• Effect of the nanoparticles surrounding environment
Depending on the refractive index of the surrounding media, the plasmon peak is not positioned at the same wavelength. The Figure 7 presents the plasmon response of 50 nm gold nanospheres as a function of three different surrounding environments: air, water and silica. One can notice that as the refractive index, n, increases, the intensity of the extinction peak increases and the plasmon peak is shifted towards higher wavelengths.
Figure 7: Effect of the surrounding environment refractive index on the plasmon response of 50 nm gold
nanospheres16.
• Effect of the inter-nanoparticle distance: plasmon coupling
One of the most interesting properties of metal plasmon nanoparticles is the dependence of their plasmon response with the distance s between the nanoparticles, (see Figure 8)17,18,19. We will
present here the different optical responses observed for gold nanospheres19.
First, when the nanoparticles are far from each other ((a), s ≈ ), their extinction spectrum shows only one plasmon peak. The nanoparticles interact and their extinction spectrum looks like the one of a single nanoparticle. Then, when the nanoparticles are brought closer to each other, the plasmon band becomes wider ((b), s ≈ 7 nm) and the plasmon peak is red-shifted. Dolinnyi19
showed that 40 nm gold nanospheres start interacting with other gold nanoparticles when the distance separating them is in the order of 40 nm. For intermediary inter-nanoparticle distances, the plasmon peak is divided in two modes ((c-f), 0.4 ≤ s ≤ 4 nm). The peak of the first mode remains at the same position when nanoparticles get closer to each other but its intensity decreases. As for the peak of the second mode, its peak is shifted towards higher wavelengths and its intensity decreases as the inter-nanoparticle distance increases. When the nanospheres are very close to each other ((g), s ≤ 0.4 nm), an additional mode develops at about 620 nm.
19
Figure 8: Simulated extinction (Mie theory) for pairs of 40 nm gold nanospheres under non-polarized light in water
and for different inter-nanoparticle distances, s: ∞ (a), 7 (b), 4 (c), 2 (d), 0.7 (e), 0.4 ( f), and 0.2 nm (g) ; Qext is the extinction19.
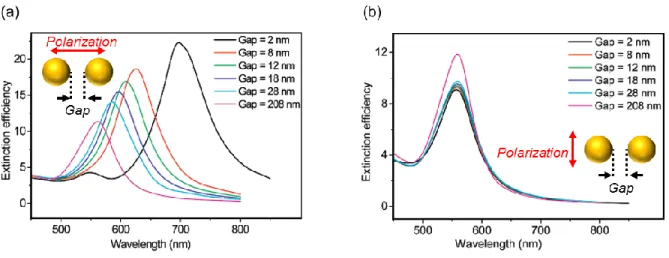
For a better understanding of the plasmon coupling phenomenon, the incident light can be polarized. Jain et al.20 have evidenced two distinct plasmon behaviors when a pair of gold
nanodiscs is illuminated under polarized light. The behavior depends on the distance between the nanodiscs. When the polarization is parallel to the interparticles axis, the electron coupling leads to a red shift of the plasmon peak and to an increase of the peak intensity (see Figure 9 (a)). When the polarization is orthogonal to the interparticles axis, the electron coupling leads to a small blue shift of the plasmon peak and a decrease of the peak intensity. In both cases, the closer the nanoparticles, the larger the shifts.
Figure 9: Simulated extinction spectra of pairs of gold nanodisc pairs (diameter = 86.5 nm and height = 25.5 nm)
in air for varying interparticle separation gap (gap = edge to edge nanoparticles) for incident light polarization direction (a) parallel and (b) perpendicular to the interparticle axis20.
20
The results presented in this part of the manuscript are valid for gold nanospheres. However, Sheikholeslami et al.21 as well as Zhao et al.22 showed similar results obtained in polarized light with silver nanospheres pairs. As for gold, an incident light polarization direction parallel to the interparticle axis entails a red shift of the plasmon band whereas a perpendicular polarization leads to a blue shift. Furthermore, the closer the nanoparticles, the more shifted the plasmon peak.
In this section, we have presented the concept of plasmon resonance of gold and silver spherical nanoparticles and its dependence with the nanoparticles metal, size, environment and interparticle distance. In the following sections, we will review the different plasmonic nanospheres syntheses methods and show the most efficient techniques to assemble them into large close packed arrays.
3. Common approaches for the synthesis of nanospheres
A gigantic library of gold and silver nanosphere syntheses exists. More than 30’000 articles are available online (Web of Science). In the context of this thesis we will focus on the most well-known and the most used protocols. Generally, metallic nanoparticles are synthesized via reduction of the corresponding metal salt. A protective agent such as a surfactant or a polymer is used to avoid the nanoparticles aggregation and precipitation during synthesis. The choice of the reduction technique, the reaction time, the solvent and the stabilizing agent determines the size and shape of the nanoparticles. Thusly, spheres13,23, nanorods15,24, cubes15, discs, nanowires, tubes, triangles25 and polyhedrons26 have already been obtained with gold, silver and other metals. One of the most striking issues encountered during the generation of nanoparticles is the reproducibility of the synthesis method and the quantity of nanoparticles made. Indeed, the volume and the Au0 concentration usually used during synthesis are small (typically [Au0] = 10-4 M and the final volume of the gold solution is 250 mL13,27). The obtained nanoparticles are not exactly the same from one synthesis batch to the other. In this manuscript, we focus on the synthesis of gold and silver spherical nanoparticles obtained in water or in water-miscible solvent with a specific emphasis on the reduction methods using sodium citrate and ascorbic acid. In the following, the terms nanoparticles, and a fortiori nanospheres will refer to spherical nanoparticles.
3.1. Gold nanospheres syntheses
The synthesis of small spherical gold nanoparticles is generally performed by the Turkevich method (1951)28. A solution of gold salt (HAuCl4) is reduced by sodium citrate. The
reaction temperature, gold/citrate ratio and the order of addition of the reagents controls the nanoparticle size dispersion. This method leads to monodisperse nanospheres with diameters of about 15 nm. In 1973, Frens29, inspired by the work of Turkevich, edited the method to synthesize
21
gold nanospheres of controlled sizes in the range 16 to 147 nm. The ratio between the reducing agent (tri-sodium citrate) controls the nanoparticle final diameter. In these two methods, citrate acts as both reducing and stabilizing agent. Even if the quality of the obtained nanoparticles is not optimum (shape, size and size distribution), these methods are widely used because they are easy to implement.
A more efficient method to control the size and shape of gold nanospheres was proposed in 2000 by Natan et al30. In their work, large spherical gold nanoparticles are synthesized by a seed growth process as shown in Figure 10. Small seed nanoparticles are first synthesized and further grown via the reduction of the metal salt in the presence of surfactants to stabilize the nanoparticles. Seeds are generated using a first reducing agent (sodium borohydride or sodium citrate) whereas the growth is done with a second milder reducing agent (often ascorbic acid). The ascorbic acid reduces the metal salt in an intermediate state which becomes zero gold (Au0) only after a catalyzed reduction occurs at the surface of the seeds. Even if the work of Natan et al. gave good spherical gold nanoparticles, gold nanorods were also obtained during the synthesis, affecting strongly the resulting batch monodispersity. In 2011, Bastús et al.31 successfully synthesized citrate-stabilized monodisperse gold nanospheres via seed growth. The factors influencing the size distributions of the nanoparticles obtained as shown in Figure 10 are the initial seeds concentration, the number of growth steps and of secondary nucleations.
Figure 10: Monodisperse gold nanospheres synthesized by seed growth method with citrate. The nanoparticle
22
In 2006, following the work of Jana et al.32, Liz-Marzán’s13 team came up with a new seed
growth method to synthesize very monodisperse gold nanospheres to a diameter up to 181 nm. The TEM images of the nanoparticles obtained via this method are presented in Figure 11. The CTAB (hexadecyl-trimethyl-ammonium bromide) used as surfactant during the seed growths enables a better control of the final morphology of the gold nanoparticles. This new process gave gold nanoparticles a more spherical appearance while forming less gold nanorods. However, this method leads to nanoparticles that are not easily functionalizable a posteriori, which can be disadvantageous. Indeed, the CTAB is strongly anchored onto the gold nanoparticles and ligand exchange with another molecule having an affinity for gold surface is not straightforward, requires multiple steps and specific synthesis conditions17.
Figure 11: TEM images of gold nanospheres after seed growth. The mean diameters are (a) 66 nm (b) 100 nm, (c)
139 nm, (d) 157 nm et (e) 181 nm13.
In 2016, Malassis et al.33 demonstrated that it is possible to obtain rather spherical
monodisperse gold nanoparticles of different sizes by reduction of gold salt with ascorbic acid by tuning the pH of the mixture. The real advantage of this synthesis is its easy implementation. Indeed, the synthesis method only involves one step as compared to the multiple synthesis steps necessary in the seed growth process. Moreover, ascorbic acid is very easily exchanged by other stabilizing agents allowing multiple post-functionalization of the obtained gold nanoparticles.
23
3.2. Silver nanoparticles syntheses
Commonly, silver nanoparticles are obtained by chemical synthesis via a reduction process of silver precursor (usually AgNO3). The reducing agents used can be: sodium citrate34, alcohols35,
sodium borohydride. Polymers such as PVP (polyvinylpyrrolidone)36, PVA (polyvinyl alcohol) and surfactants are also added to the synthesis in order to stabilize the nanostructures formed. The obtained nanoparticles size and shape can be controlled via the reagents concentration, the temperature, the pH, the reducing agent type and the stabilizing agent type.
We will focus here on three synthesis methods often used in the literature to produce silver nanospheres. They are: the reduction by citrate, the polyol process and the reduction by ascorbic acid. We will use the observations made during the analysis of these three methods to design our own silver nanoparticle synthetic protocol presented in Chapter 3.
One of the most accessible methods to synthesize silver nanospheres is the synthesis of Lee and Meisel (1982)34. This method is very close to the Turkevich method to form small spherical gold nanoparticles. Citrate ions are used as both stabilizing and reducing agents. However, unlike the Turkevich method, this method gives polydisperse nanoparticles of different shapes. Theoretical study revealed that the citrates preferentially anchor to the facet Ag(111) rather than to the facet Ag(100)37, which could be a reason for the nanoparticle anisotropy. Tuning the pH
brings an additional control over the size and shape but it does not give very uniform nanospheres. Due to the simplicity of this synthesis, this process is still often used specially to obtain large quantities of nanoparticles.
The polyol process is a robust and versatile synthetic method which allows for a great control over the silver nanostructures size and shape. The polyol (ethylene glycol, 1,2-propylene glycol or 1,5-pentanediol) is used as a solvent but also as a reducing agent. The silver precursor and a second stabilizing agent are mixed with the pre-heated polyol solution. The reduction of silver ions leads to the formation of silver nanoparticles (Ag0). At the beginning of the reduction, small nanoparticles are obtained. As the reaction goes on, these seeds grow and can differentiate into three types of particles: single crystalline, single twinned or multiple twinned. Then, these three types of particles evolve preferentially towards certain particle shapes as shown in Figure 13. A better control over the size and shape of the final particles is obtained using different reducing and stabilizing agents. Moreover, the careful selection of the stabilizing agent can favor the growth of anisotropic nanoparticles. Indeed, Xia et al.36 have demonstrated the selective growth of silver nanorods and silver nanowires using PVP as a capping agent. PVP preferentially anchors at specific silver nanoparticle facets, inhibits the growth of the corresponding planes and enables the synthesis of anisotropic nanoparticles as illustrated in Figure 14. Therefore, with PVP, the synthesis preferentially leads to nanorods, bipyramids and cubes. The silver nanospheres synthesis does not require the use of PVP because their growth must be isotropic.
24
Figure 13:Syntheses of silver nanostructures by the polyol process. (A) Formation mechanisms of the different
nanostructures : (B) spheres, (C) cubes, (D) truncated cubes, (E) bipyramids, (F) bars, (G) spheroids, (H) triangular plates and (I) nanowires35.
Figure 14: Twinned decahedral seeds lengthened into rods. PVP selectively adsorbed on the (100) side facets so
25
In 2010, Qin et al.38 came up with an easy one-step synthesis of spherical silver
nanospheres. They demonstrated that the size of spherical silver nanoparticles was tunable by using ascorbic acid as the reductant. Variation of the reactivity of ascorbic acid with pH was effective to tune the final size of the nanoparticles. The higher the pH, the smaller the nanoparticles. The shape of the nanoparticles could be more spherical-like by promoting the intraparticle ripening. Like gold nanoparticles, silver nanoparticles stabilized by ascorbic acid can be easily post-functionalized by other ligands.
Figure 15: TEM images of aged silver nanospheres obtained with the method of Qin et al. as a function of the pH.38
In this section, we have shown that many routes are available to synthesize gold and silver nanospheres. Depending on the final applicative role of these nanoparticles, the size, size distribution, sphericity and amount of nanoparticles requisites are different. The synthesis method must be selected according to all these specifications. As part of this thesis, in Chapter 2 we will see that the synthesis of very monodisperse gold nanospheres is crucial to obtain crystalline arrays of close-packed nanoparticles. In Chapter 3, we will show that the amount of silver and gold nanoparticles is an essential parameter in the fabrication of nanoparticle-stabilized emulsions.
3.3. Formation and growth of nanoparticles
Understanding the mechanisms of formation and growth of nanoparticles is essential for a better control of the nanoparticle size and shape during synthesis. Several approaches exist and we will present here two of them.
• LaMer model
The LaMer model39 is a commonly accepted model describing the general mechanism of
the nanoparticle formation process. The mechanism described in Figure 16 (a) suggests a reaction scheme divided in three steps: the generation of Au0 atoms, the nucleation of Au0 clusters and their growth into nanoparticles. First, the Au3+ ions are reduced in Au0 species and the concentration in Au0 increases until it reaches a « critical limiting supersaturation (Cmax) ». At that point, the Au0
aggregate into small clusters via a nucleation process. Once the clusters have reached a critical radius, r*, the clusters grow into nuclei (see Figure 16 (b)) because it favors the decrease of the
26
free energy. These nuclei grow rapidly by consuming the metal atoms present in the bulk solution. Therefore, a decrease in the concentration of the Au0 is observed during growth. If the Au0 concentration falls rapidly below the supersaturation ([Au0] < Cmin), the nucleation ends, and only
the nuclei already present in the reaction mixture grow to form nanoparticles with homogenous size distribution. In this model, the thermodynamic stability along with the reduction kinetics determine the size and the number of nanoparticles. In this mechanism the reduction reaction can be promoted by raising the temperature40, thus favoring the formation of nuclei and resulting in a larger number of small nanoparticles.
Figure 16: (a) Schematic illustration of La Mer’s nucleation condition40. (b) Variation of the free energy (G)
associated with the nucleation of a nanosphere at r = r* 41.
• Polte model
J. Polte et al.42,43 studied the formation and growth of metal nanoparticles from a different perspective. They experimentally followed the formation of gold nanoparticles synthesized using the Turkevich process, which we explained before. They demonstrated that the formation of the gold nanoparticles is governed by the colloidal stability of the system rather than by the thermodynamic laws. Their studies suggest a model for the formation and growth of gold nanoparticles in 3 main stages as illustrated in Figure 17: the generation of Au0 atoms (step 1), the coalescence of Au0 clusters (step 2) and their growth into nanoparticles (step 3). In the first step, the Au3+ ions are reduced by the sodium citrate in Au0 atoms. Then, these Au0 atoms form small clusters which coalesce to form small nanoparticles. In this model, the growth is governed by
27
colloidal stability implying that clusters always grow to a size above which they cannot overcome the energy barrier of aggregation or coalescence. Since the aggregation barrier increases with increasing particle size, the coalescence/aggregation stops at a critical nanoparticle size. This critical size usually corresponds to the size at which the clusters are big enough to be effectively electrostatically stabilized by the citrate ions. Then, the residual gold ions (existing because the sodium citrate is a mild reducing agent and do not reduce very fast the gold ions) diffuse in the electric double layer (EDL) of these small nanoparticles, get reduced, and grow onto the existing nanoparticles (step 3). In this model, the minimal particle size is determined by the colloidal stability.
Figure 17: Schematic of the refined 3-step nanoparticle growth mechanism of the Turkevich method42.
These two models do not provide any universal explanatory mechanism for all the existing nanoparticle syntheses. Indeed, many factors can impact the growth of nanoparticles. For instance, the type of ligands capping the nanoparticles44 or the chemical reactivity of the different precursors. Thus, more detailed models are required to aid for a better understanding of the important factors responsible for the nanoparticles formation.
In the section 3 of this chapter we have described the most common syntheses for the formation of spherical gold and silver nanoparticles. We also briefly explained their formation mechanisms. The next section is dedicated to the different techniques existing to assemble these nanoparticles into close pack arrays.
28
4. Nanoparticles self-assemblies
Self-assembly of colloids is a “bottom-up” approach for the fabrication of nanomaterials from stable colloidal dispersions. A very large number of self-assembly techniques exist and an exhaustive review would be impossible. We will sort them in two main categories: spontaneous and directed self-assemblies. The spontaneous assembly can be defined as the assembly mediated by colloidal interactions (electrostatics, steric, depletion, Van Der Waals) driven only by the thermodynamic. In this process, the colloids spontaneously organize into ordered structures of length scales on the order of 1 -100 µm. Due to the fabrication process, the collection for further use of these ordered structures is not straightforward. In contrast, the directed self-assembly uses external forces such as external fields, physical confinement, or evaporation of solvent to trigger the organization of colloids. The structures obtained with this method are organized on a larger length scale, on the order of several microns to the millimeter. The directed self-assembly techniques include nonexhaustively sedimentation, Langmuir-Blodgett, electrophoresis, spin-coating, dip-coating and drying. A template such as a simple glass slide or more exotically a specifically functionalized substrate, is often used to facilitate the organization of the nanoparticles. However, and this may be a drawback, in most cases this template becomes part of the final nanomaterial structures. The self-assembly of nanoparticles can occur at the liquid-liquid, liquid-air or liquid-solid interfaces. In this section, we will describe the most recurrent techniques in the literature such as: Langmuir-Blodgett, sedimentation, evaporation of solvent and adsorption of nanoparticles on droplets. We will focus on the technique of microevaporation microfluidic and on nanoparticles assembly on droplets because these two techniques give rise to the fabrication of 2 different types of materials: bulky 3D and dispersed materials.
4.1. Common self-assembly techniques
4.1.1. Spontaneous self-assemblyThe dipolar, Van-der-Waals and electrostatic interactions play a major role in the type of structures obtained through the organization of nanoparticles45,46. These forces can be tuned by
changing the solvents polarity, the nanoparticles charges, the nanoparticles wetting or the size and shape of the colloidal nanoparticles. Here, we briefly present two examples which illustrate these phenomena. These two examples show the fabrication of dispersed materials via spontaneous self-assembly of nanoparticles.
Nie et al.47 were able to organized polymer-CTAB-gold nanorods-polymer nanoparticles
(see Figure 18) into different structures with varying geometries. These nanoparticles are nanorods which sides are coated with CTAB and which ends are coated with a polystyrene polymer. By changing the solvents quality, the authors were able to solvate either the sides or the ends of the nanorods. Both DMF and THF are good solvents for the polystyrene block however, water reduces
29
the solubility of the polystyrene. The CTAB is poorly soluble in THF but is well solvated in water. Nanochains are obtained when the nanoparticles aggregate by the ends (see Figure 18 (a)). Nanospheres form when the nanoparticles aggregate side by side and by the ends (see Figure 18 (b)). The self-assembly is reversible.
Figure 18: Self-assembly of CTAB-coated gold nanorods in selective solvents forming (a) nanochains and (b)
nanospheres. The insets show the corresponding schematic diagrams of the nanorod assemblies47.
Another interesting example was provided by Hickey et al.48.They have fabricated polymersomes based on the co-assembly of hydrophobic inorganic iron oxide particles and amphiphilic polymers (poly(acrylic acid)-b-polystyrene) at an oil/water interface. They demonstrated that the size of the nanoparticles affects the size of the final polymersomes. Larger nanoparticles induce higher curvatures of the polymer membrane and smaller vesicles. We will describe how nanoparticles assemble at a liquid/liquid interface in the following section 4.3 of this chapter.
Figure 19: (a) Schematic representation of the self-assembly of magneto-polymersomes. (b) TEM images of
30
4.1.2. Directed self-assembly
• Sedimentation
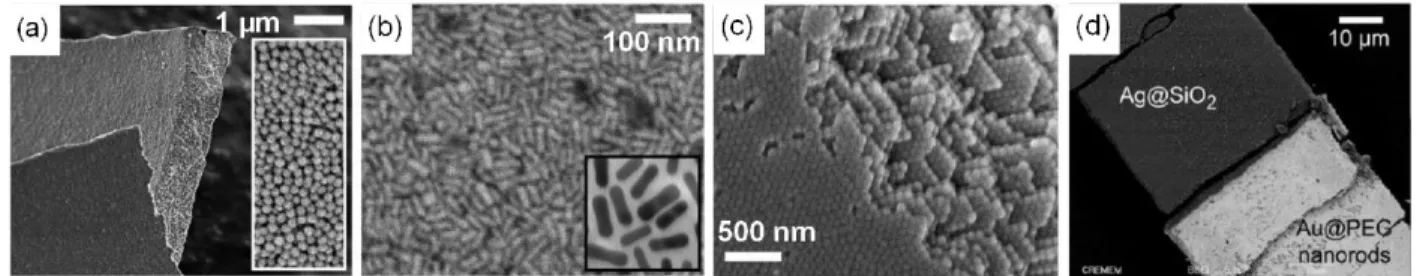
Particles left to rest in a solvent of density lower than the particles’ density, slowly sediment under gravity following the Stokes law. The particles generally form face-centered cubic (FCC) lattices because it is the most thermodynamically stable structure (theoretical calculations show a lower Gibbs free energy for FCC lattices) (Figure 20)49. However, a precise control over the size, the density, the volume fraction of the colloids and the solvent in which the particles are dispersed are necessary to successfully assemble them in well-organized arrays. Sedimentation being a rather slow process, the fabrication of crystalline lattices can last up to several weeks with this method. Moreover, during sedimentation, several “nucleation” sites can appear in different places within the assembly which can lead to polycrystalline domains. For these reasons, it is unsuited for large scale production and other, more controllable and faster routes are more commonly used.
Figure 20: SEM (Scanning Electron Microscopy) image of spherical 225 nm core-shell Au@SiO2 assembled by
sedimentation. Nanoparticles are organized in a face-centered cubic lattices (FCC) 50.
• Drying
Drying is the most used method in the self-assembly of nanoparticles. It includes: the horizontal deposition (Figure 21) where a droplet is left to dry on a substrate51,52,53, the vertical deposition54 where a substrate is pulled out of a colloidal solution vertically (Figure 22) or the
drying in confined geometries55,56,57 (Figure 24). Nanoparticles are directly assembled on solid surfaces by local increase of the nanoparticles concentration as shown in Figure 21 (b-c). The assembly is conducted by solvent evaporation and assisted by capillary interactions guiding the nanoparticles. For a better control over the final assembly, several parameters have to be taken into account: the choice of the substrate, the substrate tilt angle, the type of substrate, the evaporation rate, the ambient temperature, the initial concentration in colloids and the ambient humidity.
Regarding the horizontal evaporation, the solvent evaporation rates on the edges of the liquid area are larger than at the center. This evaporation gradient creates a convective flux dragging the particles from the center towards the periphery of the liquid area as represented in Figure 21 (a). It has to be highlighted that the concentration of particles is possible only if the
31
particles diffusion rate is lower than the solvent evaporation rate. Because of the capillary forces, when the thickness of the liquid layer is of the same order than the particle diameter, the particles reaching the periphery are pinched onto the substrate and against the neighboring particles. Thus, a colloidal crystal is formed from the edges towards the inside of the liquid area. At the end of the evaporation process, the particles concentration in the liquid area is very low which lead to the appearance of a central ring containing no particles. Horizontally evaporating drops containing different nanoparticles, Ming et al.53 have obtained different organizations as presented in Figure 21 (d-f). Lattices with hexagonal symmetry were achieved using polyhedra, lattices with tetragonal symmetry were obtained by evaporating nanocubes, and smectic superstuctures were formed with nanorods.
Figure 21: (a) Schematic representation of the inward self-assembly mechanism for colloids evaporated on a
horizontal solid substrate. (b-f) SEM images: (b) of a side view of a colloidal crystal film grown on glass substrates from polystyrene sphere of 0.40 µm in diameter and 8.0 wt % in concentration, (c) of the cross sections of colloidal crystal films (polystyrene spheres of 0.26 µm in diameter) deposited on a silicon substrate,52, (d) hexagonally packed
Au polyhedra, (e) tetragonally packed Au nanocubes, (f) smectic Au nanorod superstructure53.
In the case of the vertical evaporation, a meniscus is formed during the immersion of the substrate in the colloidal dispersion. The evaporation being more important at the meniscus, a convective flux is created bringing the nanoparticles from the bulk towards the meniscus as shown in Figure 22 (a). The particles crystallization is initiated by attractive capillary immersion forces, mediated in the solvent meniscus between particles at the drying front. For the particles to reach the meniscus, the sedimentation rate must be smaller than the solvent evaporation rate. Moreover, the balance between capillary forces and convective particle flux during the solvent evaporation is essential for the monotonic formation of 2D colloidal arrays58. Large crystalline arrays and binary lattices can be obtained by vertical evaporation as seen in Figure 22 (b-c).
32
Figure 22: (a) Schematic illustration of the mechanism of colloidal self- assembly in the vertical deposition
technique58, (b) SEM cross-sectional images of close-packed arrays of 298.6 nm silica spheres (∼50 layers)54, (c)
co-assembly of binary dispersions of microspheres: the large spheres are 1.28 µm polystyrene beads and small spheres are 290 nm silica beads59.
By tuning the electrical charges on different types of sterically stabilized nanoparticles, Shevchenko et al.45 obtained multiple binary superlattices of controlled stoichiometry as presented in Figure 23. In their experiment, a substrate was placed in a glass vial containing a colloidal solution of quantum dots and the vial was placed tilted by 60°-70° inside a low-pressure chamber to evaporate the solvent and concentrate the nanoparticles.
Figure 23: TEM images of binary superlattices obtained by self-assembly of two types of nanoparticles and
modelled unit cells of the corresponding three-dimensional structures45. The nanoparticles used are :(a) 7.2 nm
33
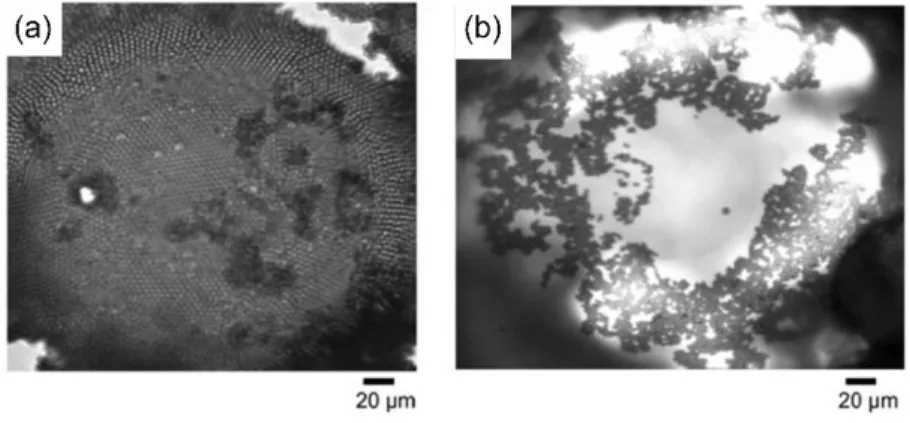
In 1999, Park et al.55 showed that when colloids are subjected to a physical confinement,
the crystals obtained demonstrate much better ordering and orientation compared with crystals grown on a bare substrate. By injecting polystyrene beads into the confinement of a rectangular cell of controllable dimensions and evaporating the water (Figure 24 (a)), they were able to obtain large defect-free colloidal crystals (Figure 24 (b-c)) and to control the number of layers formed. In 2003, Kumacheva et al.57 have generated two-dimensional colloidal lattices in microchannels by
coupling the laminar flow of dispersions of spherical colloids and geometrical confinement. They have demonstrated that different types of lattices can be obtained (hexagonal and rhombic) depending on the ratio of the width of the channel to the diameter of the particle. Microfluidic pervaporation in PDMS (polydimethylsiloxane) microchannels is another method to concentrates very dilute colloidal dispersions into organized structures56. This method will be precisely
explained in section 4.2.
Figure 24: Crystallization of colloidal particles confined in between two parallel glass plates sealed with resin. (a)
34 • Langmuir-Blodgett
Initially, the Langmuir-Blodgett technique was developed to assemble amphiphilic molecules at the air/liquid interface and to transfer the assemblies on a solid substrate. Later, this method has been used to form hydrophobic nanoparticles monolayers at the liquid/water interface and to transfer these layers on a solid substrate. Water is generally used as the bottom phase because the very high water surface tension (73 mN/m at 20°C) enables the air/water interface to hold small dense particles60.
The assembly of nanoparticles at the liquid/water interface via the Langmuir technique follows three steps which are schematized in Figure 25. In a first step, a solution of nanoparticles dispersed in a solvent immiscible with water is deposited at the air/water interface. Then, the solvent evaporates and leaves a light film of nanoparticles at the air/water interface. Finally, the nanoparticles are compressed thanks to movable barriers in order to form an organized layer of close-packed nanoparticles.
Figure 25: Schematic representation of the formation of a Langmuir layer.
Pieranski61 demonstrated that nanoparticles are trapped at the air/water interface because they reach a minimum of energy at the interface. The gain of energy, 𝛥𝐸, obtained when placing a nanoparticle of radius r at the air/water interface can be expressed as follows:
𝛥𝐸 = −𝜋𝑟2ɣ𝑎/𝑤(1 − |cos (𝜃)|)2
with cos(𝜃) =ɣ𝑎/𝑠−ɣ𝑤/𝑠
ɣ𝑎/𝑤
Equation 5: Gain of free energy (𝛥𝐸) by placing a nanoparticle of
radius r at the air/water interface. 𝜃 is the three-phase contact
angle; ɣ𝑎/𝑠,ɣ𝑤/𝑠and ɣ𝑎/𝑤are respectively the interfacial tensions air/solid, water/solid and air/water.
Figure 26: Schematic representation of
the three-phase contact angle (𝜃) at the
interface air/water/solid.
During compression, information about the nanoparticle’s packing is obtained following the variations of the surface pressure. The surface pressure (𝜋) is the difference between the surface tension air/water without nanoparticles (ɣ0) and the surface tension air/water with nanoparticles
(ɣ). It corresponds to the decrease of the film’s surface tension in presence of nanoparticles. ɣ is measured by a Wilhelmy plate during compression of the nanoparticles and is used to calculate
35
the surface pressure. The plate is situated on the “left side” of the barrier where the particles are deposited and compressed. The surface tension on the “right side” of the barrier equals the surface tension of water.
𝜋 = ɣ0 - ɣ
Equation 6: Surface pressure.
The curve following the variations of the surface pressure is called surface pressure isotherm. It provides access to the surface pressure as a function of the area allocated to each nanoparticle at fixed temperature. A typical surface pressure isotherm obtained with gold nanoparticles is presented in Figure 27 (a). Before the film is compressed, the nanoparticles are far from each other, the surface tension ɣ is unchanged and the surface pressure remains constant. During the compression of the nanoparticle layer, the surface tension ɣ decreases (more particles/surface area) entailing an increase of the surface pressure 𝜋. When the compression is important, a dense film of nanoparticles is formed at the air/water interface, ɣ strongly decreases and therefore the surface pressure increases dramatically.
Figure 27: (a) Surface pressure–area per nanoparticle isotherm for 8.3 nm gold nanoparticles encapsulated by
dodecanethiol and (b) SEM image of a monolayer made from these nanoparticles: obtained with the Langmuir-Blodgett technique62.
The transfer of the dense film of nanoparticles obtained by the Langmuir technique is done following the method developed by Blodgett. The transfer is performed by successive immersion and emergence of a solid hydrophobic substrate perpendicularly to the dense film as schematized in Figure 28. During the emergence, the nanoparticles deposit on the substrate thanks to hydrophobic-hydrophobic interactions. An example of dense film of gold nanoparticles is presented in Figure 27 (b).
36
Figure 28: Illustration of the Langmuir layer transfer by immersion and emergence of the substrate.
Many parameters influence the quality of the obtained films. During her Ph.D. candidacy, Ludivine Malassis11 studied them in detail. We are mentioning a few here: the nature of nanoparticles (charges, hydrophobicity…)63,64, the nature of the substrate, the transfer mode, the particles deposition speed on the substrate, the solvent volatility and the initial nanoparticles concentration62. A lack of control over these parameters can cause disruptions that limit the structural order of the nanoparticles assembly.
4.2. The microfluidic pervaporation
Pervaporation is a classical process in which solvent is transported through a permeable matrix towards the atmosphere. It occurs following three steps as shown in Figure 29. First, the solvent is solubilized in the matrix (i); then, the solvent diffuses in the matrix (ii) and finally, it evaporates when entering in contact with air (iii). This phenomenon induces a net flow per unit of surface, J (m/s), of the solvent pervaporating through the permeable matrix. Based on the Fick low, and in the case where the air is dry, J depends on the solvent molar volume ρs, solvent
diffusivity in the matrix Ds, and solvent solubility in the matrix cs, as well as on the thickness of
the membrane e (see Equation 7). For pervaporation of water (cs = 40 mol/m3, Ds ≈ 8.5 .10-10 m2/s, ρs
=
1.85 .10-5 m3/mol) through a PDMS (Poly(dimethylsiloxane)) layer (e ≈10 µm), J is in theorder of 100 nm/s.
Figure 29: Transport of solvent through a permeable matrix, J.B. Salmon©.
𝐽 = 𝜌𝑠𝑐𝑠 𝐷𝑠 𝑒
37
In the 90s, Favre et al.65 and Watson et al.66 have quantified the pervaporation of several
solvents such as water, chloroform, butanol and methanol through a PDMS layer. In 2004 and 2005, Verneuil et al.67 and Randall et al.68 have used this phenomenon to study the pervaporation-induced flow within microchannels molded in a PDMS block, the so-called “micro-evaporators” (see Figure 30). Because of the pervaporation of water through the permeable PDMS, there is a net flux per unit of length, 𝑞𝑒, of water leaving the microchannel, diffusing into the PDMS, up to the air where it evaporates. The pervaporation of the water through the PDMS thus induces a flow of water from the reservoir towards the end of the channel.
Figure 30: Microchannel filled with water in a PDMS matrix. The blue arrows indicate the pervaporation of water
through the PDMS and the red arrows correspond to the induced flow from the reservoir.
Randall et al.68 modeled the mass transfer of water pervaporating from one microchannel into a thick layer of PDMS surrounding the channel. Their model links the net flux per unit of length 𝑞𝑒 of water pervaporating, to the geometry of the channel (Figure 31). They found out that for thick PDMS layer surrounding the microchannel (large R), 𝑞𝑒, weakly depends on R (see Equation 8).
Figure 31: Model of Randal.68
𝑞𝑒(𝑅) = −𝜋𝑐𝑠𝜌𝑠𝐷𝑠 ln (4𝑅)𝑤
Equation 8: Net flux of water per unit of length. w is
the channel width and R is the PDMS thickness surrounding the microchannel.
Thus, for a microchannel molded in a thick PDMS block (~1 cm), the net flux of water per unit of length, qe, can be approximated as in Equation 9. In that case, qe ~ 0.1 µm2/s and the water flow
rate being pervaporated per volume of channel Qe = qeL0 is about 1 nL/h. Therefore, when the
microchannel is molded within a thick PDMS layer, the pervaporation of water through the PDMS is very low.
𝑞𝑒~𝜌𝑠𝑐𝑠𝐷𝑠
38
To speed up the pervaporation process and allow a better control of spatial and temporal pervaporation, Leng et al.69 have improved the microevaporator design by adding a thin PDMS membrane (in the order of tenths of microns) through which water pervaporates very fast (Figure 32). With their design, the pervaporation of the water is focused in a specific portion of the channel. A microfluidic channel with a width w, a height h and a length L is molded into a PDMS matrix. The channel is closed by a thin PDMS membrane of thickness e. A portion of the microchip is placed on a glass slide. The portion of the microchannel that does not face the glass slide corresponds to the “Evaporation zone”. We call the “evaporation length”, L0, the part of the
microchannel going from the end of the channel to the glass slide. Typical dimensions of microevaporators are h ~ 10 - 100 µm, w ~ 10 - 500 µm, L0 ~ 0.5 - 1 cm and e ~ 10 - 50 µm.
Figure 32: Sketch of a microfluidic evaporator as developed by Leng et al69.
From the flow rate of water which pervaporates through the membrane, Qe (m3/s), one can
define the “evaporation velocity” Ve (m/s) using:
𝑄𝑒 = 𝑤𝐿0𝑉𝑒
The latter quantity corresponds to the flow velocity (m/s) of water through the membrane in case pervaporation only occurs through the membrane (i.e. in the case of a negligible pervaporation through the “upper” PDMS block, see Figure 32).
With the aforementioned microevaporator typical dimensions, qe is of the order of 1 - 10 µm2/s
and Qe is of the order of 10 - 100 nL/h. We notice that the thin membrane of PDMS allows to
increase the flow rate of pervaporation by a factor 10 to 100.
The pervaporation of water through the membrane induces a compensating flow from the reservoir
to the tip of the channel. Thus, at the position x in the microchannel, the water flow rate
Q(x) = hwV(x) is equal to the evaporation rate of the water through the membrane from the tip of
the channel till the position x, Qe(x) = xwVe.