International Journal of Environmental Research and Public Health
ISSN 1660-4601
www.mdpi.com/journal/ijerph
Supplementary Information
Association Study of Genes Associated to Asthma in a Specific
Environment, in an Asthma Familial Collection Located in a
Rural Area Influenced by Different Industries. Int. J. Environ.
Res. Public Health 2012, 9,
2620–2635
Andréanne Morin 1, Jeffrey R. Brook 2, Caroline Duchaine 3 and Catherine Laprise 1,4,*
1 Université du Québec à Chicoutimi, 555 boulevard de l’Université, Saguenay, QC G7H 2B1,
Canada; E-Mail: [email protected]
2 Air Quality Processes Research Section, Environment Canada Dalla Lana School of Public Health,
University of Toronto, 4905 Dufferin St., Toronto, ON M3H 5T4, Canada; E-Mail: [email protected]
3 Institut Universitaire de Cardiologie et Pneumologie de Québec, Hôpital Laval 2725,
Chemin Sainte-Foy, QC G1V 4G5, Canada; E-Mail: [email protected]
4 Community Genomic Medicine Centre, University of Montréal, Chicoutimi University Hospital,
305, Rue Saint-Vallier, C.P. 5006, Saguenay, QC G7H 5H6, Canada
* Author to whom correspondence should be addressed; E-Mail: [email protected];
Tel.: +1-418-545-5011 (ext. 5659); Fax: +1-418-615-1203.
Received: 30 April 2012; in revised form: 22 June 2012 / Accepted: 10 July 2012 / Published: 27 July 2012
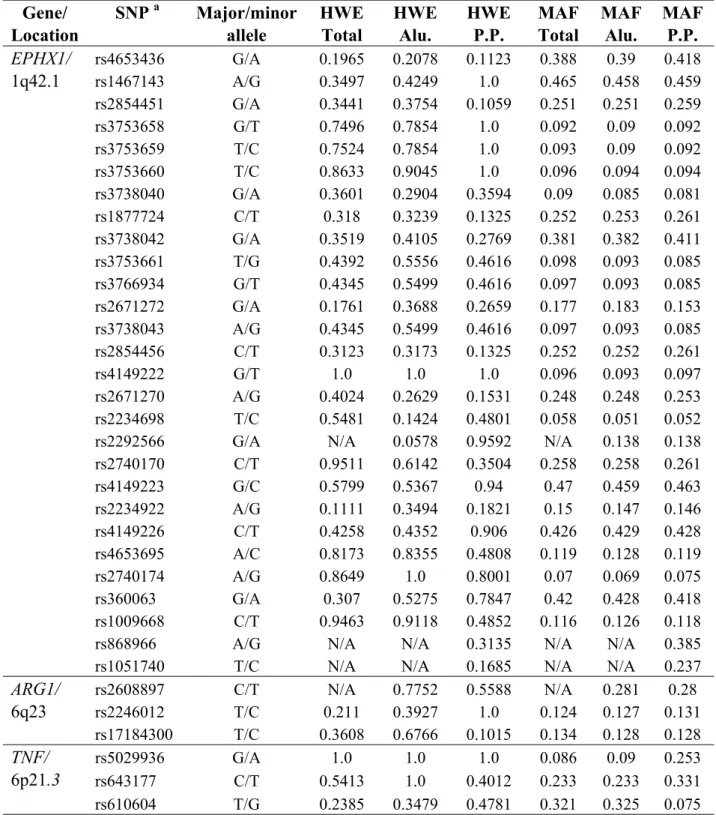
Table 1. Polymorphisms analyzed in this study. Gene/ Location SNP a Major/minor allele HWE Total HWE Alu. HWE P.P. MAF Total MAF Alu. MAF P.P. EPHX1/ 1q42.1 rs4653436 G/A 0.1965 0.2078 0.1123 0.388 0.39 0.418 rs1467143 A/G 0.3497 0.4249 1.0 0.465 0.458 0.459 rs2854451 G/A 0.3441 0.3754 0.1059 0.251 0.251 0.259 rs3753658 G/T 0.7496 0.7854 1.0 0.092 0.09 0.092 rs3753659 T/C 0.7524 0.7854 1.0 0.093 0.09 0.092 rs3753660 T/C 0.8633 0.9045 1.0 0.096 0.094 0.094 rs3738040 G/A 0.3601 0.2904 0.3594 0.09 0.085 0.081 rs1877724 C/T 0.318 0.3239 0.1325 0.252 0.253 0.261 rs3738042 G/A 0.3519 0.4105 0.2769 0.381 0.382 0.411 rs3753661 T/G 0.4392 0.5556 0.4616 0.098 0.093 0.085 rs3766934 G/T 0.4345 0.5499 0.4616 0.097 0.093 0.085 rs2671272 G/A 0.1761 0.3688 0.2659 0.177 0.183 0.153 rs3738043 A/G 0.4345 0.5499 0.4616 0.097 0.093 0.085 rs2854456 C/T 0.3123 0.3173 0.1325 0.252 0.252 0.261 rs4149222 G/T 1.0 1.0 1.0 0.096 0.093 0.097 rs2671270 A/G 0.4024 0.2629 0.1531 0.248 0.248 0.253 rs2234698 T/C 0.5481 0.1424 0.4801 0.058 0.051 0.052 rs2292566 G/A N/A 0.0578 0.9592 N/A 0.138 0.138 rs2740170 C/T 0.9511 0.6142 0.3504 0.258 0.258 0.261 rs4149223 G/C 0.5799 0.5367 0.94 0.47 0.459 0.463 rs2234922 A/G 0.1111 0.3494 0.1821 0.15 0.147 0.146 rs4149226 C/T 0.4258 0.4352 0.906 0.426 0.429 0.428 rs4653695 A/C 0.8173 0.8355 0.4808 0.119 0.128 0.119 rs2740174 A/G 0.8649 1.0 0.8001 0.07 0.069 0.075 rs360063 G/A 0.307 0.5275 0.7847 0.42 0.428 0.418 rs1009668 C/T 0.9463 0.9118 0.4852 0.116 0.126 0.118 rs868966 A/G N/A N/A 0.3135 N/A N/A 0.385 rs1051740 T/C N/A N/A 0.1685 N/A N/A 0.237
ARG1/ 6q23 rs2608897 C/T N/A 0.7752 0.5588 N/A 0.281 0.28 rs2246012 T/C 0.211 0.3927 1.0 0.124 0.127 0.131 rs17184300 T/C 0.3608 0.6766 0.1015 0.134 0.128 0.128 TNF/ 6p21.3 rs5029936 G/A 1.0 1.0 1.0 0.086 0.09 0.253 rs643177 C/T 0.5413 1.0 0.4012 0.233 0.233 0.331 rs610604 T/G 0.2385 0.3479 0.4781 0.321 0.325 0.075
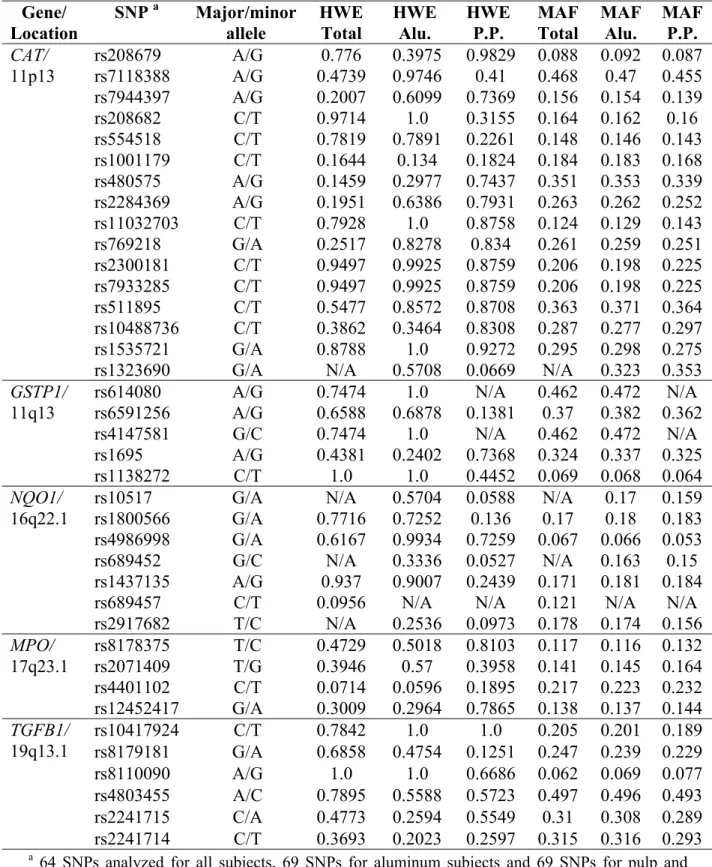
Table 1. Cont. Gene/ Location SNP a Major/minor allele HWE Total HWE Alu. HWE P.P. MAF Total MAF Alu. MAF P.P. CAT/ 11p13 rs208679 A/G 0.776 0.3975 0.9829 0.088 0.092 0.087 rs7118388 A/G 0.4739 0.9746 0.41 0.468 0.47 0.455 rs7944397 A/G 0.2007 0.6099 0.7369 0.156 0.154 0.139 rs208682 C/T 0.9714 1.0 0.3155 0.164 0.162 0.16 rs554518 C/T 0.7819 0.7891 0.2261 0.148 0.146 0.143 rs1001179 C/T 0.1644 0.134 0.1824 0.184 0.183 0.168 rs480575 A/G 0.1459 0.2977 0.7437 0.351 0.353 0.339 rs2284369 A/G 0.1951 0.6386 0.7931 0.263 0.262 0.252 rs11032703 C/T 0.7928 1.0 0.8758 0.124 0.129 0.143 rs769218 G/A 0.2517 0.8278 0.834 0.261 0.259 0.251 rs2300181 C/T 0.9497 0.9925 0.8759 0.206 0.198 0.225 rs7933285 C/T 0.9497 0.9925 0.8759 0.206 0.198 0.225 rs511895 C/T 0.5477 0.8572 0.8708 0.363 0.371 0.364 rs10488736 C/T 0.3862 0.3464 0.8308 0.287 0.277 0.297 rs1535721 G/A 0.8788 1.0 0.9272 0.295 0.298 0.275
rs1323690 G/A N/A 0.5708 0.0669 N/A 0.323 0.353
GSTP1/
11q13
rs614080 A/G 0.7474 1.0 N/A 0.462 0.472 N/A
rs6591256 A/G 0.6588 0.6878 0.1381 0.37 0.382 0.362 rs4147581 G/C 0.7474 1.0 N/A 0.462 0.472 N/A rs1695 A/G 0.4381 0.2402 0.7368 0.324 0.337 0.325 rs1138272 C/T 1.0 1.0 0.4452 0.069 0.068 0.064 NQO1/ 16q22.1
rs10517 G/A N/A 0.5704 0.0588 N/A 0.17 0.159
rs1800566 G/A 0.7716 0.7252 0.136 0.17 0.18 0.183
rs4986998 G/A 0.6167 0.9934 0.7259 0.067 0.066 0.053
rs689452 G/C N/A 0.3336 0.0527 N/A 0.163 0.15
rs1437135 A/G 0.937 0.9007 0.2439 0.171 0.181 0.184
rs689457 C/T 0.0956 N/A N/A 0.121 N/A N/A
rs2917682 T/C N/A 0.2536 0.0973 0.178 0.174 0.156 MPO/ 17q23.1 rs8178375 T/C 0.4729 0.5018 0.8103 0.117 0.116 0.132 rs2071409 T/G 0.3946 0.57 0.3958 0.141 0.145 0.164 rs4401102 C/T 0.0714 0.0596 0.1895 0.217 0.223 0.232 rs12452417 G/A 0.3009 0.2964 0.7865 0.138 0.137 0.144 TGFB1/ 19q13.1 rs10417924 C/T 0.7842 1.0 1.0 0.205 0.201 0.189 rs8179181 G/A 0.6858 0.4754 0.1251 0.247 0.239 0.229 rs8110090 A/G 1.0 1.0 0.6686 0.062 0.069 0.077 rs4803455 A/C 0.7895 0.5588 0.5723 0.497 0.496 0.493 rs2241715 C/A 0.4773 0.2594 0.5549 0.31 0.308 0.289 rs2241714 C/T 0.3693 0.2023 0.2597 0.315 0.316 0.293
a 64 SNPs analyzed for all subjects, 69 SNPs for aluminum subjects and 69 SNPs for pulp and
paper subjects; Definitions: SNP = single polymorphism nucleotide; HWE = Hardy-Weinberg equilibrium; MAF = minor allele frequency; Alu. = Aluminum industries; P.P. = pulp and paper industries; EPHX1 = Epoxide Hydrolase 1 Microsomal; ARG1 = Arginase; TNF = Tumor Necrosis Factor; CAT = Catalase; GSTP1 = Glutathione S-Transferase pi 1; NQO1 = NAD(P)H Dehydrogenase Quinone 1; MPO = Myeloperoxidase; TGFB1 = Transforming Growth Factor, beta 1; N/A = not analyzed, did not respect the threshold for HWE, MAF or genotyping %.
Table 2. Proportions of individuals living within 10 km radius of different industries. Type of industry Percentage (%) of
individuals c
Type of pollutant produced by the industry d
Aluminium 73.93 PAH, SO2, fluoride, CO, PM2.5, PM10
Pulp and paper 44.59 VOC, PM2.5, PM10, SOx, NOx
Mine a 7.79 PM2.5, PM10e
Wood products 11.80 VOC, PM2.5, PM10, SOx, CO
Others b 2.46 N/A
a Niobium mine; b Milk transformation, iron and steel, petroleum refining, chemicals,
plastic and rubber, etc.; c These data were calculated with the NPRI (National pollutant release inventory) Google Earth software; d This information comes from Environment
Canada [19,20] and NPRI Google Earth tool; e No data available for niobium mines;
PAH = polycyclic aromatic carbon; SO2 = sulfur dioxide; CO = carbon monoxide;
PM = particulate matter; VOC = volatile organic compound; SOx = sulfur oxides;
NOx= nitrogen oxides.
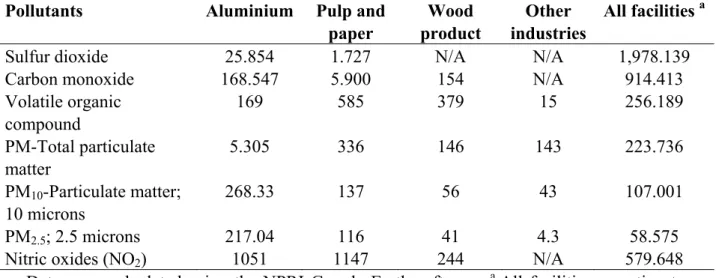
Table 3. Total pollutant emissions in tones from different types of industry located in the
SLSJ area for the year 2002
Pollutants Aluminium Pulp and paper Wood product Other industries All facilities a
Sulfur dioxide 25.854 1.727 N/A N/A 1,978.139
Carbon monoxide 168.547 5.900 154 N/A 914.413
Volatile organic compound 169 585 379 15 256.189 PM-Total particulate matter 5.305 336 146 143 223.736 PM10-Particulate matter; 10 microns 268.33 137 56 43 107.001 PM2.5; 2.5 microns 217.04 116 41 4.3 58.575
Nitric oxides (NO2) 1051 1147 244 N/A 579.648
Data were calculated using the NPRI Google Earth software; a All facilities reporting to the NPRI.
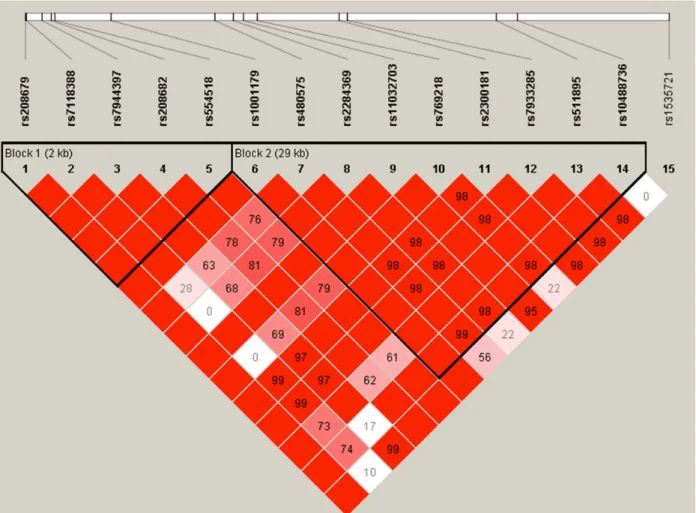
Figure S1. Pairwise linkage disequilibrium pattern of the CAT gene single nucleotide
polymorphisms (SNPs). The location of each SNP on the chromosome is indicated on top. The numbers indicated in the diamonds correspond to the magnitudes of linkage disequilibrium (D’) between the respective pairs of SNPs (for example, the pairwise magnitude of the linkage disequilibrium between rs554518 and rs480575 is 0.76). Diamonds in red without indicated number are in perfect linkage disequilibrium (D’= 1) and the ones that are in white are in equilibrium. Haplotype blocks are indicated by the black triangles. Block 2 is associated with asthma in the SLSJ familial collection.
© 2012 by the authors; licensee MDPI, Basel, Switzerland. This article is an open access article distributed under the terms and conditions of the Creative Commons Attribution license (http://creativecommons.org/licenses/by/3.0/).