HAL Id: hal-01415767
https://hal.inria.fr/hal-01415767
Submitted on 13 Dec 2016
HAL is a multi-disciplinary open access
archive for the deposit and dissemination of
sci-entific research documents, whether they are
pub-lished or not. The documents may come from
teaching and research institutions in France or
abroad, or from public or private research centers.
L’archive ouverte pluridisciplinaire HAL, est
destinée au dépôt et à la diffusion de documents
scientifiques de niveau recherche, publiés ou non,
émanant des établissements d’enseignement et de
recherche français ou étrangers, des laboratoires
publics ou privés.
Collaborative Home Network Troubleshooting
Maximilian Bachl
To cite this version:
Maximilian Bachl. Collaborative Home Network Troubleshooting. Networking and Internet
Architec-ture [cs.NI]. 2016. �hal-01415767�
Collaborative Home Network Troubleshooting
Maximilian Bachl
UPMC
Renata Teixeira
Supervisor Inria ParisTimur Friedman
Supervisor UPMCClaudio Sacchi
Supervisor UNITN
Anna-Kaisa Pietilainen
Advisor Inria ParisABSTRACT
The web browser has emerged as a promising vantage point for measuring the internet edge. Browsers allows for platform-independent measurements on a large variety of platforms such as laptops, smartphones and tablets and they make the usage of measurement utilities easier as web applications do not require installation. In the past browsers’ capabilities for measurements were limited but recent technologies such as WebRTC offer promising new possibilities. In this the-sis, first, various web technologies are tested for their fea-sibility for delay measurements to targets such as the home router, Internet servers and other devices in the home net-work. Second, the most suitable technologies with the low-est overheads are used to create a prototype of a web based measurement tool which utilizes collaboration between end user devices in the home and lets them perform delay mea-surements together. After performing a measurement, the utility evaluates the quality of the wireless connection to the home router and gives the user feedback about the user’s de-vices’ Internet connectivity.
1.
INTRODUCTION
The internet edge has flourished with the spread of mobile devices and of broadband connectivity to homes, and it is getting even more diverse with many Internet-of-Things devices. With such growth and diversity come the complexity of monitoring and management. Get-ting vantage points to measure the internet edge is a challenge as we must often instrument end devices. First, installing and running measurement software on end de-vices requires cooperation, and sometimes considerable technical sophistication, from users. Second, the di-versity of device operating systems and configurations brings a number of practical issues to develop portable measurement tools.
To address these challenges, a number of tools to mea-sure the internet edge run from within web browsers (for example, Ookla’s Speedtest). Running a measurement tool by the click of an URL is simple enough even for unsophisticated users and the browser abstracts a lot of the complexity of porting software to different systems. The first part of the thesis (§2) focusses on
examin-ing different well-established and new web technologies and their feasibility for performing delay measurements. For this evaluation various measurement methods are tested on different source platforms which means differ-ent web browsers and differdiffer-ent operating systems. Be-sides varying the source platform, the evaluation also investigates measurement methods to different targets (e.g. the home router or a measurement server in the Internet). The results give insight about the most suit-able measurement method for each browser, operating system and type of target.
In the second part (§3) the results from this evalua-tion are used to develop a collaborative home network troubleshooting web page. The vision of this tool is that users visit it in case they encounter Internet con-nectivity problems or also when everything works as ex-pected because they are curious about their home net-work setup and their individual devices’ performance. When the user has loaded the page he clicks on a but-ton to initiate the measurement. The web page con-nects to other devices in the household and performs various measurements to the home router, the Inter-net and peer devices in the home Inter-network. After a few seconds, when the measurements are finished, the user sees a graph which visualizes the quality of the connec-tion between the devices in the home network and the Internet.
The main challenge of developing this troubleshoot-ing web page is to find a good set of metrics which reliably indicate network quality based on the results of the delay measurements. For achieving this, two dif-ferent methods are proposed such as a simple approach which estimates connection quality by ranking the mea-surement results comparing to other users’ results and a statistical approach.
1.1
Related Work
Our work is motivated by the need to measure from within the internet edge. A number of previous works have recognized the need for measurement platforms to better cover the internet edge, starting from Satellite-Lab [6], which aimed at extending PlanetSatellite-Lab, a global platform for network tests, to include nodes in edge
net-works. Since then, the networking research and opera-tions communities have deployed a number of systems and platforms to launch measurements from the inter-net edge. Some groups distribute hardware that users then connect to edge networks—popular examples are RIPE Atlas [17] and BISmark [18]; others rely on soft-ware that users install directly on their end systems, for example, the Fathom Firefox extension [5] and the Dasu BitTorrent plugin [19]. Many of these systems use M-Lab [1] servers as targets because they are well-provisioned and connected to multiple locations in the Internet.
Running measurement scripts directly from browsers as we evaluate in this paper eliminates the need to deploy measurement hardware or install measurement software. Hence, a number of tools for users to test their Internet performance take this approach, for instance, Ookla’s speedtest [14], NDT [4], and Netlyzr [11].
Despite its promises, running measurement tasks from browsers is far from trivial. Browsers have a limited API, which prevents the execution of many desirable measurements (for example, a simple traceroute is not possible from within a plain web browser). The Fathom Firefox extension [5] addresses this issue by providing an API for in-page Javascript to perform common net-work measurement tasks, but unfortunately we can-not yet assume that Fathom’s measurement API will be widely available. Moreover, previous studies have shown that browsers introduce variable overheads that degrade measurement accuracy [12]. In some cases, this overhead may dwarf the value we are trying to infer (e.g., when estimating delays within a home network).
To our knowledge, all existing web based measure-ment methods can only inform their users about their Internet connection speed as a whole, from the client device to the measurement server. However, they do not communicate to the user if there is actually one specific component, such as the wireless connection to the router, which is the reason for suboptimal Internet speed.
2.
APPRAISING BROWSER BASED
METH-ODS TO MEASURE DELAY
In this section we examine the potential to leverage web browsers as a vantage point to measure from the internet edge. As a first step, we focus on evaluat-ing browsers when measurevaluat-ing round-trip times (RTTs), which is the basis for a number of common measure-ment tasks.
We assume unmodified browsers without Fathom or any other add-ons to increase the chances of reaching a larger number of users. Edge networks are often behind NATs and it is desirable to enable measurements both to arbitrary servers connected to the Internet and to devices in the local network (either other end devices
or the gateway router).
Li et al. [12] as well as Gavaletz et al. [?] evalu-ated the feasibility of performing delay measurements in browsers comparing a large variety of web technolo-gies, some plug-in based ones like Java and Flash but also native ones such as AJAX and WebSockets. How-ever, since their publication browsers and web tech-nologies have advanced significantly. First, we reap-praise their results in view of recent advances in web technology (§2.3). In particular, Flash and Java are no longer enabled in many browsers by default and newer protocols such as WebRTC and WebSockets are starting to see wide adoption. In addition, all mod-ern browsers support high resolution time APIs (us-ing window.performance.now) mak(us-ing accurate (up to microsecond resolution) measurements in the browser possible. We report on a set of controlled experiments (described in§2.2) where we measure the accuracy and overheads of RTT measurements from the most popu-lar browsers (Chrome, Firefox) and operating systems (Linux, OS X, Windows). We compare several methods to measure RTTs (described in§2.1) including Ajax re-quests, WebSocket, and WebRTC DataChannel. Sec-ond, in our controlled experiments, RTT measurements to arbitrary targets are performed—the typical case of servers in the Internet (§2.3) but also the gateway router and other end devices inside the local network (§2.4). We consider two cases for each target: cooperative and non-cooperative. A cooperative target is one where we can install software or about which we have other in-formation (e.g. knowledge of an accessible URL). We assume no control of non-cooperative targets.
2.1
Delay Measurement Methods
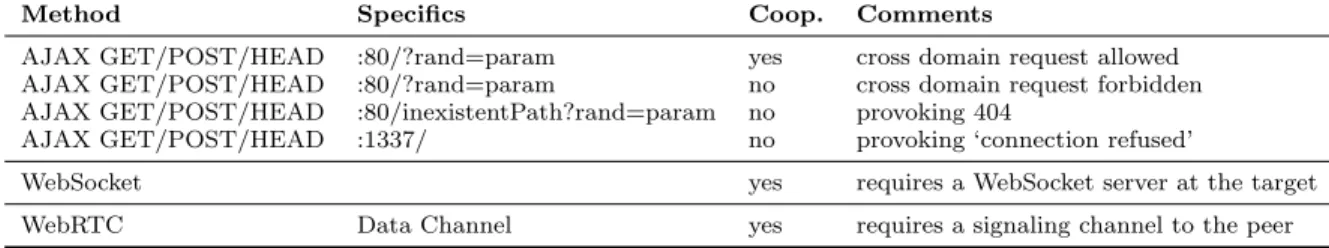
In this section we describe the three main methods for measuring RTT from the browser that we consider in this paper. The basic idea is to leverage the stan-dard javascript APIs to send small beacons between the measurement client, i.e. a browser executing javascript code embedded in a web page, and an arbitrary target in the local network or in the Internet. A single round-trip-time is measured as the delay between the bea-con and the response. For precise timings, we rely on window.performance.now javascript API method that provides high-resolution timestamps with microsecond accuracy. Because the first measurement of any method can include the delay of connection setup (e.g. TCP handshake), we always run two measurements at an in-terval of 200 ms and discard the first result. Suitable javascript APIs include AJAX (XmlHttpRequest) [23], WebSocket [22] and WebRTC [21]. We present each API and how they can be used for network delay mea-surements in the following subsections. Table 1 provides a summary of the methods.
Method Specifics Coop. Comments
AJAX GET/POST/HEAD :80/?rand=param yes cross domain request allowed AJAX GET/POST/HEAD :80/?rand=param no cross domain request forbidden AJAX GET/POST/HEAD :80/inexistentPath?rand=param no provoking 404
AJAX GET/POST/HEAD :1337/ no provoking ‘connection refused’
WebSocket yes requires a WebSocket server at the target WebRTC Data Channel yes requires a signaling channel to the peer
Table 1: Delay measurement methods overview.
XMLHttpRequest (also known as AJAX request) is a javascript API that provides functionality for transfer-ring data between a client (a web page) and a server. Despite its name, XMLHttpRequest can be used to re-trieve any type of data, not just XML and it fetches the data using HTTP. The API is simple: a client creates an XMLHttpRequest object, and calls open to initial-ize the request—with the target URL and the HTTP method (HEAD, GET, POST)—and send to send the request including optional data in the HTTP request body. HTTP HEAD requests the HTTP headers of the target URL, GET will fetch the complete URL re-source, and POST will send data to the URL triggering a HTTP response from the target.
Internally, the browser makes a TCP connection to the target (or reuses an existing connection if available), sends the HTTP request to the target web server, and parses the HTTP response for the client. The client re-ceives response objects via an asynchronous event han-dler callback. We must be careful not to receive cached replies either from the browser or some proxy on the path. A standard technique to avoid this is to add a random URL parameter to each request URL.
AJAX requests are subject to the browser’s same-origin security policy, which restricts how a document or script loaded from one origin can interact with a re-source from another origin. In particular, we cannot make AJAX requests to cross-origin targets (i.e. to origins other than the one where the javascript mak-ing the request comes from). Alternatively, web servers can allow cross-origin requests using Cross-Origin Re-source Sharing (CORS) mechanism [20]. CORS gives web servers cross-domain access controls, which enable secure cross-domain data transfers.
Measuring delay to cooperating target. In this
scenario, we assume that the target is running a web server that is either the script origin (same-origin re-quest) or it has configured cross-origin access with CORS. In this case, we can measure the round-trip-time as ex-plained above.
Measuring delay to non-cooperating target. We
consider two cases in this scenario: the target is running a web server or not at the requested port. In the first case, two things can happen: (i) the target does not
al-low cross-origin access, the AJAX request returns with an error message after the (optional) TCP connection setup and a single HTTP request-response exchange; or (ii) the target allows cross-origin request but the re-quested resource does not exist, in which case the AJAX request results in 404 error response after the connec-tion setup (opconnec-tional) and the HTTP request-response. In both cases, we can measure the round-trip-time as the time from the request to the error response, and as above make two requests and use the latter to be sure to factor out the TCP handshake time. Finally, we can also make AJAX requests to targets at arbitrary ports where no web server is running. These requests will fail at the TCP connection setup phase. In this case, we can use the delay to connection error as the RTT mea-surement (at the transport level in this case, the initial TCP SYN packet from the client triggers a TCP RST from a well-behaving target host). However, when using arbitrary ports in the target URLs, the connection may be dropped by a filtering firewall, so this method may not be able to reach arbitrary targets in the Internet.
2.1.2
WebSocket
The WebSocket API enables two-way communication between a client and a cooperating target server. The WebSocket protocol consists of an opening handshake over HTTP followed by basic message framing, layered directly on top of TCP.
Measuring delay to cooperating target. The cooperating target is expected to run WebSocket server code1 at the requested URL and is expected to allow requests. The client initiates a WebSocket connection object with the target server URL, and uses the send method to send arbitrary messages to the server. Re-sponses are received via asynchronous event handler callbacks at the client.
2.1.3
WebRTC
The latest addition to the browser networking APIs is WebRTC (Web Real-Time Communications), which is a technology that enables Web applications and sites
1
Major HTTP servers such as Apache or NGINX support the WebSocket handshake negotiation and there exists sev-eral server side implementations for handling the requests including one for node.js that we use in our experiments.
to capture and optionally stream audio and/or video media, as well as to exchange arbitrary data between browsers without requiring an intermediary. The peer-to-peer connections between two browser clients can be made using the RTCDataChannel javascript inter-face that represents a bi-directional data channel be-tween two peers of a connection. WebRTC DataChan-nels provide packet-oriented transmission of data over SCTP [9] encapsulated in DTLS [8] over UDP. Hence, a great advantage of this method over the other tech-nologies discussed above is the fact that DataChannels allow for unordered and unreliable transmissions which makes it a good candidate for RTT measurements (e.g. avoids inadvertently including TCP retransmissions in the measurements).
Measuring delay to cooperating target. Both
clients that want to establish a WebRTC connection have to be able to communicate over a signalling chan-nel. While the protocol for this signalling channel is not mandated by the specification, usually – and also in our experiment – WebSockets are used. After establishing a connection, the signalling channel is not needed any-more and the participants communicate directly over WebRTC using a JavaScript interface that closely re-sembles the one of WebSockets.
2.2
Experimental Setup
In this section we describe our testbed setup to evalu-ate the usability and accuracy of the various RTT mea-surement methods. All the methods incur some proto-col overhead, and the APIs are based on asynchronous methods and callbacks running on top of a garbage col-lected javascript engine. Thus the main goal of our con-trolled experiments is to understand these overheads on various operating system and browsers. In addition, we are interested in measuring not only delays towards ar-bitrary servers in the Internet, but also local targets. Typical delays inside a local network are in order of milliseconds or less, hence the delay measurements will only be useful if the overheads are small enough.
Figure 1: The testbed setup.
Figure 1 overviews our testbed. The measurement
client is a PC running Ubuntu 14.04, OS X El Capitan or Windows 10 with Google Chrome 50 or Mozilla Fire-fox 45. Internet Explorer and Safari are excluded due to lack of WebRTC DataChannel support and Opera due to its marginal popularity.
The measurement client is connected over 100 Mbit/s ethernet to the home router which is a NETGEAR WNDR3700v2 running OpenWRT 15.05. The peer de-vice in the local network is Google Chrome 50 on OS X with 100 Mbit/s ethernet connection to the home router. Finally, the setup has a single controlled In-ternet server which is a OS X computer connected to the home router over 100 Mbit/s ethernet. To emulate a wide-area link, we place another NETGEAR device acting as a switch between the Internet server and the home router, and use netem to introduce a fixed 25ms delay in both directions (creating an RTT of 50ms be-tween the home router and the Internet server).
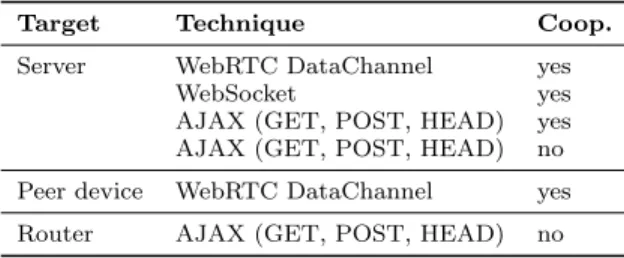
Target Technique Coop. Server WebRTC DataChannel yes
WebSocket yes AJAX (GET, POST, HEAD) yes AJAX (GET, POST, HEAD) no Peer device WebRTC DataChannel yes Router AJAX (GET, POST, HEAD) no
Table 2: Measurement methods per target.
We have different RTT measurement methods avail-able per target as we summarize in Tavail-able 2. The Inter-net server runs Apache as a web server and it serves a small one-word document to all the HTTP-based mea-surement methods. Similarly, we implement a minimal WebSocket server on top of node.js [13] and use Google Chrome for the WebRTC based experiments. Inside the local network we experiment with WebRTC be-tween the measurement client and the peer device, and the non-cooperative AJAX methods to probe the home router. Note that we could use the non-cooperative AJAX methods to probe any device in the local net-work, but due to similar rounds-trip-times both to the router and the peer device, we do not repeat the AJAX measurements to the peer device. We did also consider the cooperative router case for AJAX but as we will see in the following sections the non-cooperative AJAX methods offer superior performance.
OS Router Other device Server
OS X [0.2, 0.4, 0.9] [0.3, 0.6, 1.0] [50.4, 50.8, 52.6] Ubuntu [0.2, 0.2, 0.4] [0.3, 0.6, 2.1] [50.2, 50.5, 51.3] Win. [0.3, 0.8, 1.2] [0.5, 0.9, 1.4] [50.5, 51.2, 51.7]
Table 3: Range [min, median, max] of ICMP ping delays (in ms) for each OS in ms.
(OS + browser, six combinations) executes the surements in rounds where we perform an RTT mea-surement using each available method to the three tar-gets (24 method + target combinations in total). We repeat each measurement round 50 times. At the same time of each measurement, we also execute ICMP ping which serve as a baseline. We use the native ping utility on OS X and Linux. However, because Windows’ na-tive ping only has millisecond accuracy, we used True Ping [3] on Windows. The baseline RTTs are stable and in expected ranges as we show in Table 3.
In the basic experiments we only have a single tab open with a simple empty web page and the embed-ded javascript code for the measurements. We also test the delay measurements under passive browsing load by opening the 10 most popular web sites in France ac-cording to the Alexa ranking [2] in background tabs. Our results show that adding load adds variation to the distributions of measurement overhead, but does not impact the conclusions, so we omit them from this pa-per.
2.3
Internet Delays
In this section we discuss the performance of the browser based delay measurement methods towards In-ternet targets. This section is partly a reappraisal of the work by Li et al. [12] with respect to the coopera-tive AJAX GET and WebSocket methods. We add the analysis of WebRTC, comparison between additional AJAX methods and AJAX based measurements to non-cooperating targets. In addition, all our results are based on the high-resolution time API that was not available at the time of the previous study.
The basic metric we use throughout the section is the
delay overhead that we define as the difference between
the native ICMP ping measurement and the studied de-lay measurement method performed at the same time. As discussed before, this overhead accounts for the pro-tocol overhead and any additional delays caused by the browser and its javascript engine. In general, we are after method(s) with low and/or constant delay over-head.
2.3.1
Cooperating Target
We plot in Figure 2 the delay overhead of the various cooperative measurement methods (the depicted results are from OS X with Chrome, the results are similar for Firefox and other operating systems). The WebSocket method results in the lowest overheads, below 3ms, con-firming the findings of Li et al. [12]. However, while the WebSocket method generally has a low overhead, we observe a small number of measurements with sig-nificantly higher overheads up to 20ms. These occur across all OS and browsers and a further inspection of packet traces reveal that these outliers are not caused
Figure 2: Delay overheads when measuring a cooperating Internet target (OS X/Chrome).
by delays in the client browser but rather by a process-ing delay of up to 20 ms in the WebSocket echo server. These findings are unexpected as our WebSocket server is extremely simple and leverages a widely used library but should be nevertheless taken into account if using WebSockets for delay measurements. Interestingly, the WebRTC method shows rather good and stable perfor-mance with only in a slightly higher overhead of above 3ms compared to WebSocket. Moreover, the overhead shows little variance making WebRTC a good candidate for delay measurements with cooperating targets.
The AJAX based methods perform clearly worse due to the HTTP protocol overhead (larger payloads and request + response parsing) and the delay overheads are between 7-9ms in the median case. We compare the HTTP GET, POST and HEAD methods in Figure 2, and observe that POST and HEAD are somewhat bet-ter than GET (usually below 8ms overhead compared to more than 8ms), and that POST has additionally lower variance making it the best AJAX based method for delay measurements.
2.3.2
Non-cooperating Target
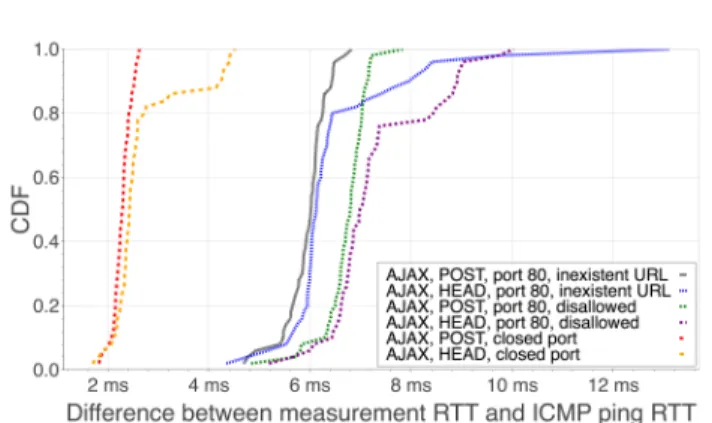
Figure 3: Delay overheads to an uncooperative Internet target using AJAX (OS X/Chrome).
AJAX methods (inexisting URL, unallowed cross-origin request and a request to a closed port). We exclude HTTP GET as similarly to the cooperative case it per-forms generally worse than HEAD and POST. An AJAX request to a closed port shows the lowest overhead of around 2ms and is comparable, or even better in perfor-mance than the best cooperating methods (WebSocket and WebRTC). The invalid cross-origin request and ac-cess to non-existing resource have similar overhead, the former being slightly worse with around 7ms overhead in general. As in the cooperating server case, the re-quest type has an impact on the overheads: POST has a slightly lower overhead than HEAD and similarly, POST has less variation in its overhead. Note also that the overhead from error response is smaller than the overhead when fetching an existing resource (order of 1ms). These results are similar for Firefox and across the operating systems.
Figure 4: Delay overheads to an Internet server on a closed port (Ubuntu/Firefox, Chrome).
The AJAX request to a closed port seems attractive method for delay measurements. However, in practice it may be unusable due to the firewall problems dis-cussed before. Even if the firewalls are not an issue, we observe another problem with the method. Namely, when requesting a page from a closed port on Firefox, the request does not always immediately return an er-ror to our measurement code (Figure 4). The packet traces reveal that when Firefox gets an error after try-ing to contact a closed port, it retries up to three times and raises the error all the attempts failed. Further-more, the method of sending AJAX requests to closed ports only works from an OS X or Linux host. Win-dows never immediately reports the connection refused error to an application upon receiving a RST packet but instead retries several times before quitting the connec-tion attempt [15], which makes this method unusable on Windows.
2.4
Local Network Delays
In this section we focus on the local network delay measurements. The big challenge in measuring the
de-lays in the local network is the overhead that in many cases is in the same order as the actual network delays.
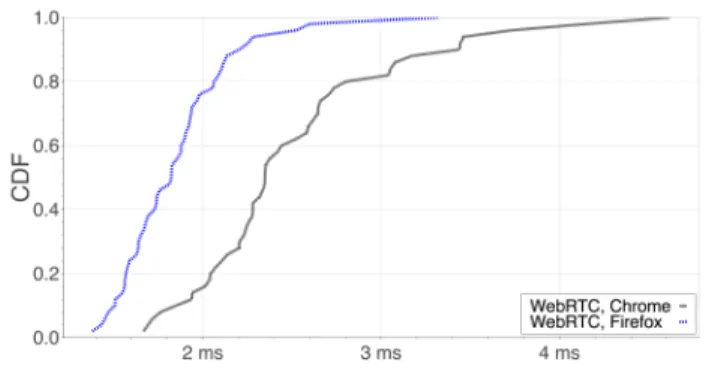
Figure 5: Delay overheads of WebRTC in local network (OS X/Chrome, Firefox).
We measure the delays to a peer device in the same local network using WebRTC and the results for OS X are shown in Figure 5. The delay overhead is similar to the Internet server case discussed earlier, below 3ms for 80% of the time for Chrome, and below 2ms for 80% for Firefox.
Figure 6: Delay overheads to a home router (OS X/Chrome, Firefox).
For the home router, we test various AJAX based methods. Figure 6 compares the methods with the low-est overhead for Chrome and Firefox which is the var-ious AJAX requests to a closed port (i.e. we are ba-sically measuring the TCP handshake delay). There is some variation between the different methods due to browser processing. This difference is particular large for Chrome. In general, the overhead is around 2ms for Firefox, and around 4ms for Chrome.
Considering that the baseline delay of our local net-work setup is less than 1ms, the overheads for both peer device and router delay measurements are still high. However, our setup is basically testing the worst case as we connect everything via ethernet. Typical home networks are using mostly wireless connections, and es-pecially in case of trouble, the wireless delays can be in
the order of several tens of milliseconds.
2.5
Conclusion
In this part, we explored the potential of using the web browser as a vantage point to measure RTTs from edge networks. We first consider the case when the target is a cooperating server connected to the Inter-net. Our results confirm previous findings that in most cases WebSocket have the lowest overhead. WebSocket, however, sometimes introduce significant overhead (of 20 ms) making it an unreliable method to measure RTTs. Our experiments with WebRTC presented overheads that are only slightly higher than that of WebSocket but very consistent; making it the best choice for measuring Internet delays to cooperating targets. Then we consid-ered the case when measuring Internet delays to non-cooperating targets. We saw that opening an AJAX connection to a closed port introduces the lowest over-head, but it is not reliable on Firefox and on Windows. An alternative is to use AJAX to an inexistent URL. Fi-nally, we considered cases where targets are in the local network. Both WebRTC between devices and AJAX to a closed port work well, but they introduce overheads around 2–4 ms. This is particularly challenging as the delays within local networks are in the same order as the measurement overhead browsers introduce.
3.
WEB BASED HOME NETWORK
TROU-BLESHOOTING
After having evaluated which web technologies are suitable for delay measurements in which contexts, the next step is to find a way to utilize these methods to measure users’ home networks effectively and provide them with easily understandable feedback.
3.1
Objectives of a web based measurement
tool
First, it is necessary to define the specific goals of the web based measurement utility. The tool should perform a set of measurements to find out if there are bottlenecks in a user’s home network such as
1. a slow connection of a device to the home router (possible because of long distance too the router, interference etc.)
2. limited hardware performance impairs the mea-surement process and/or reduces available Inter-net speed
As part of this thesis a prototype of a web page was developed which performs measurements and gives the user feedback about the performance of the user’s end devices and the speed of the connection of each device to the home router.
3.2
Workings of the prototype
When users want to measure their Internet connec-tivity they
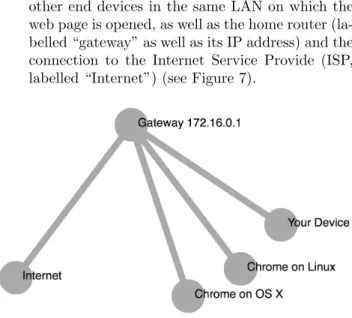
1. visit the measurement web page in their browser, which features a button labeled “start measure-ment”. The page shows a graph which depicts all other end devices in the same LAN on which the web page is opened, as well as the home router (la-belled “gateway” as well as its IP address) and the connection to the Internet Service Provide (ISP, labelled “Internet”) (see Figure 7).
Figure 7: The visualization of the home network.
2. press the button which launches the measurement 3. see the results after several seconds when the mea-surements are finished and evaluated (see Figure 8). The prototype has two different kinds of visualiza-tions, which use a continuous color from green over yellow and orange to red to indicate performance, where red means very bad performance and green means very good performance.
Figure 8: The visualization of the performance in the home network.
(a) The colored circle around each end device in-dicates the devices’s performance and whether the device itself limits the network performance (e.g. because the device is overloaded with other tasks)
(b) The colored line which connects each end de-vice with the home router indicates the per-formance of the connection to the home router In the example in Figure 8 there are three end devices connected to the measurement web page in the LAN. The device named “Your Device” in-dicates the device from which the user starts the measurement. Due to security reasons, JavaScript cannot retrieve the name of the computer on which a web page runs and so instead the name of the web browser and the name of the operating system are chosen as approximate identifiers for the other end devices in the network (e.g. “Chrome on OS X” means that on this end device the measurement web page is opened using Google Chrome running on OS X).
3.3
Technical implementation
A novelty of the prototype is its usage of WebRTC which allows a web page’s JavaScript running on one machine to connect to any other web page running on another machine directly, if both parties are willing to establish the connection. To use WebRTC to allow a newly opened instance of the web page to connect to other existing instances of the measurement web page in the home network, first, the server, from which the measurement page was loaded, has to inform each in-stance of the web page first about the existence and address of the other instances in the home network.
3.3.1
Determining clients which are in the same home
network
To notify the new instance of the webpage in a home network about the other instances, the server first has to determine which instances of the measurement web page are actually colocated in the same home network. For determining whether two clients are in the same home network, there are two cases depending on whether the clients have IPv4 or IPv6 addresses.
IPv4.
When the server sees that the measurement webpage is opened several times from the same IPv4 address it can mean that (i) the web page is opened several times on the same machine or (ii) that it is opened on different machines behind a Network Address Translator (NAT) or (iii) it is a combination of both, e.g. the web page is opened one time on machine A and two times on machine B. Irrespective of the case which applies, the web page is always opened in the same network when it
is accessed several times from one IPv4 address. Thus, when several instances of the measurement web page share the same IP address it means that they are in the same home network.
IPv6.
Private end-users get /64 IPv6 subnets assigned by their residential ISP [16] and all end devices in a clients home network get assigned an IP address in the cus-tomer’s /64 network. Thus, similar to the case of IPv4, if the measurement webpage is opened several times from within one /64 prefix and it belongs to a residen-tial ISP, it can be assumed that the webpage is opened several times in the same LAN.
3.3.2
Establishing WebRTC connections
When the server has determined all other instances of the web page opened in the same home network, it informs the new instance about the other instances and the new instance starts to set up the WebRTC connec-tion.
To set up a WebRTC connection between two clients, they must be able to communicate over a so-called “sig-naling channel”, over which the clients can exchange in-formation about their available IP addresses and other parameters of the prospective WebRTC connection. For the signaling channel we use WebSocket connections, which each instance of the web page maintains to the server. A client can send a message to another client in the same home network by sending it to the server which relays it to the client, which the message is addressed to. When the WebRTC connection is established, the clients set up a WebRTC DataChannel using the exist-ing WebRTC connection [10]. We choose to configure the DataChannel for unreliable and unordered trans-mission to be able to observer the number of lost packets and to make the DataChannel as transparent as possi-ble (for more information about the DataChannel see
§2.1.3).
3.3.3
Determining the home router’s IP address
Before starting a measurement, the clients must know the IP address of the home router because it is one of the measurement targets.
IPv4.
When clients in the network have IPv4 addresses, this usually means that the router uses DHCPv4 to allocate addresses and also has an IPv4 address itself. Usually one of the IP address spaces reserved for private usage is used (defined by the IEFT [7]). By using WebRTC, all end devices in the network are able to retrieve their own private IP address in the network and the ones of all other peers. From the IP addresses of the devices in the network it is possible to deduce the subnet
ad-dress which is used in the network. Commonly, home routers use the first available IP address in the sub-net, so the router’s IP address can be retrieved as being the first IP address in the subnet of the home network. In case the router does not use the first available ad-dress, it is possible to probe all IP addresses (in home networks commonly 254 available addresses) and check whether an HTTP server is running on port 80 of any of the available addresses, because home routers usu-ally have configuration interfaces which are ran as web servers. Of course, also another device in the home net-work could run an HTTP server on port 80, however, it is not very likely for residential customers to have web servers running on their machines. The method to determine a router’s IPv4 address is an heuristic and does not work for all possible configurations, however, it works for most common home network configurations. As an example, if the router uses 192.168.0.0/24 (254 available IP addresses) as the network from which it signs the IP addresses, the other devices would get as-signed IP address like 192.168.0.25 and 192.168.0.124. When a device knows the IP addresses of the other devices it can assume that the router’s IP address is 192.168.0.1, the first available IP address in the subnet. To check whether the assumption is true, one can try to contact the home router to determine whether a ma-chine exists at the given IP address and one can try to access the router’s HTTP interface at port 80.
IPv6.
If the client’s network uses IPv6, NAT is usually not deployed [24]. In this case the server can run a tracer-oute to the client which will determine all the IP ad-dresses on the way to the client, including the router’s IP address. The router’s IP address is then the first one encountered with traceroute, which is in the same /64 network as the client. It might be the case that the router utilizes a firewall to limit filter incoming ICMP packets destined for clients in the home network. How-ever, this case is irrelevant as only the trace of IP ad-dresses up to the router is relevant and it is not nec-essary that we can actually reach the client itself with the traceroute. Home routers have two IP addresses, one external one for their connection to the ISP and one internal one for the Wi-Fi interface over which the clients in the household are connected. This method retrieves only the external IP address because this is the only one which the server can see using traceroute. However, basically it doesn’t matter which of the two IP addresses the client use as their measurement target.
3.3.4
The measurement process
When the measurement web page is connected to all the other instances of the web page in the same network and the IP address of the router has been determined,
measurements can be started.
1. When the user pushes the “Run measurement” button, the measurement process is launched. 2. The instance of the measurement web page
pre-pares the request for measurement and randomly schedules all the instances in the home network to perform their measurements during different time intervals so that the measurements of the different instances do not interfere with each other. The measurement requests are then sent to each of the other instances in the same home network, includ-ing the instance, which initiated the measurement. 3. Each instance of the measurement web page re-ceives the instructions to perform measurements. They prepare for the measurements and wait for their scheduled time slot to perform measurements. 4. When the scheduled time interval has arrived, the instance of the measurement web page simultane-ously starts three different types of measurements over a duration of 2.5 seconds as a too long mea-surement process could frustrate users. The num-ber of pings is chosen so that it does not overload the hardware and thus bias the measurement re-sults.
• 151 RTT measurements using AJAX POST
to a closed port of the home router
• 151 RTT measurements using AJAX POST
to the closest Measurement Lab server [1]
• 501 RTT measurements using WebRTC to each
of the peer instances of the measurement web page.
Because the first measurement result of a sequence of measurements can be biased (see§2.1), it is not considered for evaluation but dropped.
When all peers are finished with the measurements they transmit the results to the instance of the web page which started the measurement process. Alongside the result the also send information about the operating system and the browser.
5. The initializing peer receives the measurement re-sults, aggregates them and transmits the results to the server for more detailed evaluation. 6. Upon receiving the data and the information
re-garding the browser and the OS, the server saves it in a database, evaluates the results (see§3.4) and sends them back to the client which initialized the measurement.
7. The client receives the evaluated results and graph-ically displays the results (see§3.2).
3.4
Performance assessment methods
When the server receives all the collected data of a measurement, it has to apply algorithms which estimate the performance of the links of each peer to the home router and which determine whether the devices them-selves do not have sufficient performance to execute the measurements (see§3.1).
3.4.1
Comparative approach
The fundamental logic of the comparative approach is that if a user’s measurements were worse than the ones of most other users, then quality is estimated to be bad.
For this, the results of a user’s measurements are com-pared to other users’ results which were previously mea-sured by Fathom and stored in a database. Fathom’s dataset is used for comparison as it includes a vast and constantly growing number of measurement results. The data is filtered to only include measurements ob-tained over Wi-Fi connections because browser mea-surements performed over Wi-Fi cannot be compared to Fathom measurements done over Ethernet. However, it is not inherently necessary to depend on Fathom. In the future, when more data will have been collected us-ing the measurement tool proposed in this thesis, also this data can be used for comparison.
To avoid that measurements to the three different targets influence each other, the measurements are ex-ecuted in random order. For example, 151 RTT mea-surements to the router are executed in 2.5s, and so the interval between the measurements is 2.5s/151 = 16.56ms. Each measurement is executed at a random time in this interval. The measurements to the device itself and the server are executed in the same timespan as the measurements to the router, but because of the randomness of their execution they cannot systemati-cally influence each other.
Because each measurement yields several datasets of results, a simplified notation is used in the following paragraphs: For example mrrefers to the measurement
results to the r outer. fl refers to all the measurement
results from the Fathom dataset which targeted the de-vice itself (l for local).
Performance of the link between device and router.
After finishing the measurements, a quality metric called qr is calculated from the measured data which
is then compared to all other users’ previous ments in the Fathom database. Because the measure-ments performed by the measurement web page in the browser using JavaScript suffer from considerable over-head (see §2), but on the other hand Fathom uses na-tive ping for its measurements, the measurement results obtained from browser based measurements cannot di-rectly be compared with Fathom’s results.
To calculate qr three numbers are taken into
con-sideration: The median RTT measured to the router (median(mr)); the minimum RTT measured to the
de-vice itself (min(ms)), which is assumed to be an
esti-mate of the measurement overhead introduced by the browser; the (min(fl)) minimum RTT to the device
it-self obtained from all data in the Fathom database, which were recorded on the same OS as the one where the measurement was performed. This is necessary as different OS might produce different RTTs to them mea-suring the delays to themselves.
The router link quality metric qris then calculated by
first normalizing the median(mr) by subtracting min(ms)
to remove the overhead introduced by the browser. As a second step, the minimum overhead from the Fathom dataset min(fl) is added to mak the normalized value
comparable to the Fathom data.
qr= median(mr)− min(ml) + min(fl)
The router link quality qr is then percent-ranked in
all the RTTs to Wi-Fi routers ever recorded by Fathom (where the Operating System is the same). The result-ing number is in the range from 0% (which means that
qrreported a lower median RTT than all measurements
in the Fathom database) to 100% (all measurements in the database had lower RTTs than our current mea-surement) where 0% is green and 100% is red.
Performance of device itself.
Besides the possibility that the connection to the home router suffers from inadequate performance, there is also the eventuality that the device itself is a perfor-mance bottleneck and Internet speed is decreased be-cause CPU, memory or IO speed are insufficient. Anal-ogously, a device quality metric qlis calculated as
ql= median(ml)− min(ml) + min(fl)
and then ranked in all the Fathom data of measure-ments to the device itself. Also here, only values which were produced on the same OS are considered.
Like for the quality to the router, it is not strictly nec-essary to use Fathom’s data as a reference, but also the data retrieved by the Web based measurement tool it-self could be used. However, Fathom has a large amount of data collected “in the wild” already which makes it ideal for comparisons.
3.4.2
Statistical approaches
While the comparative approach is very simple and delivers good results when it can make use of a large reference database, it also has some limitations.
• While it is possible to use a sufficiently large
prob-lem that the population of households which con-tribute with their measurements to the Fathom database should have similar characteristics when compared to the population which performs the measurements with the browser based tool. It is likely that people who use Fathom are technically more versed than the general population and it might follow that they have Internet connections of different speed than the general population.
• If, on the other side, the data from users of the web
measurement page itself is used, there might be a bias because people use troubleshooting tools often in case there is a problem (unlike Fathom which constantly measures in the background). Thus the database might fill with a too large proportion of “bad” measurement results which might distort re-sults
• As technology advances, Internet speeds increase
and possibly RTTs decrease too. It might be a problem if, for example, a measurement performed in 5 years would be compared to data retrieved in 2016 as Internet speeds in 2016 are probably significantly lower than in 2021.
• RTTs are different for each browser and OS. Thus
in a database the browser and OS which contributed each result must be noted. This makes data collec-tion and comparability difficult. Also the fact that the OS and browser landscape changes over time shows the limitations of using a database. Fur-thermore, the question remains if it is possible to compare OS and browser different versions with each other or not.
From these limitations it follows that it might be preferable to use an approach which is independent of an external database because it ensures that the web based measurement tool will work equally well on all OS and browsers and also will not produce distorted results due to possible issues with the reference data. Furthermore, as it does not use a reference database, the overheads added by the browser are not so critical anymore, since the data is only compared to data from the same browser itself, not to other results.
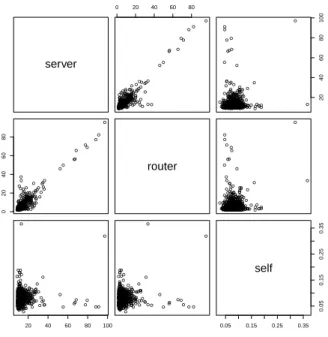
The concept behind the statistical approach is to per-form repeated measurements to three targets: an Inter-net server, the home router and the device itself. In each measurement round RTT measurements to the three targets are performed at exactly the same time. After a sufficiently large number of successful measurements, linear regression is used to determine whether the RTT measured to the router and to the device itself influ-ences the RTT to the Internet server. The coefficient
of determination (also known as r2), which is a number ranging from 0 to 1, is then used to assess how much
the connection to the router and potential performance issues in the device itself are impairing the Internet con-nection.
Performance of the link between device and router.
To indicate whether the wireless connection is an ac-tual bottleneck, linear regression is performed after the measurements are finished and r2 is inspected. In case
r2 is 1.0 it would mean that all variance of delay ob-served for the Internet server can be attributed to vari-ances of delays in the home network. This would mean that the wireless delays would fully predict the delays to the server. Intuitively one might think that this hap-pens in the case of a bad wireless connection as then delays in the wireless link highly influence the connec-tion to an Internet server. Conversely, in case of an excellent Wi-Fi connection one would expect the delays to the router and in Internet server to be largely unre-lated.
For visualization, r2 = 0 would be displayed as a green link to the router while r2= 1 would be red.
Performance of device itself.
Just as for the performance of the link to the router, for the performance of the device itself, linear regression is performed between the RTT to the server and the RTT to the device itself. The resulting r2 can then be used for coloring.
3.5
Evaluation
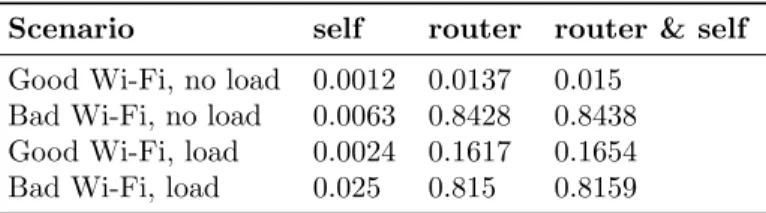
In §3.4.2 we proposed a new method to determine the quality of wireless links based on the hypothesis that delay measurements performed to the device itself, the home router and an Internet server at the same time correlate in case of insufficient device performance or bad wireless connection and that Wi-Fi delays can predict the server delays.
3.5.1
Experimental setup
In order to verify these hypotheses, we conducted a controlled experiment. The two cases of excellent Wi-Fi condition (client placed next to the access point) and bad Wi-Fi connection (client was placed far away from the router with low signal) were tested once under load and once idle.
The home router was connected with a 100 MBit/s connection to the Internet. The server in the Inter-net used for the delay measurements was 5 hops away from the client. The client was a laptop running OS
X. The load was generated using four concurrent
pro-grams which read random data from /dev/urandom and compressed it using bz2.
For all scenarios 1000 measurement rounds to an In-ternet server, the home router and the device itself were performed, every 250ms, using native ICMP ping. Then