Fuel Cell/Supercapacitor Passive Configuration Sizing Approach for vehicular
applications
C. Dépaturea, A. Macíasa,c, A. Jácomeb, L. Boulona, J. Solanob, João P. Trovãoc
a Université du Québec à Trois-Rivières, Hydrogen Research Institute, Trois-Rivières, Quebec, Canada
b Universidad Industrial de Santander – Escuela de Ingenierías Eléctrica, Electrónica y de Telecomunicaciones, Bucaramanga,
Colombia
c e-TESC Laboratory, Dept. Electrical & Computer Engineering, University of Sherbrooke, Sherbrooke, Quebec, Canada Abstract
Active configuration i.e., source coupling via a power converter, is the most common configuration for fuel cell/supercapacitor (FC/SC) vehicles. Passive connection of the FC with the SCs without any converters is an original and less expensive solution to distribute the power among the sources. This passive configuration does not require an energy management strategy. In fact, the power distribution only depends on the FC and SC impedance characteristics. Conventional methods to size the SC follow two criteria: storage capacity and maximum voltage. In this paper, a third criterion is added which is the FC operating current dynamics. This novel sizing methodology reduces the FC degradation and improves the global system efficiency. Experimental results provide validation to the proposed sizing approach. The SCs boost the FC to meet the requirements of the load with a guarantee of system stability reaching higher global performances and less stress to the FC.
Keywords: Energy management, Fuel cell, Passive configuration, Multi-source Sizing, Supercapacitor, Vehicular applications
1. Introduction
In the last decade, there has been a growing interest in fuel cell (FC) vehicles [1, 2]. By using hydrogen (H2), FC vehicles are considered as a promising solution to reduce greenhouse gases for long-range vehicles [3, 4]. However, FC systems offer a limited dynamic. Fast power transients can lead to a gas starvation, which can permanently damage the FC [5, 6]. Furthermore, the energy flow of FC systems is unidirectional, which does not allow recovering braking energy. The literature review of energy storage systems (ESS) presented in [7], shows that the hybridization of ESSs with complementary features copes with the harsh working environment that a single ESS cannot achieve. Thus the coupling of FC with other ESS devices can improve the vehicle performances by handling the power transients, recovering braking energy, extending its lifetime and reducing its cost [8]. The hybrid configurations are classified in mainly in active and passive connection, based on the way that the components are connected to the DC bus [9]. Active configurations use at least one converter to combine the sources. Like the case of Toyota Mirai and Hyundai Tucson that have an active FC/battery configuration, using Ni-Mh and Li-Poly battery packs, respectively [10]. Honda has chosen an active fuel cell/supercapacitor (FC/SC) configuration to supply fast power dynamic of the vehicle in its 2002 FCX. However, the new 2014 FCX Clarity uses a FC/battery in active configuration. Active configurations require designing and performing a stable control associated to an energy management strategy and an additional DC/DC converter, where its size is a function of the power demand [11]. In [12], Blackwelder et al. proposed hybrid power source that allows the interconnection of a FC and a battery having dissimilar operating voltages, and supply high current peaks by an energy management strategy. In this respect, different criteria to design an energy management strategy can be found in the literature; minimization of fuel consumption or cost, and maximal efficiency, power identification or degradation [13, 14]. However, the converters utilized in the active configuration increase the energy losses, the volume, the weight, the cost and the failure probabilities of the hybrid system [15].
Contrary to active configuration, passive configurations avoid the use of power electronics converter. Passive configurations provide a natural power split by directly connecting the FC and an ESS in parallel. In such architecture, the current distribution between the FC and the ESS is not controlled. In this respect, a previous study explores an indirect power control in a FC/battery passive configuration by regulating the FC pressure [16]. However, this method operates the FC at pressure lower that its nominal value that makes complicated the purging. In [17], a comparative study shows that the passive configuration of FC/SC reduce the hydrogen consumption due
POSTPRINT VERSION. The final version is published here: Dépature, C., Macías, A., Jácome, A., Boulon, L., Solano, J., & Trovão, J. P. (2020). Fuel cell/supercapacitor passive configuration sizing approach for vehicular applications. International Journal of Hydrogen Energy, 45(50), 26501-26512. CC BY-NC-ND
to the elimination of the energy conversion losses of the converter. In this regard, Arora et al. present that the hydrogen stoichiometry can be reduced for a passive configuration of FC/SC to reduce the fuel overconsumption and avoid flooding inside the FC [18]. Another study shows that the passive hybridization of FC/SC improves the FC performance due to the SC removes the peaks from the demanded power [19]. Macias et al. compare the active and passive FC/SC configuration for a vehicular application [20]. Simulation results show that passive configuration increases the global efficiency due to the elimination of power electronics and makes the drawn power from the FC smoother that leads to longer lifetime of the FC. It should be noted that simulation has been used in the majority of studies and experimental validations considering driving operations are limited to a few studies [21, 22]. In another perspective, recent papers study the response of a passive FC/SC configuration at the scale of each FC cell under different situations [23, 24]. The configuration of a FC with SC as energy/power buffer represents an interesting solution, because their high specific power and power density as compared to batteries, SC can assist a FC to meet the transients and high-power requirements peaks [25].
However, the parallel connection can result in a high inrush current if both systems do not have the same electric potential. Recently, some efforts have been made in the initial voltage conditions of the FC/SC passive configuration mainly focusing on the SC pre-charging and the passive system operation. In the commonly used SCs, the terminals voltage decay can vary from 5 to 15% within 48 h, due to auto-discharge phenomenon [26]. Therefore, in case that the SC is completely discharged or has a lower voltage than the FC in the startup phase of the passive hybrid energy system, the demanded load can produce a high inrush current and lead to the degradation of the FC system. Wu et al. use a pre-charging fixed resistor to charge the SC just below the FC open circuit voltage (OCV). This avoids inrush current at the time of connecting the sources but increases the startup time [22]. The instantaneous high input current can also be limited without a resistor, by controlling the initial H2 flow [27]. Silva et al. propose to turn on the FC after connecting the SC in order to increase progressively the voltage and reduce the high peak of current [28]. The presented principles are experimentally validated using a current pulse load. Silva et al. study FC/SC passive configuration by simulation and implement an experimental setup to study the effect of high current on FC degradation.
Another important aspect is the sizing of the hybrid system, i.e. the selection of the FC and ESS characteristics, this stage is crucial to obtain a functional passive power split. Compare to active configuration where a DC/DC converter adapts the voltage of the components to the bus voltage. In this respect, Arora et al. analyze the FC and SC characteristics to split the power based on the traction power frequency distribution, and concluded that the SC has to store enough energy to assist the FC [29]. In [30], a study of a passive SC/battery configuration presents a method to calculate the SC size by using a supercapacitor energy controller in a PV power smoothing application. This method determines the required energy storage size of the SC while assuring the defined smoothness of the battery power.
In view of the reviewed works, some efforts have already been made concerning the sizing of passive FC/SC configuration in vehicular applications. However, so far, these methods just consider the energetic behavior of the SC along the utilized profiles. In addition to common concerns regarding the voltage and SOC levels of the SC, the current dynamics operational limits of the FC are necessary to be considered along the different operation phases of the system. These requirements have made the formulation of this sizing method of a passive FC/SC hybrid energy system for a vehicle application. Prior to this paper, no sizing approach for FC vehicles considers the storage capacity, maximum voltage, and current dynamics of the FC at the same time. Experimental tests are performed to assess the performance of the proposed sizing approach. Three tests are carried out: SC pre-charging, load current step, and on-road operation. The remainder of the paper is organized as follows. Section II describes the studied FC/SC system along with the explanation of the model and the pre-charging strategy. Section III describes the FC and SC designs. Section IV copes with the real-time validation and the discussion of the experimental results.
2. Vehicle modeling and representation 2.1. Studied vehicle
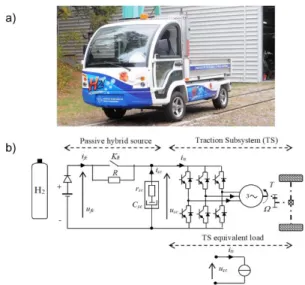
The studied FC/SC architecture is based on the traction characteristics of low speed Nemo battery electric truck of the Hydrogen Research Institute of Université du Québec à Trois-Rivières (UQTR), shown in Fig. 1a. The studied traction subsystem is composed of a voltage-source inverter (VSI), a three-phase machine, a gearbox, a differential, and two driven wheels shown in Fig. 1b. The powertrain is built on an ACX-2043, 3𝜙 AC/4.8 kW
induction machine which is operated by an AC induction motor controller to set the motor speed. The speed and torque control of 3-phase AC motors has a wide input voltage range of 40V to 80V. The main characteristics of the FC hybrid electric vehicle are detailed in [31]. The vehicle was instrumented with current and voltage sensors as well as a satellite global positioning system (GPS) antenna which provides speed and altitude information. An on-road urban driving cycle test has been carried out by the Nemo vehicle at the campus of the UQTR [32]. From this on-road test, the studied driving cycle is composed of a repetitive sequence of constant speed (20 km/h), acceleration and braking phases. In addition, during this test, the vehicle has not been on a flat road. The maximum speed of Nemo is 40 km/h, and it reaches a maximum acceleration of 1.7 m/s2.
Fig. 1. Nemo electric vehicle, a) picture, b) studied FC/SC vehicle architecture
This results in a full-scale traction power profile Pts which is used as a reference for this paper in order to
subject the sizing approach to the real operation of a specific vehicle shown in Fig. 2.
Fig. 2. Full-scale Nemo vehicle speed and power from an on-road test drive
In a pure electric mode with two passengers, the Nemo vehicle has an autonomy of 60 km. This autonomy can be increased by replacing the original battery pack with a passive FC/SC energy system. Fig. 1b shows the used passive configuration in which the FC is associated with a diode and the SC are directly connected in parallel. The traction is represented as an electric load connected to the DC bus voltage. As in a conventional capacitor, SC terminals voltage (𝑢𝑠𝑐) depends on the energy stored in its electric field. When the SC are charged or discharged, the terminals voltage respectively increases or decreases in a rate which depends on the size of the SC. In this respect, the current in a SC can instantaneously change its value while the SC voltage can be considered continuous with a limited change rate. As the FC and the SC are connected in parallel, the voltage and the FC current are continuous and with a limited change rate which mainly depends on the SC capacitance. Depending on the SC characteristics, this configuration allows to filter the FC current (𝑖𝑓𝑐), reducing stack faults, and degradation [33].
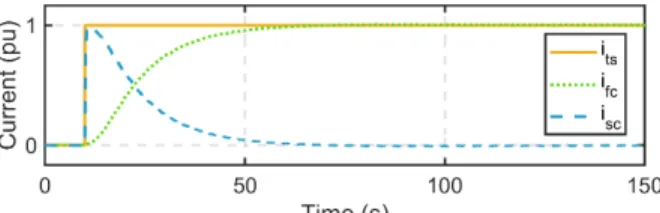
Fig. 3 illustrates the natural current distribution response of the utilized passive FC/SC energy system. The SC acts as a low-pass filter, that supply the requested current while the FC increase gradually its voltage. In this example, it is assumed that the FC and the SC starts at the same potential and the load current step maintains a constant value. This current step can be interpreted as the hardest load required to the FC/SC energy system, where the current is represented as per-unit (pu) current.
Fig. 3. FC/SC current distribution principle for a load current step.
When the passive system is turned on, the FC delivers a positive voltage. In this case, if the SC is initially discharged, a direct connection between the FC and the SC happens which is comparable to a short circuit of the FC resulting in a high peak inrush current 𝑖𝑓𝑐. In [34], a study shows that the short circuit operation reduced the mass transfer performance that is reflected as a higher voltage drop at high current levels. To avoid this phenomenon a SC pre-charging system is implemented, as patented by NISSAN in 2005 [35]. The pre-charging system consists of a fixed resistor 𝑅 and a switch 𝐾𝑅, as shown in Fig. 1b. The current will flow through the resistor 𝑅 if the state of the switch 𝐾𝑅 is open. That means the resistor 𝑅 is placed in series with the FC and SC. The function of this resistor is to limit the inrush current during power-up phase, this high peak of current reduces the lifetime of the FC due to the starvation phenomena. This is the most classical method defined in the literature for DC bus capacitors initialization. When the voltage level of the FC is like the one of the SC, the state of the switch is changed to close. When the switch 𝐾𝑅 is close the resistor 𝑅 is bypassed, this means the current flows through the short-circuit generated by the contactor of the switch.
2.2. Modeling
The passive ESS is composed of a FC, a diode, a pre-charged resistor, a switch, and finally a SC pack. The FC operation depends on many phenomena such as the gas and liquid transport, heat exchanges, and electrochemical reactions. In this regard, there are two important approaches of mechanistic and semi-empirical modeling in FC domain. The former goes through these phenomena in details and the latter adopts a macroscopic approach to mask certain internal phenomena. Here, the FC model is represented in an energetic way as detailed in [36]. The ufc output
voltage is then a non-linear function of the current ifc, which depends on the double-layer and quasi-static capacity
voltages of the cells [37]. The capacitive behavior of the cells changes in gas pressure (Nernst law), and electrical losses govern this function, which can be statically presented by a polarization curve [38]. In a passive configuration the current ifc imposed to the FC depends on the states of the switch KR, the diode, and the pre-charged resistor as:
𝑢𝑓𝑐−𝑢𝑠𝑐
𝑟𝐷+𝐾𝑅𝑅= 𝑖𝑓𝑐, with 𝐾𝑅= {0,1} (1)
where rD is the diode resistance, R represents the pre-charged resistor, usc is the SC voltage, and the state of the
switch KR becomes 1 when it is open and the current flow through the resistor, and 0 when it is closed and
pre-charging resistor is bypassed. As shown in Fig. 1b, the FC is connected in series with a diode to prevent reverse current into the FC and this circuit is connected in parallel with the SC. The diode represented as a resistor element causes a voltage drop, triggering a current flow from the FC to the system. This difference is the one that regulates the current of the FC.
The FC/SC electric parallel connection distributes the power of the FC and SC subsystems to the traction system load. The FC and traction subsystem current, ifc and its, are added together to generate the SC currents isc, which is
modeled by the Kirchhoff’s current law (2).
𝑖𝑠𝑐 = 𝑖𝑡𝑠− 𝑖𝑓𝑐 (2)
Regarding the SCs, a series RC model is used to only consider their fast dynamics (3). The resistor rsc models the
voltage drops during the charging and discharging phases, and the constant capacitance Csc characterizes the
capacitor usc, the leakage resistance which induces losses when the SCs are not used, and the charge distributions
phenomenon are not taken into account due to the fact that their time constants are very large compared with the dynamics of the considered application (from a few hundreds of seconds to several hours) [39].
𝑢𝑠𝑐 = 𝑟𝑠𝑐𝑖𝑠𝑐+ 1
𝐶𝑠𝑐∫ 𝑖𝑠𝑐𝑑𝑡 (3)
The traction subsystem is considered as an electric load (Fig. 1b). The current of traction subsystem, its, is then
expressed by the electrical traction power, Pts (depending on the considered driving cycle) and the DC bus voltage,
usc (see Fig. 2):
𝑖𝑡𝑠 = 𝑃𝑡𝑠⁄𝑢𝑠𝑐 (4)
2.3. Energetic Macroscopic Representation and Pre-Charged Strategy
The Energetic Macroscopic Representation (EMR) of the studied vehicle is deduced from the relationships presented in section 2.2 (Fig. 4). The components are connected respecting the physical interaction principle of action-reaction [40]. One of the main advantages of this graphical description is to represent the interaction of different physical phenomena in the same diagram.
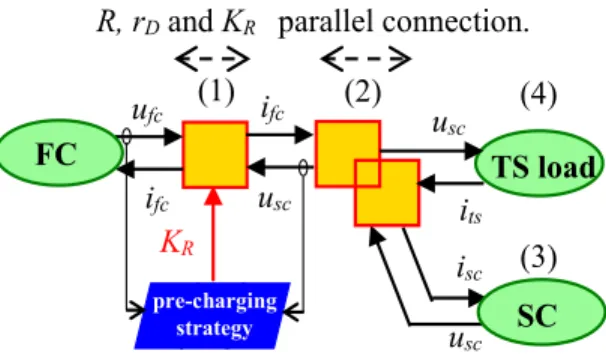
The FC system, the SC, and the traction system are considered as electrical sources which impose the FC voltage 𝑢𝑓𝑐, the SC voltage usc, and the traction subsystem current its, respectively. The diode, the pre-charged resistor, and the switch are considered as a mono-domain conversion element with the voltages of 𝑢𝑓𝑐 and 𝑢𝑠𝑐 as the inputs, the current 𝑖𝑓𝑐 as the output, and the reference switch state 𝐾𝑅 as the tuning input. The parallel connection is represented as a coupling element.
A strategy-level output needs to be defined, which will be the charging strategy block of Fig. 4. The pre-charged switch 𝐾𝑅 state depends on the SC voltage 𝑢𝑠𝑐. 𝐾𝑅 is switched on when the SC voltage 𝑢𝑠𝑐 reaches a value close to the FC OCV by the pre-charging strategy.
Fig. 4. Energetic Macroscopic Representation of the studied vehicle
3. Fuel Cell and Supercapacitor Design 3.1. Hybrid System Design
In this paper, the studied hybrid power source is based on a Horizon 500-W FC (H-500 FC). The rated power of the selected FC can supply the requested power of the 1/25th scale electrical traction power during the maximum speed and high acceleration rates. In order to preserve and reduce the FC degradation, frequency decomposition of traction power is often performed for active FC/SC configurations with power electronics [41, 42]. If the system is well designed, the passive coupling of the FC with SC naturally preserves the FC from excessively fast dynamic power demands. If the FC is expose to sudden peak currents, its lifetime is reduced, and the output voltage will not get a steady value at the requested moment. This effect is due to the phenomenon of starvation, which means there is an insufficient supply of reactant gas [43]. Thus, to avoid starvation some authors considered that the power gradient value should be between 2% to 20% of the FC maximum power per second, or 4 to 50 A/s as the FC
usc its ifc FC u fc ifc R, rD and KR usc isc usc parallel connection. TS load (2) (1) KR SC pre-charging strategy (3) (4)
dynamic limitation [44]. In addition, other studies indicate that the FC suffers a percentage of power reduction when there is a load variation rate higher than 10% of the maximum FC power per second [45, 46]. These limitations generally result in a current slope which should not be exceeded in order to reduce the stress in the FC system. Considering typical values on the literature, it has been assumed that a limitation of 2 A/s allows to avoid degradation and gas starvation. That means the system can reach its maximum current in 15s, while respecting the slow dynamics of the FC.
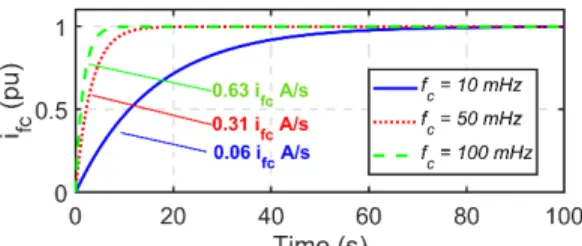
In order to select the adequate value, a comparison of several cut-off frequencies responses to a step traction current is shown in Fig. 5. In the figure the FC current is plotted in per-unit, and the maximum corresponding current slope is also indicated. Assuming a current step of 30 A, which correspond to the nominal current of the Horizon FC, the maximum current slope varies from 18.9 A/s for a cut-off frequency of 100 mHz to 1.8 A/s for a cut-off frequency of 10 mHz. The selected cut-off frequency is fc=10 mHz, which corresponds to a maximum current slope
of 1.8 A/s. The resulted current slope respects the specified current limitation of 2 A/s. However, the selected cut-off frequency has a stabilization time of about 80 s as shown in Fig. 5. Operating at this frequency has two main advantages. First, the FC does not suffer from any significant current transients (1.8 A/s), preventing it from gas starvation and its degradation effects [47]. Secondly, the FC rarely operates at its OCV since the stabilization time is very short. A frequency of 10 mHz therefore preserves the FC membrane and catalyst, since operation at the OCV accelerates the generation of peroxide and hydroperoxide radicals, which attack the membrane and catalyst [48, 49]. Finally, if the FC and the SC have the same initial potential, the startup time to achieve 50 % of the rated current for the FC system is 10 seconds. Regarding the United States Department of Energy (DOE) targets for light-duty FC vehicles, the ultimate target for FC startup time to full-flow is between 5 to 15 s, depending on the ambient temperature [50]. The chosen cut-off frequency of 10mHz is thus a compromise between performance and degradation minimization. However, the SC sizing should be done taking into consideration the maximum current peak of the system that corresponds to maximum acceleration.
Fig. 5. Frequency decomposition and current slopes considering a traction current step
3.2. Supercapacitor Design
By comparison, FC/SC passive configurations are less expensive and simpler to operate than active configurations, nevertheless, the performance depends on the sizing of the energy systems [51]. Conventional methods size SC according to two criteria: storage capacity and maximum voltage [22, 29, 33, 51]. However, in this work, a third criterion has been added which is the current dynamic range of the FC. This section first explains the two common criteria found in the literature, then how SC parameters affect the FC operating frequency, and finally based on the desired FC current dynamic this analysis is used to size the SC
Concerning the storage capacity criterion, the SC must assist the FC regardless of the load stress imposed by the traction. In this respect, SC need to be designed according to their storage capacity (Wh) since their energy density is relatively low (5-10 Wh/kg) compared to their power density (1-5 kW/kg) [52]. Hence, if the energy requirements are met, the power requirements will be met too. This requires knowing the maximal vehicle operation requirements by a frequency decomposition. The frequency decomposition at 10 mHz of the 1/25th scale electrical traction power during the road test of Fig. 2b, is divided in low frequency and compensation power. The low frequency power (PLF) is the power expected to be delivered by the FC, and the compensation power is the power that should be
supplied by the SC. In order to identify the maximum requested energy during the driving cycle the compensation power component is integrated through the time and represented in terms of energy in the Fig. 6. From this analysis, the energy that SC needs to store is less than 1.05 Wh.
Fig. 6 compensation power in terms of energy evolution
Regarding the maximum voltage criterion, the maximum voltage of the SC must be higher than the FC’s OCV.
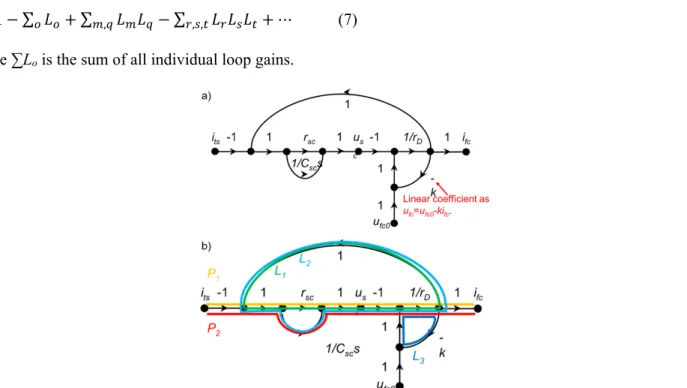
As the FC and diode are connected in parallel to the SC, the two circuits share the same voltage. For safety purposes, SC should not be overloaded. The right size of the SC arrangement avoids exceeding their maximum permissible voltage [22, 53]. Apropos the third criteria, a signal flow graphs, and Mason’s gain formula are useful to complex system analysis. In this paper, these methods are used to analyze the passive hybrid design. Mason's gain formula allows defining the transfer function of a complex system in an efficient way. It is often applied from signal flow graphs [54]. A signal flow graph consists of a diagram composed of a set of nodes connected by paths, representing a set of linear equations.
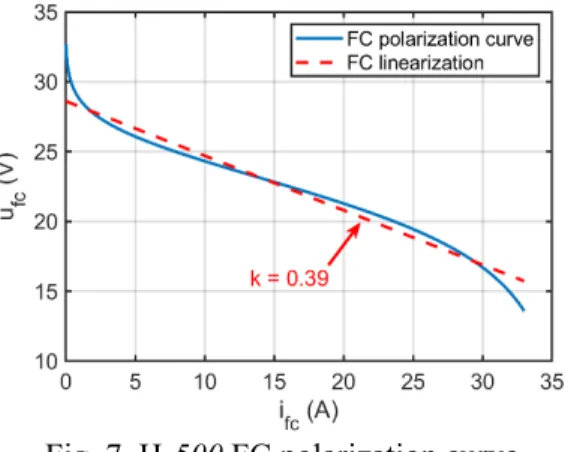
In the literature semi-empirical models are utilized to describe the behavior of the FC, which is represented in a graphical way as the polarization curve [55]. Fig. 7 presents the H-500 FC static model experimentally validated. The FC polarization curve is composed of the reversible voltage; which is the maximum possible voltage of the FC, and irreversible voltage losses; which are the activation, ohmic and concentration losses. The activation loss represents the energy needed to start the reaction. The ohmic losses are caused by ionic, electronic, and contact resistances, which in most of the models is assumed as a linear function. The concentration losses happen at high currents and represents the mass transport, which is caused by the concentration reduction of hydrogen and oxygen gases in electrodes. In this work it is assume that the FC will operate mostly in the ohmic region. Therefore, the proposed SC design method assumes that the used models are linear. If the FC does not operate at OCV and high currents, this polarization curve can be linearized to provide the linear model of the studied FC:
𝑢𝑓𝑐 = 𝑢𝑓𝑐0− 𝑘𝑖𝑓𝑐 (5)
where the linear FC OCV (ufc0) is 28.61 V and k=0.39 is a linear coefficient.
Fig. 7. H-500 FC polarization curve
The FC current ifc versus the traction system current its signal flow chart is presented in Fig. 8a. It has been
obtained by using the model equations presented in section II.B, assuming a Laplace domain representation and the FC linear model.
The Mason’s gain formula determines the linear transfer function T(s) between an independent input (the traction system current its) and a dependent output (the FC current ifc) as follows:
𝑇(𝑠) =∑ 𝑃𝑛 𝑛∆𝑛
where Pn is the nth path gain of the input variable to the output variable, Δ is the determinant of the graph, and Δn
is the Pn path cofactor. The determinant Δ is calculated as follows:
∆= 1 − ∑ 𝐿𝑜 𝑜+ ∑𝑚,𝑞𝐿𝑚𝐿𝑞− ∑𝑟,𝑠,𝑡𝐿𝑟𝐿𝑠𝐿𝑡+ ⋯ (7) where ∑Lo is the sum of all individual loop gains.
Fig. 8. Fuel cell current ifc versus traction system current its, a) signal flow graph, b) Mason’s gain formula
application.
From the signal flow graph described in Fig. 8a, there are two forward paths P1 and P2 that link its to ifc (yellow
and red paths presented in Fig. 8b, respectively) and 3 loops L1, L2 and L3 (green, light blue and dark blue paths in
Fig. 8b). Note that P1 and P2 touch all the loops so Δ1=1 and Δ2=1. L1, L2 and L3 touch each other leading to
Δ=1-L1-L2-L3 (8). T(s) is finally defined in (9). { 𝑃1= 𝑅 𝑟𝐷 𝐿1= 𝑅 𝑟𝐷 ∆1= 1 𝑃2= 1 𝐶𝑟𝐷𝑠 𝐿2= 1 𝐶𝑟𝐷𝑠 ∆2= 1 𝐿1= 𝑘 𝑟𝐷 ∆= 1 − 𝐿1− 𝐿2− 𝐿3 (8) 𝑇(𝑠) =𝑖𝑓𝑐 𝑖𝑡𝑠 = 𝑃1∆1+𝑃2∆2 ∆ = 1+𝑅𝐶𝑠 1+𝐶(𝑟𝐷+𝑅+𝑘)𝑠 (9)
The stabilization of the obtained T(s) is studied in the complex plane as shown in Fig. 9. The pole, represented by a cross, is the root of the denominator of T(s). The zero, represented as a circle, is the root of the numerator. The system is exponentially stable since the pole is in the left half of the complex plane. It is also possible to compare
T(s) with the second order transfer function T2d (s):
𝑇2𝑑(𝑠) = 𝜔𝑛2
𝑠2+2𝜉𝜔
𝑛𝑠+𝜔𝑛2 (10)
where ξ represents the damping coefficient and ωn the natural pulsation of the second order system. Considering
that T(s) and T2d(s) poles have the same real values (red dashes in Fig. 9) and assuming that the zero of 1/Cscrsc is
higher than the pole of 1/Csc(rD+rsc+k), it is possible to identify that:
𝜉𝜔𝑛= 1
with ξ=1 (see the green part in Fig. 9), and ωnts=4.744 from the settling time chart. The FC current stabilization time
at 1% of the final value in steady state ts can be defined as:
𝑡𝑠(1%) = 4.744𝐶𝑠𝑐(𝑟𝐷+ 𝑟𝑠𝑐+ 𝑘) = 5𝜏 (12)
where τ is the time constant of the FC operation. Finally, the FC current cut-off frequency can be calculated as: 𝑓𝑐= 1 2𝜋𝜏= 5 2𝜋𝑡𝑠(1%)= 5 2𝜋4.744𝐶𝑠𝑐(𝑟𝐷+𝑟𝑠𝑐+𝑘) (13)
Fig. 9. Complex plan of the studied transfer function T(s)
3.3. Study case
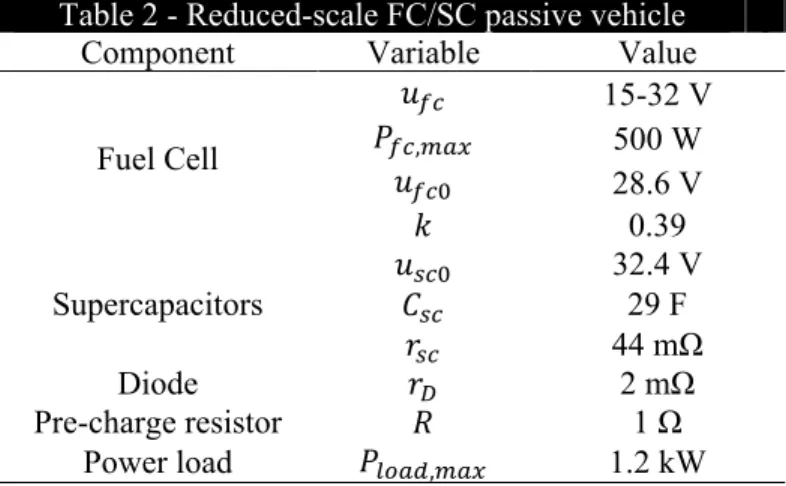
Based on the three criteria of the proposed sizing method the standard electrolytic capacitor value that satisfy the constrains is a pack of two 16.2V-58F SC (BMOD0058 Maxwell SC) connected in series. This arrangement has a higher voltage than the H-500 FC OCV, enough energy to assist the FC, and a cut-off frequency of 13 mHz. The main characteristic of the FC/SC testbench are summarized in Table 2. The useful energy of the 2 SC Maxwell modules Eu is computed from the nominal voltage usc0 up to the 50% of maximum voltage by (14), which is
sufficient to operate in a good efficiency operation range and to avoid physical instability due to a low FC voltage [53, 56]. 𝐸𝑢 =1 2𝐶𝑠𝑐𝑢𝑠𝑐0 2 (1 − (50 100) 2 ) = 11360𝐽 1ℎ 3600𝑠= 3.15𝑊ℎ (14)
As the SCs have been selected according to the FC desired operating current dynamic and the FC OCV, it is not surprising that the SCs seem energetically oversized (3.15Wh compared to the 1.05Wh required). The energy supplied by the SC do not exceed its limits, this ensures the physical stability and high SC efficiency.
Table 2 - Reduced-scale FC/SC passive vehicle
Component Variable Value
Fuel Cell 𝑢𝑓𝑐 15-32 V 𝑃𝑓𝑐,𝑚𝑎𝑥 500 W 𝑢𝑓𝑐0 28.6 V 𝑘 0.39 Supercapacitors 𝑢𝐶𝑠𝑐0 𝑠𝑐 32.4 V 29 F 𝑟𝑠𝑐 44 mΩ Diode 𝑟𝐷 2 mΩ Pre-charge resistor 𝑅 1 Ω Power load 𝑃𝑙𝑜𝑎𝑑,𝑚𝑎𝑥 1.2 kW
4. Real-Time Validation 4.1. Experimental Setup
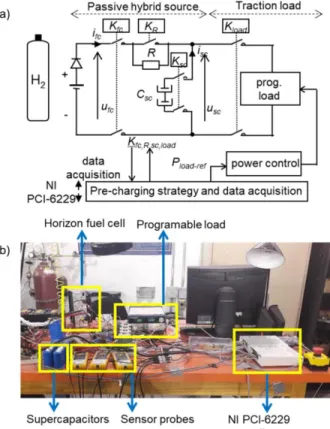
Based on the traction characteristics of the low speed Nemo (Fig. 1a), a reduced scale validation is performed on an experimental platform as shown in Fig. 10. The set-up is composed of a 500-W Horizon PEM FC, a pack of 2 Maxwell SCs, a diode, a 1 Ω pre-charged resistor and a 1.2 kW programmable DC load to emulate the traction subsystem. The programmable DC load is used as a load drive with a power reduction of 25 compared to the full-scale studied vehicle. For the validation purpose, only mechanical braking is considered. Furthermore, the components with the selected sizes are cable of supplying the requested power during a constant phase of maximum speed. Voltages and currents are measured with classical LEM transducers and voltage probes. As shown in Fig. 10a electric diagram of the testbench is composed of the FC system, the pre-charged resistor, the SC system, and the programmable load. These components are connected together by means of four 40 A contactors Kfc, KR, Ksc
and Kload. The contactor Kfc, and Kload are implemented as safe contactors to stop the test in case of a failure.
Fig. 10. Test bench, a) diagram, b) experimental platform
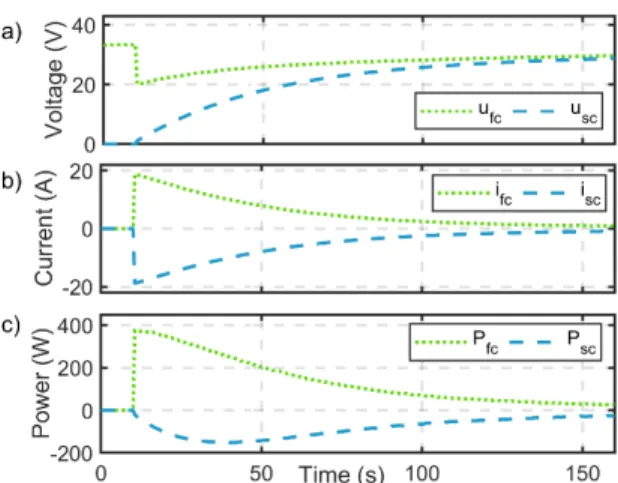
A test is proposed to validate the design of the FC/SC passive configuration system under the conditions of the maximum FC current. Fig. 11 shows the response of the system alongside a 30 A step current. When t=0 s, the values of ufc and usc are 29.7 V and 29.3 V, respectively. The voltage difference is linked to the voltage drop in the
diode, and so the SCs are correctly loaded. A pulse current step (its=0-30 A) at t=10 s is imposed on the passive
FC/SC system. From the proposed method, the objective FC operating frequency is 10 mHz. However, the SC sizes are limited in commercial standard values. Consequently, the FC current ifc has a stabilization time of 74 s, which
corresponds to an operating frequency of 13 mHz. The results show that the SC responds correspond to the calculated theoretical cut-off frequency of (13), although the FC polarization curve has been defined as a linear model. Indeed, the polarization curve characterization assumes voltage, current, and temperature steady state, thus neglecting the transient states. During this test, the minimum voltage of the SC is 18.8 V. This voltage is higher than usc0/2. Consequently, the selected SCs allow to maintain an enough SC state of charge, which limits the currents
and the efficiency of the SC. Finally, the configuration allows the system to respond to the traction demands in a passive way. Peak power demands are provided by the SC and the FC provides an average traction power. For example, the 440 W power demand at t=10 s is exclusively provided by the SC. The FC then progressively increase
its power component and takeover of the SC contribution.
Fig. 11. Passive hybrid source current step validation, a) voltage profile, b) current profile, and c) power profile
4.2. Supercapacitors Pre-Charging
The developed pre-charging strategy is built and implemented in a National Instrument NI PCI-6229 controller. The management of the contactors allows two operation modes:
1) Mode 1: SC pre-charging. Kfc and Ksc are closed. KR and Kload are opened. The system becomes a closed
circuit with the FC, diode, pre-charging resistor and SC connected in series. The FC charges the SC up to its OCV. And the pre-charged resistor limits the inrush current ifc.
2) Mode 2: Vehicle operation. Kfc, Ksc, KR and Kload are closed. The emulated traction load is connected in
parallel to the SC of the system. Therefore, the system becomes a circuit with three branches in parallels: the FC and the diode, the SC, and the load. The FC operation frequency depends on the SC characteristics. The first pre-charging step is necessary to balance the FC and the SC at the same electric potential, this process is shown in Fig. 12. When the FC is turned on, it is on OCV. Then the FC is connected to the SC by closing the contactor Kfc and Ksc at t=10 s, its voltage drops instantly to around 20 V. The pre-charged resistor limits the load
current to 20 A. The charging current decreases with a time constant about 38 s, and then an operating frequency of 4.2 mHz. This corresponds to the frequency defined by Eq. (13), but considering the additional fixed pre-charged resistor of 1 Ω. The stabilization time is about 190 s. The advantage of the chosen pre-charging method is that it limits the charging current, which avoids component stress during the FC/SC passive connection, however the SC charging time is relatively long. Note that for this pre-charging test, the SC was fully discharged. This is the worst operation case that should not happen often because the SC self-discharge time constant is relatively long [26]. More advanced pre-charging strategies could be used in further studies, including short-circuit or progressive FC/SC connection [28], using a Voltage Stabilization System (VSS) [57], or a control system to regulate the connection of a pre-charging resistance before starting the vehicle [58].
Fig. 12. Supercapacitors pre-charge, a) voltage profile, b) current profile, and c) power profile
4.3. On-Road Operation
The 1.2kW programmable load reproduces the on-road power profile with a scale reduction of 25. And the studied hybrid power source is based on a Horizon 500-W FC (H-500 FC) connected in parallel with a SC pack. Based on the proposed three-criteria sizing method the selected capacitor value is a pack of two 16.2V-58F SC (BMOD0058 Maxwell SC) connected in series. This passive configuration avoids using a power electronics converter, because the current distribution between the FC and the SC depends on the natural behavior of each component. The experimental results of implemented FC/SC passive coupling in real-time conditions; power, voltage, and current splits; are shown in Fig. 13. As with the hybrid source design validation test, the SCs are charged at t=0 s. It is observed from Fig. 13a that the traction power profile has two main peaks that overpass the maximum power of the FC. However, the SC has enough energy to immediately supply the requested power without a high voltage drop as shown in the storage capacity criterion. In this respect the Fig. 13b shows the SOC evolution of the SC. The lowest SOC is 89% that happens during the highest current peak of 30 A. The FC voltage evolution operates in the linear zone of the polarization curve as shown in Fig. 13c, that avoids physical instability on the FC. In addition, the SC voltage never exceeds its voltage limits. Also, the FC current distribution is filtered thru the SC avoiding high current stress by the FC, as shown in Fig. 13d. The maximum current change per second is 1.2 A/s, which is inferior to the 2 A/s design limit. As described, the FC/SC passive system respects the all the sizing constraints, and the SCs assist the FC to meet the requirements of the load with a guarantee of system stability in real-time.
Fig. 13. Reduced-scale vehicle operation validation, measured signals a) voltage, b) SC SOC, c) current, and d) power
5. Conclusion
This paper deals with the design of a passive FC/SC hybrid source based on a three-criteria sizing method. As other sizing method found in the literature, storage capacity and voltage of the SC must be checked for security and efficiency purposes. The additional design criterion is the FC current dynamic, defined in a heuristic way to limit the FC degradation by limiting the FC current slope. For the SC design, the FC current versus the traction system current transfer function is defined based on the Mason’s gain. Assuming that the used models are linear, the FC model, the analysis of this transfer function allows selecting the SC according to the desired FC operating frequency.
The proposed sizing approach allows to 1) reduce the FC degradation rate because the current slope, OCV, and stop-start operation are limited, and 2) improve the system efficiency because the SCs operate at a voltage discharge ratio upper than 50%. The developed design method is validated in real-time on an experimental setup. Three tests are carried out: SC pre-charging, traction current step, and on-road operation. Experimental results have shown that the SC can assist the FC to meet the power requirements with a guarantee of system stability and design constrains. In future, new strategies could be put forward to choose the optimal FC frequency operation, based on degradation, performance, or efficiency criteria. Additional work is required to model the FC degradations under a dynamic profile as presented in automotive application. Moreover, the study of a passive/active configuration, which uses an additional converter to convert the power from the SC to the traction, can be explored. This configuration could allow to start the vehicle without finishing the pre-charging phase but requires studying the minimum SC voltage to switch on the converter.
6. Acknowledgment
This work was supported by the Canada Research Chairs Program (grants 950-230863 and 950-230672 ), the National Sciences and Engineering Research Council of Canada (grants RGPIN-2018-06527 and RGPIN-2017-05924), the Emerging Leaders in the Americas Program (ELAP) and also with the support of the “Service de Coopération et d’Action Culturelle du Consulat Général de France à Québec” within the Samuel-De Champlain Program.
7. Nomenclatures Csc Equivalent capacitance of SC [F] Eu SC energy [J] fc Cut-off frequency [Hz] ifc FC current [A] isc SC current [A]
Its Traction current [A]
Kfc FC switch
Kload Load switch
KR Pre-charged switch
Ksc SC switch
Li Loop gain
PFC,max Maximum FC power [W]
PLF Low frequency power [W]
Pload,max Maximum load power [W]
Pn Path cofactor
Pts Traction power [W]
rD Equivalent diode resistance [Ω]
rsc Equivalent resistance of SC [Ω]
T(s) Linear transfer function
ufc FC voltage [V] usc SC voltage [V] Δ Determinant ξ Damping coefficient τ Time constant [s] ωn Natural pulsation 𝑅 Fixed resistor [Ω] 𝑘 Linear FC coefficient
Abbreviations and acronyms
DOE United States Department of Energy
FC Fuel cell
FC/SC Fuel cell/supercapacitor
GPS Global positioning system
H-500 FC Horizon 500-W FC
OCV Open circuit voltage
SC Supercapacitor
UQTR Université du Québec à Trois-Rivières
VSS Voltage Stabilization System
8. References
[1] G. Glenk and S. Reichelstein, "Economics of converting renewable power to hydrogen," Nature Energy, vol. 4, pp. 216-222, 2019/03/01 2019. [2] Z. Li, A. Khajepour, and J. Song, "A comprehensive review of the key technologies for pure electric vehicles," Energy, vol. 182, pp. 824-839,
2019/09/01/ 2019.
[3] G. Morrison, J. Stevens, and F. Joseck, "Relative economic competitiveness of light-duty battery electric and fuel cell electric vehicles,"
Transportation Research Part C: Emerging Technologies, vol. 87, pp. 183-196, 2018/02/01/ 2018.
[4] C. Acar and I. Dincer, "The potential role of hydrogen as a sustainable transportation fuel to combat global warming," International Journal of
Hydrogen Energy, 2018/11/23/ 2018.
[5] M. Bodner, A. Schenk, D. Salaberger, M. Rami, C. Hochenauer, and V. Hacker, "Air Starvation Induced Degradation in Polymer Electrolyte Fuel Cells," Fuel Cells, vol. 17, pp. 18-26, 2017.
[6] F. X. Chen, Y. Yu, and J. X. Chen, "Control System Design of Power Tracking for PEM Fuel Cell Automotive Application," Fuel Cells, vol. 17, pp. 671-681, 2017.
[7] F. Nadeem, S. M. S. Hussain, P. K. Tiwari, A. K. Goswami, and T. S. Ustun, "Comparative Review of Energy Storage Systems, Their Roles, and Impacts on Future Power Systems," IEEE Access, vol. 7, pp. 4555-4585, 2019.
[8] B. Bendjedia, N. Rizoug, M. Boukhnifer, F. Bouchafaa, and M. Benbouzid, "Influence of secondary source technologies and energy management strategies on Energy Storage System sizing for fuel cell electric vehicles," International Journal of Hydrogen Energy, vol. 43, pp. 11614-11628, 2018/06/21/ 2018.
[9] H. S. Das, C. W. Tan, and A. H. M. Yatim, "Fuel cell hybrid electric vehicles: A review on power conditioning units and topologies," Renewable
and Sustainable Energy Reviews, vol. 76, pp. 268-291, 2017.
[10] R. Á. Fernández, F. B. Cilleruelo, and I. V. Martínez, "A new approach to battery powered electric vehicles: A hydrogen fuel-cell-based range extender system," International Journal of Hydrogen Energy, vol. 41, pp. 4808-4819, 2016/03/02/ 2016.
[11] H. Wang, A. Gaillard, and D. Hissel, "A review of DC/DC converter-based electrochemical impedance spectroscopy for fuel cell electric vehicles,"
Renewable Energy, vol. 141, pp. 124-138, 2019/10/01/ 2019.
[12] M. J. Blackwelder and R. A. Dougal, "Power coordination in a fuel cell–battery hybrid power source using commercial power controller circuits,"
Journal of Power Sources, vol. 134, pp. 139-147, 2004/07/12/ 2004.
[13] A. Djerioui, A. Houari, S. Zeghlache, A. Saim, M. F. Benkhoris, T. Mesbahi, et al., "Energy management strategy of Supercapacitor/Fuel Cell energy storage devices for vehicle applications," International Journal of Hydrogen Energy, 2019/07/31/ 2019.
[14] M. Yue, S. Jemei, R. Gouriveau, and N. Zerhouni, "Review on health-conscious energy management strategies for fuel cell hybrid electric vehicles: Degradation models and strategies," International Journal of Hydrogen Energy, 2019/02/18/ 2019.
[15] M. S. Perdigão, J. P. F. Trovão, J. M. Alonso, and E. S. Saraiva, "Large-Signal Characterization of Power Inductors in EV Bidirectional DC–DC Converters Focused on Core Size Optimization," IEEE Transactions on Industrial Electronics, vol. 62, pp. 3042-3051, 2015.
[16] J. Bernard, M. Hofer, U. Hannesen, A. Toth, A. Tsukada, F. N. Büchi, et al., "Fuel cell/battery passive hybrid power source for electric powertrains,"
Journal of Power Sources, vol. 196, pp. 5867-5872, 2011/07/15/ 2011.
[17] H. Zhao and A. F. Burke, "Fuel Cell Powered Vehicles Using Supercapacitors-Device Characteristics, Control Strategies, and Simulation Results,"
Fuel Cells, vol. 10, pp. 879-896, 2010.
[18] D. Arora, C. Bonnet, M. Mukherjee, S. Raël, and F. Lapicque, "Direct hybridization of PEMFC and supercapacitors: Effect of excess hydrogen on a single cell fuel cell durability and its feasibility on fuel cell stack," Electrochimica Acta, vol. 310, pp. 213-220, 2019/07/01/ 2019.
[19] Q. Xun, Y. Liu, and E. Holmberg, "A Comparative Study of Fuel Cell Electric Vehicles Hybridization with Battery or Supercapacitor," in 2018
International Symposium on Power Electronics, Electrical Drives, Automation and Motion (SPEEDAM), 2018, pp. 389-394.
[20] A. Macías, M. Kandidayeni, L. Boulon, and J. Trovão, "Passive and Active Coupling Comparison of Fuel Cell and Supercapacitor for a Three-Wheel Electric Vehicle," Fuel Cells, vol. n/a, 2019/10/29 2019.
[21] K. Gérardin, S. Raël, C. Bonnet, D. Arora, and F. Lapicque, "Direct Coupling of PEM Fuel Cell to Supercapacitors for Higher Durability and Better Energy Management," Fuel Cells, vol. 18, pp. 315-325, 2018.
[22] B. Wu, M. A. Parkes, V. Yufit, L. De Benedetti, S. Veismann, C. Wirsching, et al., "Design and testing of a 9.5 kWe proton exchange membrane fuel cell–supercapacitor passive hybrid system," International Journal of Hydrogen Energy, vol. 39, pp. 7885-7896, 2014.
[23] C. Turpin, D. Van Laethem, B. Morin, O. Rallières, X. Roboam, O. Verdu, et al., "Modelling and analysis of an original direct hybridization of fuel cells and ultracapacitors," Mathematics and Computers in Simulation, vol. 131, pp. 76-87, 2017.
[24] B. Morin, D. Van Laethem, C. Turpin, O. Rallières, S. Astier, A. Jaafar, et al., "Direct Hybridization Fuel Cell - Ultracapacitors," Fuel Cells, vol. 14, pp. 500-507, 2014.
[25] C. Dépature, W. Lhomme, P. Sicard, A. Bouscayrol, and L. Boulon, "Real-Time Backstepping Control for Fuel Cell Vehicle Using Supercapacitors," IEEE Transactions on Vehicular Technology, vol. 67, pp. 306-314, 2018.
[26] M. Kaus, J. Kowal, and D. U. Sauer, "Modelling the effects of charge redistribution during self-discharge of supercapacitors," Electrochimica Acta, vol. 55, pp. 7516-7523, 2010/10/30/ 2010.
[27] M. Hinaje, S. Raël, J. P. Caron, and B. Davat, "An innovating application of PEM fuel cell: Current source controlled by hydrogen supply,"
International Journal of Hydrogen Energy, vol. 37, pp. 12481-12488, 2012/09/01/ 2012.
[28] R. E. Silva, F. Harel, S. Jemeï, R. Gouriveau, D. Hissel, L. Boulon, et al., "Proton Exchange Membrane Fuel Cell Operation and Degradation in Short-Circuit," Fuel Cells, vol. 14, pp. 894-905, 2014.
[29] D. Arora, M. Hinaje, C. Bonnet, S. Raeel, and F. Lapicque, "Sizing Supercapacitor for Direct Hybridization with Polymer Electrolyte Membrane Fuel Cell," in 2018 IEEE Vehicle Power and Propulsion Conference (VPPC), 2018, pp. 1-7.
[30] D. B. W. Abeywardana, B. Hredzak, V. G. Agelidis, and G. D. Demetriades, "Supercapacitor Sizing Method for Energy-Controlled Filter-Based Hybrid Energy Storage Systems," IEEE Transactions on Power Electronics, vol. 32, pp. 1626-1637, 2017.
[31] F. Martel, S. Kelouwani, Y. Dubé, and K. Agbossou, "Optimal economy-based battery degradation management dynamics for fuel-cell plug-in hybrid electric vehicles," Journal of Power Sources, vol. 274, pp. 367-381, 2015/01/15/ 2015.
[32] S. Kelouwani, K. Agbossou, Y. Dubé, and L. Boulon, "Energetic Optimization of the Driving Speed Based on Geographic Information System Data," in 2012 IEEE Vehicular Technology Conference (VTC Fall), 2012, pp. 1-5.
[33] J. Snoussi, S. B. Elghali, M. Benbouzid, and M. F. Mimouni, "Optimal Sizing of Energy Storage Systems Using Frequency-Separation-Based Energy Management for Fuel Cell Hybrid Electric Vehicles," IEEE Transactions on Vehicular Technology, vol. 67, pp. 9337-9346, 2018. [34] C. Bonnet, F. Lapicque, M. Belhadj, K. Gerardin, S. Raël, M. Hinaje, et al., "Can PEM Fuel Cells Experience Appreciable Degradation at Short
Circuit?," Fuel Cells, vol. 17, pp. 157-165, 2017/04/01 2017. [35] Nissan, "Fuel cell system," 2005.
[36] N. Marx, D. Hissel, D. C. Toquica Cárdenas, L. Boulon, and F. Gustin, "Degraded mode operation of multi-stack fuel cell systems," IET Electrical
Systems in Transportation, vol. 6, pp. 3-11, 2016.
[37] A. Saadi, M. Becherif, D. Hissel, and H. S. Ramadan, "Dynamic modeling and experimental analysis of PEMFCs: A comparative study,"
International Journal of Hydrogen Energy, vol. 42, pp. 1544-1557, 2017/01/12/ 2017.
[38] M. Kandidayeni, A. Macias, A. A. Amamou, L. Boulon, S. Kelouwani, and H. Chaoui, "Overview and benchmark analysis of fuel cell parameters estimation for energy management purposes," Journal of Power Sources, vol. 380, pp. 92-104, 2018.
[39] L. Zubieta and R. Bonert, "Characterization of double-layer capacitors for power electronics applications," IEEE Transactions on Industry
Applications, vol. 36, pp. 199-205, 2000.
[40] A. Bouscayrol, J.-P. Hautier, and B. Lemaire-Semail, "Graphic Formalisms for the Control of Multi-Physical Energetic Systems: COG and EMR," in Systemic Design Methodologies for Electrical Energy Systems, I. a. Wiley, Ed., ed, 2012, pp. 89-124.
[41] H. Marzougui, A. Kadri, M. Amari, and F. Bacha, "Energy Management of Fuel Cell Vehicle with Hybrid Storage System: A Frequency Based Distribution," in 2019 6th International Conference on Control, Decision and Information Technologies (CoDIT), 2019, pp. 1853-1858. [42] W. Wu, J. S. Partridge, and R. W. G. Bucknall, "Stabilised control strategy for PEM fuel cell and supercapacitor propulsion system for a city bus,"
International Journal of Hydrogen Energy, vol. 43, pp. 12302-12313, 2018.
[43] H. Chen, S. Xu, P. Pei, B. Qu, and T. Zhang, "Mechanism analysis of starvation in PEMFC based on external characteristics," International Journal
of Hydrogen Energy, vol. 44, pp. 5437-5446, 2019.
[44] M. G. Carignano, R. Costa-Castelló, V. Roda, N. M. Nigro, S. Junco, and D. Feroldi, "Energy management strategy for fuel cell-supercapacitor hybrid vehicles based on prediction of energy demand," Journal of Power Sources, vol. 360, pp. 419-433, 2017/08/31/ 2017.
[45] Y. Wang, S. J. Moura, S. G. Advani, and A. K. Prasad, "Power management system for a fuel cell/battery hybrid vehicle incorporating fuel cell and battery degradation," International Journal of Hydrogen Energy, vol. 44, pp. 8479-8492, 2019/03/29/ 2019.
[46] P. Pei, Q. Chang, and T. Tang, "A quick evaluating method for automotive fuel cell lifetime," International Journal of Hydrogen Energy, vol. 33, pp. 3829-3836, 2008/07/01/ 2008.
[47] G. Wang, F. Huang, Y. Yu, S. Wen, and Z. Tu, "Degradation behavior of a proton exchange membrane fuel cell stack under dynamic cycles between idling and rated condition," International Journal of Hydrogen Energy, vol. 43, pp. 4471-4481, 2018/03/01/ 2018.
[48] M. Chandesris, R. Vincent, L. Guetaz, J. S. Roch, D. Thoby, and M. Quinaud, "Membrane degradation in PEM fuel cells: From experimental results to semi-empirical degradation laws," International Journal of Hydrogen Energy, vol. 42, pp. 8139-8149, 2017/03/23/ 2017.
[49] L. An, T. Zhao, X. Yan, X. Zhou, and P. Tan, "The dual role of hydrogen peroxide in fuel cells," Science Bulletin, vol. 60, pp. 55-64, 2015/01/01 2015.
[50] U. Drive, "Target explanation document: onboard hydrogen storage for light-duty fuel cell vehicles," Department of Energy2015.
[51] B. Bendjedia, F. Bouchafaa, N. Rizoug, and M. Boukhnifer, "Comparative study between battery and supercapacitor hybridization with fuel cells for automotive applications," in 2017 4th International Conference on Control, Decision and Information Technologies (CoDIT), 2017, pp. 0833-0838.
[52] L. Zhang, X. Hu, Z. Wang, F. Sun, and D. G. Dorrell, "A review of supercapacitor modeling, estimation, and applications: A control/management perspective," Renewable and Sustainable Energy Reviews, vol. 81, pp. 1868-1878, 2018.
[53] T. Li, H. Liu, D. Zhao, and L. Wang, "Design and analysis of a fuel cell supercapacitor hybrid construction vehicle," International Journal of
Hydrogen Energy, vol. 41, pp. 12307-12319, 2016/07/27/ 2016.
[54] K. Ogata and Y. Yang, "Mathematical modeling of dynamic systems," in Modern control engineering. vol. 17, ed: Pearson Upper Saddle River, NJ, 2010, pp. 57-129.
[55] H. Abdi, R. Rasouli Nezhad, and M. Salehimaleh, "Chapter 5 - Fuel Cells," in Distributed Generation Systems, G. B. Gharehpetian and S. M. Mousavi Agah, Eds., ed: Butterworth-Heinemann, 2017, pp. 221-300.
[56] R. Zhang and J. Tao, "GA-Based Fuzzy Energy Management System for FC/SC-Powered HEV Considering H2Consumption and Load Variation,"
IEEE Transactions on Fuzzy Systems, vol. 26, pp. 1833-1843, 2018.
[57] G. Chiappori, P. L. Moigne, P. Delarue, and M. Chemin, "Voltage Stabilization System for Stop - Start Vehicles: Systemic Approach," in 2014
IEEE Vehicle Power and Propulsion Conference (VPPC), 2014, pp. 1-6.
[58] Y. Wang, J. Chen, J. Liu, K. Liu, Y. Zhang, J. Wu, et al., "Research and implementation of key technology of braking energy recovery system for off-highway dump truck," in IECON 2017 - 43rd Annual Conference of the IEEE Industrial Electronics Society, 2017, pp. 3912-3917.