HAL Id: tel-01630518
https://tel.archives-ouvertes.fr/tel-01630518
Submitted on 7 Nov 2017
HAL is a multi-disciplinary open access
archive for the deposit and dissemination of sci-entific research documents, whether they are pub-lished or not. The documents may come from teaching and research institutions in France or abroad, or from public or private research centers.
L’archive ouverte pluridisciplinaire HAL, est destinée au dépôt et à la diffusion de documents scientifiques de niveau recherche, publiés ou non, émanant des établissements d’enseignement et de recherche français ou étrangers, des laboratoires publics ou privés.
to environmental stresses and developmental cues
Tetiana Kalachova
To cite this version:
Tetiana Kalachova. Deciphering the role of lipid signalling in plant response to environmental stresses and developmental cues. Ecology, environment. Université Paris-Est; National academy of sci-ences (Ukraine). Institute of Bioorganic Chemistry and Petrochemistry, 2017. English. �NNT : 2017PESC1114�. �tel-01630518�
NATIONAL ACADEMY OF SCIENCES OF UKRAINE
INSTITUTE OF BIOORGANIC CHEMISTRY AND PETROCHEMISTRY
UNIVERSITÉ PARIS EST CRÉTEIL VAL DE MARNE
ÉCOLE DOCTORALE SCIENCES, INGÉNIERIE ET ENVIRONNEMENT
KALACHOVA Tetiana Anatoliivna
DECIPHERING THE ROLE OF LIPID SIGNALLING IN PLANT RESPONSE TO ENVIRONMENTAL STRESSES AND
DEVELOPMENTAL CUES
Qualification work for a degree of candidate of biological sciences (PhD)
Dissertation contains the results of own studies. All ideas, results and citations of other author‘s works have corresponding references
Supervisors: Kravets Volodymyr, professor, DSc Eric Ruelland, CR CNRS, PhD, HDR Jury: YEMETS Alla, professor, corresponding member of National Academy of Sciences of Ukraine, Institute of food biotechnology and genomics NAS of Ukraine GUIVARCH Anne, HDR, Maître de conférences, Universite Pier Marie Curie CACAS Jean Luc, HDR, Maître de conférences, Institut Jean Pierre Bourgin à Versailles (UMR 1318 INRA/AgroParisTech) TARAN Natalia, professor, Taras Schevchenko National University of Kyiv
ACKNOWLEDGEMENTS
I am grateful to the thesis committee, Anne Guivarch, Alla Yemets, Jean-Luc Cacas and Natalia Taran for critical examination of my work. Thank you for your time and commitment.
Firstly, I would like to express my gratitude to my supervisors, for their knowledge, patience and immense support.
I would like to thank Volodymyr Kravets for accepting me as a part of his department in IBOPC in Kyiv, for both guidelines and independence he gave me for this research, and for valuable advices during my entire PhD.
I would like to thank Eric Ruelland for the inspiring and efficient supervision in UPEC, Créteil. Working with you was a great pleasure and a very productive time. Thank you for pushing me forward, for being open to any kind of discussions, for patiently dealing with all my questions and for everything else.
My work benefited significantly from collaborations with other researchers. Here I acknowledge the colleagues from the Institute of Ecology and Environmental Sciences of Paris. Thank you for challenges, discussions and most importantly for your company during two years.
My sincere thanks goes to Lenka Burketova and all the members of the Laboratory of Pathological Plant Physiology of the Institute of Experimental botany AS CR in Prague. I appreciate the exceptional welcome I was granted in this team, always fruitful discussions and priceless encouragement during my last year of PhD studies.
I would also like to acknowledge the Ukrainian State fund for Fundamental Research, French embassy in Ukraine, University Paris-Est and Visegrad fund for funding the research I was doing.
Last but not least, I thank to my family, who always supports me in science and life.
CONTENT:
ABBREVIATIONS 3
INTRODUCTION 5
CHAPTER 1. Literature overview 10
CHAPTER 2 MATERIALS AND METHODS 20
2.1 Material used in the study 20
2.2. Pharmacological treatments 20
2.3. Methods concerning phospholipids analysis
2.3.1 Phospholipid radioactive labeling and lipid extraction 21 2.3.2. Thin-layer chromatography and scintillation counting 23 2.4. Methods concerning plant physiology
2.4.1 Histochemical assay 23
2.4.2. Stomatal assay 24
2.4.3 ROS visualization and measurement 24
2.4.4 Callose deposition evaluation 26
2.4.5 Pathogen assay 26
2.4.6 Root growth assay 26
2.5. Methods concerning gene expression analysis 2.5.1 RNA extraction
27 2.5.2 Transcript abundance evaluation by qPCR 27
2.5.3 Transcriptome Studies 27
2.5.4 Statistical Analysis of Microarray Data 29 2.5.5 In silico analysis of microarray data 30 2.5.6 Comparison of two sets of transcriptomic data 30
2.5.7 Data Deposition 31 31
2.6 Data analysis and statistics 31 31
CHAPTER 3 Involvement of phospholipase D and NADPH-oxidase in salicylic acid signaling cascade
32 CHAPTER 4 Basal phosphoinositide-dependent phospholipase C activity in
Arabidopsis suspension cells as a signalling hub accounting for the overlap in transcriptome remodelling by abscisic or salicylic acid
44
CHAPTER 5 Phosphatidylinositol-dependent phospholipase C and diacylglycerol kinase are involved in primary responses to flagellin in plant cells
73
CHAPTER 6 The mutations of both type III phosphatidylinositol-4-phosphate kinases ß1 and ß2 isoforms lead to altered response to auxins and cytokinins in Arabidopsis roots
108
ABBREVIATIONS
°C degree Celsius
μ micro
ABA abscisic acid
ATP adenosine triphosphate
cDNA complementary DNA
CFU colony forming units
Col-0 Columbia-0
CTAB Cetyltrimethylammonium bromide ddH20 double-distilled water
DMSO dimethyl sulfoxide DNA deoxyribonucleic acid
dNTP deoxyribonucleotide triphosphate DPI days post infection
EDS ENHANCED DISEASE SUSCEPTIBILITY
EDTA ethylenediaminetetraacetic acid
DPI diphenylene iodide
NBT nitroblue tetrazolium
SA salicylic acid
PLD Phospholipase D
ROS reactive oxygen species TLC thin-layer chromatography
FW fresh weight
g gram
GFP green fluorescent protein
MS Murashige and Skoog
OD600 optical density measured at 600 nm
p-value probability value
p35S promoter of Cauliflower mosaic virus promoter 35S
ABA abscisic acid
DAG diacylglycerol DGK diacylglycerolkinase IP3 inositol-1,4,5-triphosphate JA jasmonic acid PA phosphatidic acid PC phosphatidylcholine PE phosphatidyléthanolamine PG phosphatidylglycerol PI-4,5-P2 phosphatidylinositol-4,5-bisphosphate PI-PLC Phosphoinositide-specific phospholipases C
PI phosphatidylinositol
PI4K PI-4-kinases
PI4P Phosphatidylinositol-4-phosphate PI4P5K PI4P-5-kinases
pi4kß1ß2 Double mutant deficient in PI4Kß1 and PI4Kß2
pi4kß1ß2sid2 triple mutant deficient in PI4Kß1 and PI4Kß2 and ICS1
INTRODUCTION:
Topic actuality. Plants are sessile organisms, exposed to the environmental changes all along their vegetation cycle. These changes are considered as stresses and can be divided to biotic and abiotic ones. . To react to the wide spectrum of stimuli and adapt metabolism due to current conditions, plants have evolved a sophisticated system of signal transduction. It allows them to respond fast and switch metabolic flows according to their needs. In my thesis work I was focused on lipid signaling as a universal network, applied both in stress responses and in the development. Lipid signaling is one of the key mechanisms of plant growth and development regulation. It is based on the action of secondary transduction messengers of lipid nature, especially phosphoglycerolipids such as phosphatidic acid (PA), diacylglycerol (DGK) and phosphatidylinositols (PI). The production of these mediators is regulated by different families of enzymes, particularly phospholipases, lipid kinases and/or phosphatases. The production of phosphoinositides such as PI4P and PI-4,5-P2, results from the sequential
phosphorylation of phosphatidylinositol (PI) catalysed by PI-4-kinases (PI4K) and PI4P-5-kinases; PA can be phosphorylated into diacylglycerolpyrophosphate by PA kinase, or dephosphorylated by phosphatidate phosphatase or lipid phosphate phosphatases into DAG. PA, PI, PI4P and PI-4,5-P2 are considered as signaling mediators because of their ability to bind proteins that are regarded as downstream effectors or targets. Up today, lipid signaling system has been associated with various adaptive and developmental cues in plants; however the detailed understanding of it is still missing. In this work we will study phospholipid signalling machinery as an intermediate signalling hub in various aspects of plant life: in salicylic acid signalling during stomatal movement regulation, in setting up phytohormonal cross-talk between salicylic acid (SA) and abscisic acid (ABA), in recognition and perception of bacterial elicitors and in root morphogenesis. Our results broaden the knowledge of the molecular mechanisms of plant adaptation to environmental changes and can be used for increasing plant resistance based on their natural capacities.
Connection with other scientific programs and topics. Dissertation work was held in the department of molecular mechanisms of plant metabolism regulation of the Institute of bioorganic chemistry and petrochemistry NAS of Ukraine and in the Institute of ecology and environmental sciences if Paris (France). The work was supported by the state funding program «Role of phospholipases and antioxidant systems in hormonal and stress signalling» (№ 0110U000378), French state grant for doctoral studies under double supervision № 861849F (2014-2016) and fellowship from International Visegrad Fund (2016-2017).
Aims and objectives. The aim of the work was to investigate the role of phosphatidylinositol-dependent phospholipases and lipidkinases in signal transduction in plant cells during development an in the conditions of modeled biotic stress (action of stress-associated phytohormones and bacterial elicitors). 1. Investigate the role of lipid signaling in the regulation of SA-mediated stomatal movement in Arabidopsis
2. Decipher the impact of phytohormones (ABA and SA ) and bacterial peptide flagellin on the lipid signaling activation in Arabidopsis suspension cell cultures 3. Evaluate the involvement of secondary messengers of lipid origin (phosphoinositides and phosphatidic acid) in the transcriptome remodeling induced in Arabidopsis suspension cells induced by salicylic and abscisic acid.
4. Investigate the role of phospholipases and diacylglycerlokinases in the primary responces of plant cells to flagellin treatment
5. Estimate the role of phosphatidylinositol-4-kinases in the transduction af auxin and cytokinin signal in Arabidopsis root morphogenesis
Object of study – balance of minor phospholipids regulated by phospholipases and lipidkinases in Arabidopsis plants and suspension cell cultures, transcriptome profile changes, induced by stress-associated phytohormones, and phytohormonal regulation of root morphogenesis
Methodology – radioactive labeling of phospholipids, thin layer chromatography, gene expression analysis (total transcriptome analysis, real-time PCR), measurement of production of reactive oxygen species and callose deposition, root architecture analysis, gravitropic assay, bacterial assay.
Scientific novelty of the obtained results. A novel signalling cascade induced by SA induces in guard cells leading to stomatal closure was revealed. The intermediate stages of the process are activation of lipid signalling enzymes, especially of PLDs, that results in the synthesis of PA, leading to the subsequent induction of superoxide production by NADPH oxidases, mainly RbohD. The findings extend the knowledge about molecular mechanisms of salicylic acid signalling network and lipid metabolism in plant cells. An important overlap between ABA and SA responses was firstly found and characterized in Arabidopsis guard cells and cells in suspension culture, that to date has not been investigated. Our data indicate the existence of a special group of genes that are responsive to both ABA and to SA, but also to inhibitors of PI-PLC pathway. This suggests a pivotal role for PI-PLC in the control of hormone responses in plants. A new model of flagellin perception in plant cells is proposed; this model not only shows the role of membrane phospholipids, but also that their turnover is regulated by PI-PLC and DGK5 pathways. We firstly showed the connection of PI4K activity with auxin and cytokinin effects during root morphogenesis and gravitropism, pointing out an impact of phosphoinositides at the polar transport of growth-promoting hormones as an important mechanism of root morphogenesis. Practical application. Obtained results contribute to the modern knowledge about molecular mechanisms of the realization of biological action of phytohormones in plant cells that can be used in biotechnology and agriculture. The findings broaden the existing understanding of the role of secondary messengers of lipid origin in cell metabolism regulation in response to stresses and during perception of biologically active compounds. The results can be used for teaching programs in
bioorganic chemistry, biochemistry, molecular biology and plant physiology and also serve as the basis for further research
Personal contribution. Investigation of phospholipid turnover in different model systems, gene expression analysis, root architecture studies, guard cells movement studies, biochemical tests, literature survey as well as bioinformatics analysis, statistical data treatment and results summarizing were performed personally by the applicant in the Institute of bioorganic chemistry and petrochemistry NAS of Ukraine, Institute of ecology and environmental sciences if Paris (France) and Institute of experimental botany AS CR (Czech Republic). Experimental data, presented in this dissertation and published in articles with co-authors were obtained with the direct participation of the author. The aims and objectives were defined in cooperation with supervisors: DSc, professor Volodymyr Kravets and HDR, PhD Eric Ruelland.
Approbation of the results: Dissertation materials were presented in 15 conferences: «Plant organellar signaling - from algae to higher plants» (Primosten, Croatia, 2011), VII-th International conference ―Regulation of plant growth, development and productivity‖ (Minsk, Belorus, 2011), conferences of the Institute of bioorganic chemistry and petrochemistry NAS of Ukraine (Kyiv, Ukraine, 2011 and 2012), young scientists conference ―Plant biology and biotechnology‖ (Bila Tserkva, Ukraine, 2011). VIth International conference of soybean genetics and genomics (Hyderabad, India, 2012), international congress EPSO/FESPB «Plant Biology Congress» (Freiburg, Germany, 2012), Annual main SEB Meeting (Salzburg, Austria, 2012), III International Symposium: Intracellular signaling and bioactive molecules design» (Lviv, Ukraine, 2012), annual meeting of the Society of Experimental Botany ―Oxidative stress and cell death in plants: mechanisms and implications‖ (Florence, Italy, 2013), interdisciplinary conference ―Biologically active substances and materials: fundamental and applied aspects of production and implementation‖ (Novy Svit, AR Krimea, Ukraine, 2011, 2013, 2014), 26th international conference on Arabidopsis research (ICAR) (Paris, France, 2015)
Publications. The results were published in 25 scientific articles, among which there are 6 articles in international per-reviewed journals.
Structure of the dissertation: the manuscript consists of 6 chapters, is written in 141 pages, illustrated with 40 figures and 6 tables.
CHAPTER 1 PHOSPHOLIPID SIGNALING MACHINERY IN PLANTS Plants are sessile organisms, exposed to the environmental changes all along their vegetation cycle. To react to the wide spectrum of stimuli (either environmental or developmental) and adapt their metabolism due to current conditions, plants have evolved a sophisticated system of signal perception and transduction. It allows them to respond fast and to switch metabolic flows according to their needs. In my thesis work, I was focused on lipid signaling as a universal network, applied both in stress responses and in the development. Environmental stresses can be divided into abiotic ones -such as drought or temperature- and biotic ones such as pathogen infections. Classical responses to pathogen attack include primary reactions that occur within minutes (burst of Ca2+ and reactive oxygen species (ROS), activation of mitogen activated protein kinases (MAPkinases), and secondary reactions realized via deep metabolic changes. These include transcriptional alterations, changes in hormonal balance, accumulation of antimicrobial compounds and of secondary metabolites.
To realize metabolic rearrangement from growth/development to stress responses all phytohormones act in a complex cooperation. Especially, salicylic acid (SA) and abscisic acid (ABA) are known to mediate plant adaptation to biotic and abiotic stress conditions. SA is associated with immunity and also involved in the hormonal balance regulation, meaning that SA concentration influence concentration of and/or response to other phytohormones. ABA acts mostly in abiotic stress conditions but shares plenty of primary downstream events with SA (like oxidative burst, Ca2+ oscillations etc.). However, the long-term metabolic changes are very specific for each different stress condition, and this specificity is reached by a complex cross-talk between hormones at the signalling level. Phospholipid signalling system was shown to play a role in SA signalling (Janda et al. 2013, Krinke et al. 2007, Krinke et ak. 2009, Janda et al. 2015).
―Lipid signaling‖ means the signaling realized via lipid-derived secondary messengers produced through the action of phospholipases or lipid kinases on
membrane phospholipids. There are different classes of messengers, such as phosphatidic acid (PA), diacylglycerol (DAG), DAG-pyrophosphate (DAG-PP), lysophospholipids, free fatty acids (FFAs), oxylipins, phosphoinositides and inositol polyphosphates (fig.1.1.A) (Hou et al., 2016, Pokotylo et al., 2014)). The production of these mediators is regulated by different families of enzymes, particularly phospholipases, lipid kinases and/or phosphatases (Fig. 1.1.B). Phospholipase A (PLA) catalyses the hydrolysis of ester bonds at the sn-1 and/or
sn-2 positions of glycerol, thus liberating a free fatty acid (FFA) and a
lysophosphoglycerolipid. PLAs that act specifically at the sn-1 or the sn-2 positions are named PLA1 (EC 3.1.1.32) or PLA2 (EC 3.1.1.4) respectively (Ryu,
2004, Scherer et al., 2010). The PLC group comprises two groups of enzymes. A phosphoinositide-specific PLC (PI-PLC, EC 3.1.4.11) hydrolyses phosphorylated phosphatidylinositols (that are named phosphoinositides) such as phosphatidylinositol-4,5-bisphosphate (PI-4,5-P2) into hydrophobic diacylglycerol
(DAG) and soluble inositol-1,4,5-triphosphate (IP3). IP3 can be phosphorylated
into higher phosphorylated forms by inositol kinases (IPK). Phosphatidylinositol-4-phosphate (PI4P) may also be an in vivo substrate of PI-PLC in plants (Delage et al., 2012a). The non-specific PLCs (NPC, EC 3.1.4.3) constitute another group of enzymes that hydrolyze structural phosphoglycerolipids such as phosphatidylcholine (PC), phosphatidylethanolamine (PE) or phosphatidylglycerol (PG), into the corresponding phosphorylalcohol and DAG (Pokotylo et al., 2013). DAG can serve as a substrate for diacylglycerol kinases (DGK, EC 2.7.1.107) to produce phosphatidic acid (PA). PA can also be produced via the direct action of phospholipase D (PLD, EC 3.1.4.4) which hydrolyses membrane phospholipids (PC, PE, PG) to PA and a free head group. In the presence of primary alcohols, such as 1‐butanol or ethanol, PLD also has the unique ability to transfer phosphatidyl group to a primary alcohol to form phosphatidylalcohol at the expense of PA. This is the so-called transphosphatidylation reaction. Recent studies indicate that PLD and PA play important and complex roles in plant both biotic and abiotic stress tolerance (Munnik and Testerink, 2009).
Figure 1.1
Phospholipid signaling pathways, the structure of phosphoipids (A) and metabolic pathways (B). Each phospholipid class is defined by the nature of its polar head. PI: phosphatidylinositol; PI4P: phosphatidylinositol-4-phosphate; PI3P: phosphatidylinositol-3-phosphate; PI4,5P2:
phosphatidylinositol-4,5-bisphosphate; PI3,5P2: phosphatidylinositol-3,5-bisphosphate; DAG:
diacylglycerol; IP3: inositol triphosphate; IP6: inositol hexakisphosphate; PA:
phosphatidic acid; DGPP: diacylglycerolpyrophosphate; FFA: free fatty acid; PI4KIII: type III phosphatidylinositol-4-kinase; PI3K: phosphatidylinositol-3-kinase; PI3P5K: phosphatidylinositol-3-phosphate-5-kinase; PI4P5K: phosphatidylinositol-4-phosphate-5-kinase; PI-PLC: phosphoinositide-specific phospholipase C; NPC: non-specific phospholipase C; DGK: diacylglycerol kinase; IPK: inositol phosphate kinase; LPP: lipid phosphate phosphatase; PAP: PA-phosphatase; PAK: PA kinase; PLA: phospholipase A; PLD: phospholipase D. Modified from (Janda et al., 2013).
Several classes of kinases and phosphatases play a crucial role in lipid signaling pathways. The production of phosphoinositides such as PI4P and PI-4,5-P2, results from the sequential phosphorylation of phosphatidylinositol (PI)
catalyzed by PI-4-kinases (PI4K, EC 2.7.1.67) and PI4P-5-kinases (PI4P5K, EC 2.7.1.68). PI can also be phosphorylated into phosphatidylinositol 3-phosphate (PI3P) by a PI-3-kinase (PI3K, EC 2.7.1.137) and PI3P can be further phosphorylated into PI-3,5-P2 (Delage et al., 2012a). PA can be phosphorylated
into diacylglycerolpyrophosphate (DGPP) by PA kinase (PAK), or dephosphorylated by phosphatidate phosphatase (PAP, EC. 3.1.3.4) or lipid phosphate phosphatases (LPP, EC 3.1.3.76) into DAG. DGPP can also be a substrate of LPPs (Pleskot et al., 2012). The inositol-linked phosphate groups within either soluble polyphosphate-inositol or lipid phosphoinositides can be hydrolysed by myo-inositol polyphosphate-phosphatases (EC 3.1.3.57) and PI-phosphatases (EC 3.1.3.64/66) that are more or less specific for the soluble or lipid inositol forms (Williams et al., 2005).
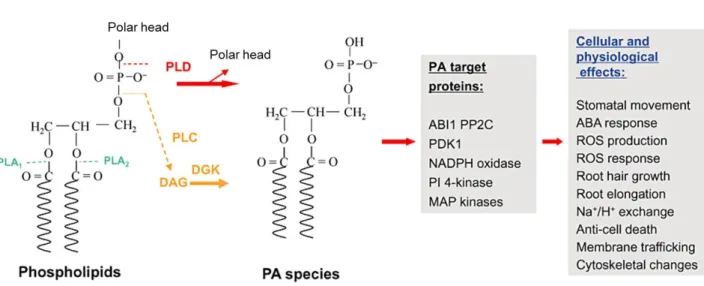
Various molecules generated during membrane phospholipid transformation are considered as signaling mediators because of their ability to bind proteins that are regarded as downstream effectors or targets (fig.1.2). All above mentioned enzymes act sequentially, quickly converting intermediate products to the other ones, thus being a fast switch between cellular signaling systems. Phosphoinositides and phosphatidic acid are emerging as novel multifunctional secondary messengers in plant cells. They both belong to minor phospholipid components in plasma membrane. For example in Arabidopsis leaves PA content is about 0.5-1.5 nanomoles per milligram of dry weight or 2-5% of total phospholipids; different forms of phosphoinositides do not exceed 1% of phospholipids in intact cells (Okazaki and Saito, 2014). However, the distribution of these phospholipids in membrane is heterogeneous: PA and phosphoinositides have been reported to form clusters that have a special curvature and charge. These clusters or so-called microdomains favors the binding of target proteins from cytoplasm and further catalytic reactions, for instance resulting in cytoskeleton
rearrangement (Pleskot et al., 2014). The structural requirements of protein-phospholipid interactions are a subject of intense studies nowadays. A common feature of the binding region in target proteins of PA is the presence of positively charged amino acid residues such as lysine and arginine, which will form the hydrogen bonds with polar head of the phospholipids. However, the fatty acid composition of PA was also shown to determine the specificity in binding with the particular target proteins, so the conformation of PA-binding domain is more complex and unique (Testerink et al., 2004). PA fatty acid composition corresponds to that in the structural precursor lipids and varies with the way of its production – directly via PLD activity from PC/PE/PG or by PI-PLC from phosphoinositides with further phosphorylation of DAG by DGKs.
Figure 1.2
The sites of phospholipid hydrolysis by phospholipase A, C, D and the targets of PA identified in plants
PLD hydrolyses the terminal phosphodiester bond of glycerophospholipids to generate PA and a free head group. PLC hydrolyses the first phosphodiester bond to generate a phosphorylated head group and DAG. DAG can be phosphorylated to PA by DGK. PA molecular species refer to PAs with different fatty acid chains in the sn‐1 and sn‐2 positions. Several PA protein targets have been identified in plants and the PA‐protein interactions are involved in plant response to hyperosmotic stresses. Modified from (Hong et al., 2010)
Figure 1.3 Arabidopsis diacylglycerolkinases family.
Protein structures of members of the DGK family of Arabidopsis thaliana. Characteristic regulatory domains of typical DGK isoforms are indicated. The clusters are based on amino acid homology. AtDGK3, 4, 6 and 7 are in cluster II, AtDGK5 is in cluster III (Gómez-Merino et al., 2004). The putative carboxyterminal calmodulin-binding domain is in a splice variant of AtDGK5. In addition to the domains indicated, there are two putative Ca2+ binding EF hand domains between the C1 domains and the catalytic domain in AtDGK1 (Katagiri et al., 1996). AtDGK1-7 correspond to At5g07920, At5g63770, At2g18730, At5g57690, At2g20900, At4g28130, At4g30340, respectively. Modified from (Arisz et al., 2009).
―Phosphoinositide‖ refers to phosphorylated forms of PI, including phosphatidylinositol-4-phosphate and phosphatidylinositol-4,5-bisphosphate. PI4 can be converted to PI4P by PI-kinases and then phosphorylated by PI4P-5-kinases to PI-4,5-P2. Both PI4P and PI-4,5-P2 can be in vivo substrates of plant phospholipases C or can be recognized by other target proteins that have a special phosphoinositide-binding domainess, like the pleckstrin homology (PH), FYVE, HEAT, C2 and Phox homology (PX) domains (Catimel et al., 2008). These domains are more or less specific for phosphoinositides as some can also bind to other anionic phospholipids or proteins. The Arabidopsis thaliana genome encodes
ca. 168 proteins containing at least one of these domains (Janda et al., 2013). Many
of these proteins are involved in signal transduction or intracellular trafficking. For most of these proteins, however, it has yet to be established whether, and how, they act in hormonal signal transduction and response to stress.
In Arabidopsis thaliana genome there are 4 type III PI4Ks that are classified into - and -subtypes: PI4KIII1, PI4KIII2, PI4KIIIβ1 and PI4KIIIβ2 (fig. 1.4).
The α-isoforms contain a PH-domain that binds to PI4P, the product of the reaction (Heilmann and Heilmann, 2015).
Figure 1.4
Arabidopsis PI4-kinases. The AGI locus identifiers for the corresponding Arabidopsis genes
are listed in parentheses. Modified from (Heilmann and Heilmann, 2015).
Concerning the cellular localization, PI4P was found to localize in the Golgi and trans-Golgi-network as well as in the plasma membrane; PI-4,5-P2 was only observed in the plasma membrane (Santiago-Tirado and Bretscher, 2011, Simon et al., 2014). The localization of different phosphoinositides during their interconversion it is likely to take place within multiple membranes. Certainly, the enzymes involved in phosphoinositides interconversion have very specific cellular localization: PI is generated by PI-synthases in the endoplasmic reticulum and Golgi apparatus, PI4-kinases are localized in the trans-Golgi-network and PI4P-kinases in the plasma membrane (Tejos et al., 2014a, Heilmann and Heilmann, 2015).
Phosphoinositides participate in numerous processes in cells, especially as a part of hormonal cascades. For instance, increasing PIP2 levels (by using the
PI-PLC inhibitor U73122) in control or in ABA-treated cells with high PI levels, decreased the outward-rectifying potassium channel activity (NtORK) (Ma et al., 2009). Phosphoinositides regulate auxin-mediated cell polarity in Arabidopsis root tip (Tejos et al., 2014a).
The impact of phosphoinositides at gene expression is an actively studied research topic. The use of pharmacological agents allowed defining the genes whose basal expression is controlled by phosphoinositides and basal activity of PI-PLC; most of these genes were found to be involved in response to SA (Kalachova et al., 2015).
The use of specific inhibitors of PI-PLC (U73122 or edelfosine), PI4K and PI3K (wortmannin) and DGK (R59022) allowed defining different aspects of
involvement of phosphoinositides at transcriptional remodelling induced by phytohormones in plant cells. The clusters of SA-responsive genes dependent on phosphoinositides are summarized in figure 1.5. SA activates type III phosphatidylinositol-4-kinase (PI4KIII) (Krinke et al., 2007). This, maybe coupled to the inhibition of PI-PLC (Ruelland et al., 2014), leads to an increase in phosphatidylinositol-4-phosphate (PI4P) and phosphatidylinositol-4,5-bisphosphate (PI-4,5-P2). This increase in phosphoinositides controls the response
(inhibition or induction) of a first pool of genes (Krinke et al., 2007). Another pool of SA-responsive genes is under the control of PLD (Krinke et al., 2009). Interestingly, some PLD use PI-4,5-P2 as cofactor, and there is an overlap between
the pool of genes whose SA response is controlled by phosphoinositides and that of genes whose SA response is controlled by PLD. Therefore, a part of the action of phosphoinositides on gene expression may rely on PLD, which is illustrated by ―?‖ above the arrow in figure 1.5. A third pool of SA-responsive genes consists of genes for which the effect of SA can be mimicked by the inhibition of the production of PI‐PLC products (by inhibiting either PI-PLC activity or the formation of PLC substrates). One possible explanation is that SA inhibits PI-PLC. This, on the one hand, may participate in the increase of phosphoinositides, but on the other hand it will also result in a decrease of PI-PLC products. The regulation of gene expression by the products of the basal PI‐PLC will thus be relieved. For instance, a gene down-regulated by products of the PI-PLC pathway will have this inhibition relieved in presence of SA: it will be induced by SA (Ruelland et al., 2014).
Finally, a basal PI-PLC pathway exists in resting cells. The products of this basal PI-PLC regulate the expression of some genes (Djafi et al., 2013).
Figure 1.5
Working model of the phospholipase pathways action on the control of gene expression by SA.
Gene pool 1: is regulated by SA that activates type III phosphatidylinositol-4-kinase (PI4KIII), maybe coupled to the inhibition of PI-PLC, thus leading to an increase in phosphatidylinositol-4-phosphate (PI4P) and phosphatidylinositol-4,5-bisphosphate (PI4,5P2)(Krinke et al., 2007). Gene pool 2: is under a control of SA that activates PLD thus inducing PA production. Some PLDs use PI4,5P2 as cofactor, so
there is an overlap between the pool of genes whose SA response is controlled by phosphoinositides and that of genes whose SA response is controlled by PLD (―?‖ above the arrow indicates that a part of the action of phosphoinositides on gene expression may rely on PLD)(Krinke et al., 2009). Gene pool 3: consists of genes for which the effect of SA can be mimicked by the inhibition of the production of PI‐ PLC products (by inhibiting either PI-PLC activity or the formation of PI-PLC substrates (Ruelland et al., 2014)
The research groups where I performed my PhD experimental work had previously worked on a double mutant that is defective in the two PI4K genes. In Arabidopsis, PI4K1 is recruited by the GTP bound Rab4b GTPAse. RabA4b and PI-4K1 localize to budding secretory vesicles in the trans-Golgi network and to secretory vesicles en route to the cell surface. A pi4k12 double mutant produces
secretory vesicles with highly variable sizes indicating that PI4K1 and 2 regulates secretory vesicles size (Antignani et al., 2015). PI4Ps massively accumulate at the plasma membrane where it creates an unique electrostatic signature that controls the localization and function proteins such as of the polar auxin transport regulator PINOID (Simon et al., 2016). Surprisingly, it was shown that pi4kIIIβ1β2 had a constitutively high SA level, resulting in the constitutive expression of SA responsive genes such as PR-1. Besides this double mutant was dwarf. The pi4kIIIβ1β2 plant was crossed with the sid2 mutant, that is altered in ISOCHORISMATE SYNTHASE1. The resulting pi4k12sid2 triple mutant no
longer accumulated SA and regained a normal rosette stature. Not only our results showed that the dwarfism in pi4kIIIβ1β2 was due to the high SA (Sašek et al., 2014), but it established that PI4Ks not only have a role downstream to SA, but they also have a role in the regulation of SA level.
In this work we will study phospholipid signalling machinery as an intermediate signalling hub in various aspects of plant life: in SA signalling during stomatal movement regulation (chapter 3), in setting-up the phytohormonal cross-talk between SA and ABA (chapter 4), in recognition and perception of bacterial elicitors (chapter 5) and in root morphogenesis (chapter 6).
CHAPTER 2 MATERIALS AND METHODS
2.1 Material used in the study
Arabidopsis thaliana ecotype Columbia-0 was used as wild-type and mutant
lines were obtained from The Nottingham Arabidopsis Stock Centre (NASC):
rbohD (SALK_070610), rbohF (SALK_059888), rbohDF, fls2 (Zipfel et al., 2004), bak1-4 (SALK_116202), bik1 (SALK_005291C), dgk5.1
(SAIL_1212_E10), NahG (Lawton K et al., 1995), pi4kß1ß2 (SALK_0404799 X SALK_098069), pi4kß1ß2sid2 (Šašek et al., 2014)
For stomatal movement assays, 4- to 5-week-old plants were used. Seeds were sown in soil and cold-treated at 4°C overnight. Plants were grown under 14-h-light/10-h- grown in controlled growth chambers at 22°C with a 16 hr photoperiod.
Seedlings were grown in vitro in liquid medium 10- and 14-days. Seeds were surface sterilized by hypochlorite:ethanol (1:4, v:v) solution and grown in 24-well plate in MS/2 medium supplied with vitamins and 5% (w:v) sucrose, at 22°C under 14 h/10 h light cycle. After 7 days of cultivation, cultivation media was changed to fresh one.
Arabidopsis thaliana Col-0 suspension cells were cultivated in Gamborg B5
medium (Khalys S.A., France), at 22°C under continuous light at 100 µE intensity, as in (Krinke et al., 2009). Suspension cultures were sub-cultivated every seventh day and treatments described below were performed 7 days after sub-culture.
Pseudomonas syringae pv. tomato DC3000 was used as overnight culture
grown at 28°C on Luria-Bertani (LB) medium containing rifampicin 50 μg mL-1.
2.2. Pharmacological treatments
ABA was prepared at 10 mM stock solution in tertiary butanol and added at 10 µM final concentration in 7 mL of suspension cells. As a control, cells were treated with only 0.1 % (v/v) tertiary butanol. SA was prepared at 50 mM stock
solution in water and added at 250 µM final concentration in 7 mL of suspension cells. Peptide flg22 derived from the flagellin N-terminus of Pseudomonas sp. (QRLSTGSRINSAKDDAAGLQIA, Tebu-Bio, France) was diluted to 0.2 mM stock solution in water and added at 0, 0.01, 0.1 and 1µM final concentrations to 7 mL of suspension cells. PI-PLC inhibitor U73122 and its inactive analogue U73433 were diluted in DMSO:tert-butanol (27/53, v/v) to obtain 1mM stock solutions and used at the final concentrations of 10, 50 and 100 µM. Diacyglycerolkinase inhibitor I (R59022) stock solution was prepared as 1mM in 0.1% EtOH and used at 25 and 50 µM, edelfosine was dissolved in water and used at 25, 75, 150 µM; LaCl3 (0.1mM, 1mM, 10mM); EGTA (0.5mM, 1mM, 2mM).
1-butanol as an alternative substrate for PLD was used at final concentration 0,8%,
tert-butanol was used as a negative control. As a control, cells were treated with
equal amount of solvents.
2.3. Methods concerning phospholipids analysis
2.3.1 Phospholipid radioactive labeling and lipid extraction
Suspension cells were labelled with 37 MBq L-1 33Pi-orthophosphate per 7
mL suspension (circa 700 mg FW) during the specified time according to the procedure previously described by Krinke et al., 2007 (Krinke et al., 2007). Cells were dried from the cultivation media and dissolved in H50 buffer (175mM mannitol, 0.5mM CaCl2, 0.5mM K2SO4, 50mM Hepes, pH 8.9), 1g of cells to 10mL
buffer. Cells were equilibrated for 3h at a rotary shaker before theatment. Lipids were extracted by adding into the flasks with 7 mL of equilibrated cells 2.14 volumes of ice-cold chloroform:methanol:37% (v/v) HCl (50:100:1.5, v/v). The mixture was transferred into tubes, and a two-phase system was induced by the addition of 0.7 volume of chloroform and 0.7 volume of 9% (w/v) NaCl in water. The tubes were vigorously shaken and left at 4°C overnight for two-phase formation. The upper phase was discarded and the lower organic phase was
evaporated under nitrogen stream. Remaining lipids were dissolved in chloroform and stored at−20◦C until further use (Ruelland et al., 2002).
As for Arabidopsis 14-days-old seedlings (see 2.1 for growth conditions details), cultivation media was replaced by 100mM Tris-HCl buffer, pH 6.15, and plates with seedlings were kept for 2 hr at 22°C for pre-equilibration and then labelled with 33Pi for 1h. Flagellin was added to the wells and the reaction was stopped by adding 4mL of hot isopropanol to approximatively 400 mg of plant tissues followed by grinding in Potter‘s homogenizer with 3 volumes of chloroform:methanol:37% (v/v) HCl (50:100:1.5, v/v). The mixture was transferred into tubes, and a two-phase system was induced by the addition of 1.25 volumes of chloroform and 1.25 volumes of 9% (w/v) NaCl in water. The tubes were vigorously shaken and left at 4°C overnight for two-phase formation. The lower organic phase was evaporated under nitrogen stream, remaining lipids were dissolved in chloroform and stored at -20 °C until further use (modified from Folch
et al. (Folch et al., 1957) and Drobak et al (Drøbak et al., 2000).
Adult leaf tissues (detached leaves from 4-5week old plants) were incubated for 2h in 100mM Tris-HCl buffer pH 5.7 to recover from wounding and labeled in the dark with 37 MBq [33P] orthophosphate per 200 mg FW in 100 mM Tris-HCl buffer (pH 6.15) for 14 h at 25◦C. After incubation, the tissues was washed from non-incorporated [33P]orthophosphate (Kalachova et al., 2013). To determine PLD activation in leaf tissues, leaf discs were incubated with 0.8% 1-butanol in Tris-HCl buffer (pH 6.15) for 1 h in the dark prior to treatment. All studied inhibitors were added 30 min prior to treatment. After reaction, the samples were fixed in liquid nitrogen. Control samples were incubated with the respective solvents (Munnik et al., 1996). Reaction was stopped by freezing in liquid nitrogen and lipids from approximately 300 mg of leaf tissues were extracted by adding 3.75 mL CHCl3/CH3OH/HCl (50:100:1, v/v) to each sample. A two-phase system was
prepared by adding CHCl3 and 0.9% (w/v) NaCl. Samples were vortexed for 15 s
CHCl3/CH3OH/1M HCl (3:48:47, v/v), dried under nitrogen gas stream and stored
at−20◦C until further use (Munnik et al., 1996).
2.3.2. Thin-layer chromatography and scintillation counting
Lipids were dissolved in 100 μL CHCl3/CH3OH (2:1, v/v). Then samples (5
μl) were analyzed on thin-layer chromatography (TLC) plate (200 × 200 × 0.25 mm, Merck, Germany). To compare different samples, equal amounts of radioactivity were loaded on the same plate. Structural phospholipids and phosphatidic acid were separated in the acid solvent system composed of chloroform:acetone:acetic acid:methanol:water (10:4:2:2:1 [v/v/v/v]) (Lepage, 1967). Phosphoinositides were separated in the alkaline solvent system composed of chloroform:methanol:ammonia solution (5% [w/v]; 9:7:2 [v/v/v]). The TLC plates were soaked in potassium oxalate solution before heat activation (Munnik et al., 1994). Lipids were spotted by ATS4 automatic sampler (CAMAG). Radiolabeled spots were quantified by autoradiography using a Storm phosphorimager (Amersham Biosciences). Separated phospholipids were identified by co-migration with authentic non-labelled standards visualized by primuline staining (under UV light). For the evaluation of PLD activity, the chromatography was performed using the organic upper phase of ethyl acetate/iso-octane/acetic acid/H2O (12:2:3:10, v/v) mixture as developing solvent. [
33
P] phospholipids were visualized on TLC plates by autoradiography on X-ray film Retina XBM (Ukraine-Germany). Spots of equal areas were scrapped off and the radioactivity was quantified by liquid scintillation counting with SL-8 cocktail on Rack Beta 1219 counter (Wallack, Turku, Finland) (Kravets et al., 2010).
2.4. Methods concerning plant physiology 2.4.1 Histochemical assay
Superoxide formation was visualized in histochemical assay with Nitro Blue Tetrazolium (NBT, Sigma-Aldrich, N6876). All the reagents in the NBT staining procedure were prepared in a 100 mM Tris-HCl, pH 6.15. A 1-mL syringe with no
needle was used to pressure infiltrate a spot area on one leaf half. For NBT staining, leaves were detached at 5, 60, and 120 min after infiltration and then were vacuum infiltrated with 10 mM NaN3 in 10 mM phosphate-potassium buffer pH
6.15 and immersed in 2 mL of the same buffer containing 0.1% (w/v) NBT at room temperature for 30 min. The blue precipitates of reduced NBT (formazan) were visualized after boiling the leaves in 96% (v/v) ethanol for 10 min (Sang et al., 2001b).
2.4.2. Stomatal assay
Stomatal assay was performed according to Melotto et al. with modifications (Melotto et al., 2006). Fully expanded detached young leaves were kept in 100mM Tris-HCl buffer, pH 6.15 under white light for 2 h to open stomata (abaxial side touching the solution) and then transferred to the same buffer solution with chemicals for 30 min (salicylic acid, 1-butanol, diphenylene iodide (DPI, Sigma-Aldrich, D2926), hydrogen peroxide or 4-hydroxybenzoic acid). Then, leaf epidermis was observed under a microscope (Zeiss Primo Star) and pictures of randomly chosen 5 regions per leaf were taken. The width of the stomatal aperture was measured using the AxioVision 2008 software. Three leaves were observed for one plant, each variant consisted of 12 leaves minimum. Experiments were repeated three times with the same results.
2.4.3 ROS visualization and measurement
For evaluation of ROS production, 7-day-old Arabidopsis thaliana suspension cells (Col-0) were washed and equilibrated for 3 h in agitation in Erlenmeyer flasks in assay buffer (10 mM Tris-HCl, 175 mM mannitol, pH 7.2). Then cells were transferred to 96-well plate (black, 175 µL of cells per well) and labeled with H2DCFDA (5.8 M) for 15 min. flg22 was added by dispenser in Tecan microplate reader and well fluorescence was measured in kinetics for 6h every 2 min (180 measure points). Measure parameters: sensibility: 35 (and 50: optional), wave length: emission =480 nm, reception = 528 nm
Confocal fluorescence images were acquired using an IX81 inverted Olympus microscope equipped with a DSU spinning disk confocal system (Olympus France, RUNGIS, France), coupled to an Orca R2 CCD camera (Hamamatsu Corporation, Japon). Observations were performed with a 40 x objective (ph2 NA 0.6 LUCPlanFLN). Red fluorescence of chlorophyll was observed with an U-MNG2 filter offering band pass filtering of 530-550 nm for excitation and 590-800 nm for emission, while GFB green fluorescence was by a cube filter U-MWIBA3 with a band pass filtering of 460-495 nm for excitation and 510-550 for emission.
Cells images were observed by acquiring axial z stacks of pseudo-confocal images (30 µm from the base to the top, with a step of 2 µm). Image processing was executed using the ImageJ software (Schneider et al., 2012). Residual blurring were removed by spatial deconvolution: PSF were calculated using the ImageJ's plugin PSF Generator (Richards and Wolf algorithm) (Griffa et al., 2010) and the deconvolution, properly speaking, was performed using the Richardson-Lucy algorithm implemented into the DeconvolutionLab ImageJ's plugin (Vonesch and Unser, 2008) (15 iterations). These two last freeware programs are provided by the Biomedical Imaging Group of the EPFL (Ecole Polytechnique Fédérale de Lausanne) Switzerland.
For assay in seedlings, Arabidopsis plants were cultivated for 10 days in 14h/10h light, 22C in liquid MS media supplemented with 0.5% (w/v) sucrose and vitamins, pH 5.7, in a 96-well plate (1 seedling per well). Cultivation media was replaced by 200 µL of assay solution (50 mM TRIS-HCl, pH 8,5 buffer solution containing 70 µg.mL-1 luminol (09253 Sigma-Aldrich), 40 µg.mL-1 horseradish peroxidase and 0.1µM of flg22). Relative luminescence was measured during 1h with 2-min interval. Every well was measured separately and the data from 12 independent measurements were used in one set of experiments.
2.4.4 Callose deposition evaluation
For callose deposition visualisation, 10- to 14-days-old seedlings were exposed to 1 µM of flg22 for 24 h. Plant tissues tissue were fixed in the solution of ethanol : glacial acetic acid (3:1, v/v). The solution was replaced 1 to 2 times until the leaves were ―decoloured‖ (white without chlorophyll). Rehydratation was held for 2 hrs in 70% (v/v) ethanol followed by 2 hours in 50% (v/v) ethanol, 2 hrs in 30% (v/v) ethanol and overnight incubation in distilled water. Staining was performed by incubation at least 4 hours in 150 mM K2HPO4,pH 9.5, containing
0.01 % (w/v) aniline blue (Sigma-Aldrich; #415049). Microscopy was done in 50 % (v/v) glycerol on fluorescence ApoTome2 microscope, image analysis was made using ImageJ software.
2.4.5 Pathogen assay
For pathogen assay Arabidopsis plants were grown for 14 days on one-half strength MS medium solidified with 0.8 % (w/v) plant agar in deep Petri plates (100 mm × 25 mm, 8-12 seedlings per plate) at 22°C with 14 h light/10 h dark photoperiod. Overnight culture of Pseudomonas syringae pv. tomato DC3000 was cultivated at 28°C on Luria-Bertani (LB) medium containing rifampicin 50 μg mL
-1
. Bacteria were resuspended in sterile distilled H2O containing 0.025 % Silwet
L-77 up to concentration 5X10⁶ CFU*mL-1 (corresponds to OD600=0.01). Forty mL
of bacterial suspension was flooded to one plate, incubated for 2 min at room temperature and removed. After 1 h, one plate was used to measure CFU for 0 dpi, the measurements were also taken at 3 and 5 dpi. Internal bacterial populations were evaluated from 3 biological replicates, each replicate represented a pooled sample of 4 independent seedlings from a single experiment grown in a single Petri dish. For bacterial population evaluation, seedlings were surface-sterilized for 3 min in 5% (v/v) H2O2, washed 3 times with sterile distilled water, collected to
Eppendorf tubes with 1g ceramic beads and 1 mL of 10mM MgCl2 and
homogenized by FastPrep homogenizer (2-3 cycles of 25 s/5.5 m*s-1). Serial dilutions were made up to 10-6 and put all onto agar plates with LB media
supplemented with 50µM rifampicine for incubation at 26°C. After two days, the colonies were counted and the values were normalized as CFU*mg-1 of total weight of inoculated seedlings (modified from (Ishiga et al., 2011).
2.4.6 Root growth assay
For root assays, plants were grown in square plates on 0.5 MS basal salt medium, pH 5.7 (Duchefa), supplemented with 0.5 g*L-1 MES and 8 g*L-1 agar. Seeds were sterilized with 1.5% sodium hypochlorite and stratified for 3 d at 4°C. Plates were placed vertically under continuous light (100 µmol*m-2*s
-1
) at 22°C for 3 d and then seedlings were transferred to new plates to assess root growth. Positions of root tips were marked 2, 4 and 7 d after transfer. Primary root length was measured manually using ImageJ software (Schneider et al., 2012).For light microscopy, whole roots excised from seedlings were directly observed under differential interference contrast illumination using ApoTome apparatus and AxioVision software (Zeiss, Oberkochen, Germany).
For gravitropic assay seedlings were grown the same as for the root assay. After 7 days of seedlings growth, vertical plates were turned to 90° to induce gravitropism. Plates were scanned every 30 min and the angle between major root and root tip orientation was measured using ImageJ software (Schneider et al., 2012).
2.5. Methods concerning gene expression analysis 2.5.1 RNA extraction
Total RNA from cells was extracted using RNeasy Plant Mini Kit (Qiagen, France). The quantity of extracted RNA was measured using NanoDrop. The quality of the RNA was assessed on 2.5% (w/v) agarose gel with 0.3% (v/v) GelRed staining.
cDNA was synthetized by reverse transcription of 4 μg of total RNA using an oligo-dT primer and Superscript III kit (Invitrogen). Real-time PCR was performed in a Step One Plus system (Applied Biosystems) with the Power SYBR Green RT-PCR mastermix (Applied Biosystems). The amplification program was made of an initial denaturation at 95°C for 10 min, 35 cycles of amplification at 95°C for 20 sec, followed by 30 sec at Tm specific for each couple of primers and 45 sec at 72°C. The transcript abundance was standardized to that of At3g18780 and At5g11770 genes as references. A logarithm base 2 normalisation was applied to the average transcript abundance level to obtain the same data range as in transformed microarray data. The list of the primers used is given in the Table 2.1. Table 2.1. List of primers used for qPCR
2.5.3 Transcriptome Studies
The transcriptomic response to ABA was monitored by microarray analysis, carried out at the Institute of Plant Sciences Paris-Saclay (POPS platform, IPS2, Saclay, France), using the CATMAv5 arrays containing 31776 gene-specific tags
AT3G18780_FP GCAGGAGATGGAAACCTCAA AT3G18780_RP GATTCCAGCAGCTTCCATTC At5g11770_FP AAGGTGGGTGATTTCAATGG At5g11770_RP CCATAGAGCAAAGCCTCAGC AT4G39320_FP ACAAGGCAGATAAGATAACG AT4G39320_RP CGAGGTCAATGATTTTCTC AT3G61820_FP TGTCTCGCGCGTGTTAGATT AT3G61820_RP TTTCAAAGGACAAAAGCACC AT3G50970_FP CATGGATCACACCAAACTG AT3G50970_RP GTGAACGACATTAGTGTTAGTACC AT3G44300_FP GTCAGTTCATGTCACTCCTAT AT3G44300_RP TCAAAGCCAGATTCATAATA AT2G45570_FP AACCCGTTACATGCCGTA AT2G45570_RP AGGTAAACGAACTATAGAATCTGA AT4G24780_FP TGGTGCACTGAATTGCCG AT4G24780_FP TCAAGATCAACACATCTGCACT
corresponding to 22089 genes from Arabidopsis (Crowe et al., 2003, Hilson et al., 2004). Two independent biological replicates were produced. For each biological repetition and each sampling point, samples were obtained by pooling RNAs from 3 independent experiments. RNAs were prepared as described in (Krinke et al., 2009). The ABA treatment was compared to that of the solvent (tertiary butanol 0.1 %, v/v). One technical replicate with fluorochrome reversal was performed for each biological replicate (i.e. four hybridizations per comparison). The labelling of cRNAs with Cy3-dUTP or Cy5-dUTP (Perkin-Elmer-NEN Life Science Products), the hybridization to the slides, and the scanning were performed as described in (Lurin et al., 2004).
2.5.4 Statistical Analysis of Microarray Data
Experiments were designed with the statistics group of the Institute of Plant Sciences Paris-Saclay. For each array, the raw data comprised the logarithm of median feature pixel intensity at wavelengths 635 nm (red) and 532 nm (green) and no background was subtracted. An array-by-array normalization was performed to remove systematic biases. First, spots considered as badly formed features were excluded. Then a global intensity-dependent normalization using the loess procedure (Yang et al., 2002) was performed to correct the dye bias. Finally, for each block, the log-ratio median calculated over the values for the entire block was subtracted from each individual log-ratio value to correct print tip effects. Differential analysis was based on the log ratios averaged on the dye-swap. The technical replicates were averaged to get one log-ratio per biological replicate and these values were used to perform a paired t-test. A trimmed variance was calculated from spots which did not display extreme variance (Gagnot et al., 2008). The raw P-values were adjusted by the Benjamin-Hochberg method, which controls the Family Wise Error Rate in order to keep a strong control of the false positives in a multiple-comparison context. We considered as being differentially expressed the probes with a Benjamin-Hochberg P-value < 0.05.
Genes were classified using the Classification SuperViewer Tool developed by (Provart and Zhu, 2003). The classification source was set to Gene Ontology categories as defined by (Ashburner et al., 2000). The frequency of a category is normed that in the whole Arabidopsis set. The mean and standard deviation for 100 bootstraps of our input set were calculated to provide some idea as to over- or under-representation reliability. Similarity analysis were performed using tools developed by Genevestigator (Hruz et al., 2008). The ―Hierarchical clustering‖ tool works on the expression matrix defined by a microarray experiment selection and a gene selection. The similarities between expression profiles were determined using Pearson correlation for the measurement of distance. The “Biclustering” tool identifies groups of genes that are expressed above or under a set threshold ratio in a subset of conditions rather than in all conditions.
Motif analysis was carried using HOMER software (Heinz et al., 2010). Conserved motifs were searched in the promoter region 300 bp upstream of the Transcription Start Site (TSS) of genes up or down-regulated by ABA and/or SA. Basic options were used except for options: -S 5 –len 6. Top enriched de novo motif was then used as input to scan sequences for these motifs to determine their abundance among differentially ABA and/or SA regulated genes. MEME, AME
(Bailey et al., 2009) and TAIR
(https://www.arabidopsis.org/tools/bulk/motiffinder/) motif analysis tools were also used to strengthen the results.
2.5.6 Comparison of two sets of transcriptomic data
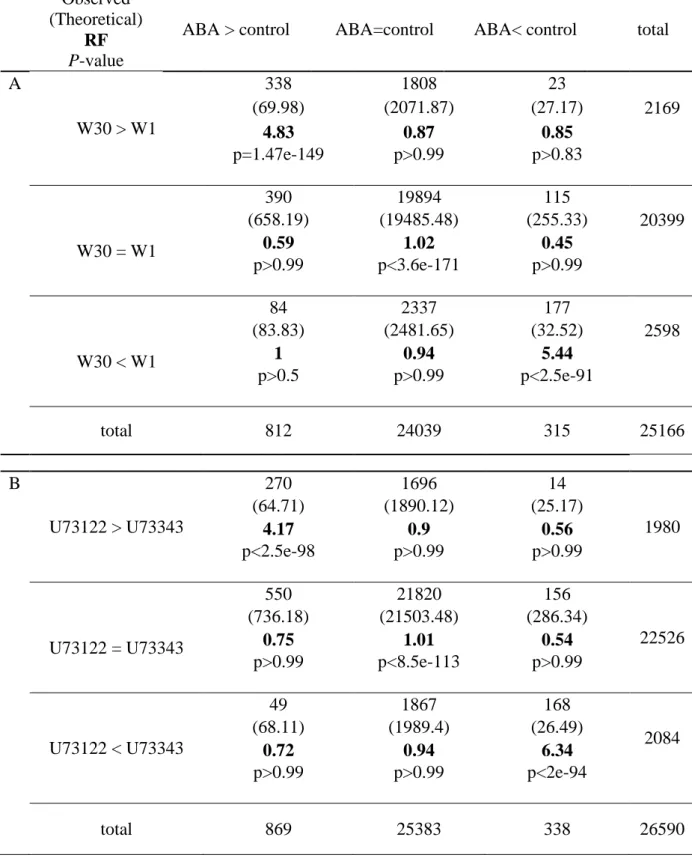
In the comparison of our ABA-regulated genes with previous SA or inhibitors transcriptome data, we first draw contingency tables. In response to either ABA, SA or to an inhibitor, genes can be up-regulated, down-regulated or unaffected by the treatment. When considering both the responses to ABA and to SA or to an inhibitor, this leads to 9 possibilities. The genes for each one of these 9 categories were counted. We can designate |A| as the number of genes in the gene set A (for instance ABA-induced genes), |B| is the number of genes in the gene set B (for
instance SA-induced genes), and N is the total number of microarray probes that had a signal in the two experiments we cross. |A∩B| represents the observed number of genes common to gene set A and gene set B (i.e. genes induced by SA
and ABA) while the theoretical number of genes predicted to be common for sets A and B can be calculated as (|A|/N) x (|B|/N) x N. The ratio between the observed
number and the theoretical one is the representation factor (RF). To this RF can be associated P-value calculated by the hypergeometric distribution:
( ) (
) ( )
( )
where k = |A∩B|, and the brackets indicate the binomial coefficient.
2.5.7 Data Deposition
Newly generated microarray (ABA response in cell suspensions) were deposited at Gene Expression Omnibus (http://www.ncbi.nlm.nih.gov/geo/; accession no. GSE 35872) and at CATdb (http://urgv.evry.inra.fr/CATdb/; Projects: AU10-12) Comparison of WT to dgk5.1 transcriptome in 14-days-old seedlings, and comparison of WT and dgk5.1 seedlings response after 1h of flg22 treatment were deposited at CATdb (http://urgv.evry.inra.fr/CATdb/; Projects: AU16-02_Dgk5) according to the ―Minimum Information About a Microarray Experiment‖ standards (Brazma et al., 2001).
2.6 Data analysis and statistics
Mean values, standard errors of means and the significance of differences between mean values were calculated using Excel, Sigma Plot and R software; t-test and ANOVA were applied as statistical treatment for data.
CHAPTER 3. INVOLVEMENT OF PHOSPHOLIPASE D AND NADPH-OXIDASE IN SALICYLIC ACID SIGNALING CASCADE
INTRODUCTION. Plant growth and survival require successful adaptation to environmental changes. Abiotic stresses and pathogen attacks induce rapid changes in cell metabolism. This is possible because plants have developed a wide signaling network regulated by small active molecules – phytohormones. Salicylic acid (SA) is one of the stress-associated phytohormones. This is a signal molecule involved in the induction of defense mechanisms to biotrophic pathogens (Rivas-San Vicente and Plasencia, 2011, Huot et al., 2014). It is also involved in the regulation of different aspects of plant growth and development such as seed germination, dormancy, flowering (Lee et al., 2010b). On biochemical level, SA can have impact on ion transport (Katz et al., 2002), photosynthetic intensity and transpiration regulation (Khan et al., 2003). To realize these effects, SA triggers cascades of enzymatic reactions starting with specific target proteins.
Several SA-binding proteins have been reported in recent years. Among such proteins, are enzymes producing reactive oxygen species (ROS), several kinases and proteins with lipase activity (Kachroo and Kachroo, 2007). Characterized SA-binding proteins include cytosolic catalase (SABP) and ascorbate peroxidase (major H2O2-scavenging enzymes), chloroplastic carbonic
anhydrase (named SABP3), and methyl salicylate esterase (named SABP2) (Manohar et al., 2014). SA reversibly binds to SABP inhibiting its H2O2-degrading
activity. This effect can be enhanced while SA inhibits cytosolic ascorbate peroxidase another important H2O2-scavenging enzyme in plant cells (Rao et al.,
1997). SA binding to SABP2 and SABP3 also is a part of triggering systemic acquired resistance (SAR), however its physiological mechanism of is not yet known (Slaymaker et al., 2002). Several genetic and biochemical approaches have proved that SA directly/physically interacts with NPR1 (NONEXPRESSOR OF PATHOGENEZIS RELATED GENES 1) protein and its paralogs NPR3 and NPR4(Yan and Dong, 2014). As a result of being recognized by such proteins, SA
modulate their activities and activates downstream signaling cascades. These cascades are then mediated not by SA itself, but by different second messengers like Ca2+, ROS or lipid derived ones – phosphatidic acid, diacylglycerol or phosphorylated inositols (Zhang et al., 2014). However, early stages of signalling cascades induced by this phytohormone are currently undisclosed.
Reactive oxygen species (e.g., O2•−, H2O2, OH•, 1
O2) are partially reduced or
excited forms of oxygen. As signaling molecules, ROS are mainly short-living substances that are generated in different cell compartments and have polyvalent biological activity and potential to cross biological membranes (Mittler, 2017). ROS associated with cell-to-cell signaling are produced mainly near plasma membrane, substantially at the apoplast by oxidases. Plant NADPH-oxidases (also called respiratory burst oxidase homologs - RBOH) catalyze the production of superoxide radicals (O2
•−
) involved in the primary defense responses in plants and animals (Zhang et al., 2012, Ma et al., 2011). For example, exogenous avirulent elicitor application caused superoxide burst in Solanum
lycopersicum plants (Wang, 2005). Furthermore, NADPH-oxidase is a source of
ROS generation under different stimuli effects including pathogen attack or root hairing (Palma et al., 2009, Zhang et al., 2009). The expression of Arabidopsis NADPH-oxidase genes differ in the tissue specificity. RbohD and RbohF are expressed uniformly through the whole plant, RbohA, RbohG, RbohI are mainly expressed in roots and RbohH and RbohJ are more common during pollen development (Sagi and Fluhr, 2006). Two NADPH oxidase isoforms, RbohD and RbohF, are the most important in the regulation of the defense-associated metabolism during compatible and incompatible biotic interactions. RbohF action is crucial during intracellular oxidative stress and appears to be a key player not only in cell death during hypersensitive reaction but also in regulating metabolomic responses and resistance to pathogens (Chaouch et al., 2012). RbohD provides an apoplastic signaling ROS early after recognition of pathogen associated molecular patterns (PAMPs). It is activated downstream of receptor complex that recognizes PAMPs (flagellin, EF-Tu, chitin) and is responsible for
transduction of signal both to cytoplasm and through the apoplast to the neighboring cells (Chinchilla et al., 2007).
Phosphatidic acid (PA) is a universal lipid second messenger. It can be produced from structural lipids such as phosphatidylethanolamine (PE) or phosphatidylcholine (PC) by phospholipase D hydrolyzing activity; but it can be also produced by the action of diacylglycerolkinases (DGK) from diacylglycerol (DAG) that can itself be produced by phospholipases C. According to the enzymes responsible for PA production, the composition in its fatty acids may differ. This is due to the fact that structural phospholipids from the one hand and phosphatidylinositols from the other hand have marked differences in their fatty acid composition. As a consequence, PAs with polyunsaturated fatty acid chains are likely to be products of phosphoinositide-dependent PLC coupled with the action of a DGKs, whereas mono-unsaturated and saturated PAs likely to be the result of direct hydrolysis of PE or PC by PLD (Hodgkin et al., 1998). The specificity of fatty acid composition might be a determinant of the selectivity for PA targets, that is proteins that bind PA (Bargmann and Munnik, 2006). One of the PA target proteins is OXIDATIVE SIGNAL INDUCIBLE1 (OXI1) kinase, a serine/threonine kinase necessary for oxidative burst-mediated signalling in Arabidopsis roots (Camehl et al., 2011). It is activated by PA in a PDK1 signaling pathway providing additional evidence for an interaction between PA and oxidative stress (Testerink and Munnik, 2005). PDK1 pathway is important for the regulation of stomatal movement during the establishment of colonization of plant tissues by endophytic fungus Piriformospora indica (Camehl et al., 2011). The involvement of PLD-derived PA to ROS generation is now discussed in the context of the responses to phytohormones, especially SA and ABA, and in response to a wide range of stresses. ABA application caused ROS generation and NADPH-oxidase activation in wild-type plants, but not in pldα1 mutants (Palma et al., 2009, Zhang et al., 2009). Eventually, addition of PA triggered the synthesis of superoxide both in vivo (leaf infiltration) and in vitro (treatment of microsomal fractions) (Sang et al., 2001a) Other in vitro studies showed that PA can physically
interact with both recombinant isozymes of NADPH-oxidases RbohD and RbohF. The PA-binding region of RbohD was mapped to amino acid residues 101 to 330 of primary coding sequence, for RbohF this motif resided in 104 to 341 (Zhang et al., 2009). The PA binding site in RbohD was located in the cytosolic region between the two EF-hands and N terminus. In Zhang et al. (2009), the RbohD activation by PA was studied in the context of ABA signaling in guard cells. Activation of PLD by ABA results in PA production. Then PA binds to the cytosolic region in the N-terminus part of RbohD, resulting in the stimulation of NADPH oxidase activity and ROS production in guard cells. The final physiological effect of the cascade is stomatal closure (Zhang et al., 2009).
RESULTS AND DISCUSSION. The aim of the present work was to investigate the possible involvement of lipid signaling and its role in the generation of reactive oxygen species as part of the transduction of SA in Arabidopsis leaves. To detect the effect of exogenous application of SA on lipid metabolism in plant tissues, the tissues (leaf disks) were incubated in presence of radioactive 33Pi for 14h and then 1mM SA was added. Lipids were extracted up to 45 min after SA addition; lipids were separated by thin layer chromatography (Fig. 3.1A) and the radioactivity associated with PA was measured (Fig. 3.1B). A significant increase in PA content in SA-treated A. thaliana leaves was detected 15 min after SA addition. This represents the evidence of lipid metabolism enzymes activation (Fig 3.1 A, B).
Figure 3.1
Phospholipase D implication into PA accumulation in Arabidopsis thaliana Col-1 and rbohD tissues under exogenic application of SA. A, B – dynamics of PA accumulation in WT tissues after SA treatment. C, D. – phosphatidylbutanol formation in WT and rbohD after 30 min 1mM SA treatment in presence of 1-butanol. A,B - autoradiography, B, D - scintillation counting. Lipids were separated by TLC developped in the solvent mixtures: A: chloroform:acetone:acetic acid:methanol:water (10:4:2:2:1 [v/v/v/v]) or B: ethyl acetate/iso-octane/acetic acid/H2O (12:2:3:10, v/v). Lipids were identified by
comigratipon with non-labeled standards. Data are presented in means ±SD, ANOVA, different letters correspond to significantly different values, p≤0.05.
PA can be generated by PLD activity or by PLC coupled to DGK. To detect the possible source of the generated PA, 1-butanol was added in the incubation medium 30 min before SA. Primary alcohols can serve to PLDs as an alternative substrate instead of water in the so-called transphosphatidylation reaction. As a result, in presence of 1-butanol such reaction leads to the formation of phosphatydylbutanol (PBut). PBut cannot trigger the PA-mediated reactions in