HAL Id: tel-00564020
https://tel.archives-ouvertes.fr/tel-00564020
Submitted on 7 Feb 2011HAL is a multi-disciplinary open access archive for the deposit and dissemination of sci-entific research documents, whether they are pub-lished or not. The documents may come from teaching and research institutions in France or abroad, or from public or private research centers.
L’archive ouverte pluridisciplinaire HAL, est destinée au dépôt et à la diffusion de documents scientifiques de niveau recherche, publiés ou non, émanant des établissements d’enseignement et de recherche français ou étrangers, des laboratoires publics ou privés.
CEREBRAL BLOOD VOLUME FOR THE
CHARACTERIZATION OF EXPERIMENTAL BRAIN
TUMOR NEOVASCULARIZATION
Teodora-Adriana Perles-Barbacaru
To cite this version:
Teodora-Adriana Perles-Barbacaru. MAGNETIC RESONANCE IMAGING OF THE CEREBRAL BLOOD VOLUME FOR THE CHARACTERIZATION OF EXPERIMENTAL BRAIN TUMOR NEOVASCULARIZATION. Bioengineering. Université Joseph-Fourier - Grenoble I, 2007. English. �tel-00564020�
Faculty of Medicine - Joseph Fourier University - Grenoble - France
Ecole Doctorale Ingénierie pour la Santé, la Cognition et l’Environnement
Grenoble Institut des Neurosciences UMR-S INSERM / UJF / CEA 836
presented by
Adriana T. Perles-Barbacaru
Dissertation for the Degree of Doctor of Philosophy (PhD) in Physics
Signals and Imaging in Medicine and Biomedicine
English title:
Magnetic resonance imaging of the cerebral blood volume
for the characterization of experimental brain tumor
neovascularization
French title:
Imagerie par résonance magnétique du volume sanguin
pour la caractérisation de la néovascularisation dans les
tumeurs cérébrales expérimentales
presented at the Joseph Fourier University December 20, 2007
jury:
Anne Marguerite Leroy-Willig (reporter)
Robert Nicolas Henry Muller (reporter)
Isabelle Berry (examiner)
Jean François Le Bas (examiner)
Christoph Segebarth (co-supervisor)
Acknowledgements... 7
English abstract ... 9
Résumé français... 11
Lists of abbreviations and symbols ... 13
General introduction ... 19
Literature review... 27
1. Purpose of the literature review... 27
2. Brain microvasculature... 28
2.1. The blood brain barrier ... 28
2.2. The morphology of vasculature ... 30
2.3. Hemodynamic parameters ... 31
3. Brain tumors ... 32
3.1. Epidemiology ... 32
3.2. Primary brain tumors ... 32
3.3. Grading... 33
3.4. Orthotopic rat brain tumor models ... 34
3.5. Angiogenesis ... 35 3.6. Treatment modalities ... 36 3.7. Antiangiogenic treatment... 37 3.8. Angiogenesis assessment... 38 3.9. Quantitative MRI... 39 4. MRI of cancer ... 40
5. Compartment models of the brain tissue... 42
5.1. The intravascular and the extravascular compartment... 43
5.2. The intracellular and extracellular compartments ... 43
6. Water exchange ... 44
6.1. Intracellular - extracellular exchange... 44
6.2. Intravascular - extravascular exchange ... 45
6.3. Intravascular and extravascular residence times... 45
6.4. The exchange regime... 46
7. Contrast agents ... 48
7.1. CA relaxivity... 48
7.2. Paramagnetism ... 49
7.3. Chelating compounds... 49
7.4. Proton relaxation in the presence of magnetic agents... 50
7.5. NMRD profiles ... 52
7.6. Types of CAs ... 53
8. Fast MRI techniques... 58
8.1. K-space ... 58
8.2. Conventional K-space sampling ... 59
8.3. Strategies that reduce the repetition time ... 61
8.4. Strategies that reduce the number of phase encode steps and speed up K-space sampling ... 62
8.4.1. Fast Spin Echo ... 62
8.4.2. Echo planar imaging ... 62
8.4.3. Spiral imaging ... 64
8.5. Strategies that reduce the acquired data... 65
8.5.1. Variable density sampling... 65
8.5.2. Half Fourier reconstruction ... 67
8.5.3. Reduced FOV ... 68
8.6.1. Parallel imaging ... 68
8.6.2. Multiple slice acquisitions ... 68
8.7. Strategies to decrease the number of experiments ... 69
8.7.1. Increasing the SNR... 69
8.7.2. Slowing down the transverse signal decay... 69
8.7.3. Numeric correction for the decay term... 69
9. CBV measurements by MRI ... 70
9.1. Steady state methods... 71
9.1.1. CBV measurement in the slow water exchange regime ... 72
9.1.2. CBV measurement in the fast water exchange regime ... 72
9.1.3. CBV measurement by the steady state ΔR2* method... 72
9.1.4. Vascular space occupancy (VASO)... 75
9.2. Dymamic methods... 78
9.2.1. Bolus tracking method ... 79
9.2.2. Steady state versus bolus tracking MRI techniques ... 81
9.2.3. T1 weighted versus T2 weighted MRI for CBV mapping... 82
9.2.4. Pharmacokinetic models for BBB permeability and CBV estimation ... 83
9.3. CBV estimations by ASL and BOLD MRI techniques... 90
10. Other imaging techniques for CBV measurement ... 92
10.1. PET, SPECT and CT ... 92
10.2. Optical techniques ... 93
11. Literature review: CBV in rats... 96
Experimental studies ... 99
1. Chapter I: The Rapid Steady State T1 method by IR-FLASH ... 99
1.1. Introduction... 99
1.2. Theory ... 100
1.2.1. The two compartment model ... 100
1.2.2. Spin fraction or volume fraction? ... 102
1.2.3. Principle of the RSST1 method ... 103
1.2.4. A steady state MRI method? ... 104
1.3. Signal modeling ... 105
1.3.1. Longitudinal magnetization as a function of TR, Tinv and T1... 105
1.3.2. Longitudinal magnetization versus time during the IR-FLASH sequence... 110
1.3.3. Blood signal as a function of the administered CA dose ... 112
1.4. In vivo experimental setup (general) ... 114
1.4.1. Animals ... 114
1.4.2. MRI equipment ... 114
1.4.3. Imaging protocol ... 115
1.5. Preliminary experiments ... 116
1.5.1. T1 determination of brain tissue ... 116
1.5.2. T1 determination of blood... 116
1.5.3. In vitro blood volume experiment... 117
1.5.4. In vivo dose studies ... 119
1.5.5. Results of the preliminary experiments... 120
1.5.6. Discussion of the preliminary experiments ... 123
1.6. CBVf measurement under normo- and hypercapnia ... 126
1.6.1. Imaging protocol ... 126
1.6.2. Image analysis... 129
1.6.3. Results of the in vivo CBVf measurements ... 130
1.7. Discussion ... 138
1.7.2. Advantages of acquiring the normalizing factor before CA injection ... 140
1.7.3. The normalization factor S0... 141
1.7.4. Blood flow effects... 142
1.7.5. Water exchange... 143
1.7.6. SNR ... 147
1.7.7. Dynamic imaging using the RSST1 method... 148
1.7.8. Sensitivity to motion... 149
1.7.9. Multiple-slice acquisitions ... 149
2. Chapter II: CBVf mapping in healthy rat brain using the RSST1 method with SINEREM. 153 2.1. Introduction... 153
2.2. Characteristics of SINEREM... 154
2.3. The RSST1 method in conjunction with SINEREM... 154
2.4. Preliminary experiments ... 155
2.4.1. Relaxivity of SINEREM at 2.35T in normal saline solution ... 155
2.4.2. In vitro doses studies ... 158
2.4.3. Discussion ... 162
2.5. Theory ... 163
2.5.1. The three dimensional projection reconstruction acquistion... 163
2.5.2. Acquisition of the thermal equilibrium signal of the cerebral tissue ... 164
2.5.3. CBVf calculation ... 166
2.6. In vivo CBVf measurements ... 167
2.6.1. The steady state ΔR2* MRI technique for comparison... 167
2.6.2. Animals ... 168
2.6.3. CBVf by the RSST1 method... 168
2.6.4. CBVf by the steady state ΔR2* method... 170
2.6.5. Imaging protocol ... 170
2.6.6. SINEREM induced blood susceptibility difference... 171
2.6.7. Image processing ... 172
2.6.8. Results... 174
2.6.9. Discussion ... 177
3. Chapter III: CBVf mapping using RSST1 with SINEREM as blood pool agent in tumor tissue ... 181
3.1. Introduction... 181
3.2. Tumor cell culture ... 182
3.3. Tumor cell implantation ... 182
3.4. Imaging protocol ... 184
3.5. Data analysis ... 184
3.5.1. PR3D acquisitions ... 184
3.5.2. MGESE acquisitions ... 185
3.6. Results... 185
3.6.1. CBVf obtained by the RSST1 method ... 185
3.6.2. CBVf obtained by the steady state ΔR2* method... 188
3.7. Discussion ... 192
3.7.1. CBVf overestimation in case of CA leakage ... 192
3.7.2. Water exchange in tumor tissue ... 193
4. Chapter IV: CBVf mapping using the RSST1 method with Gd-ACX in a C6 tumor model 195 4.1. Introduction... 195
4.2. Gadolinium complexed to an α-cyclodextrin derivative: Gd-ACX ... 196
4.3. First studies with ACX and Gd-ACX ... 196
4.4. The Gd-ACX solution... 197
4.4.2. Gd-ACX concentration in solution... 197
4.5. Biocompatibility studies ... 198
4.5.1. Hemolytic effect ... 198
4.5.2. Median lethal dose of Gd-ACX ... 199
4.6. In vitro relaxometry ... 200
4.6.1. Materials and methods ... 200
4.6.2. Results: Relaxivities of Gd-ACX ... 202
4.7. In vivo MR imaging ... 206
4.7.1. Imaging protocol on C6 tumor bearing rats ... 206
4.7.2. CBVf-mapping protocol on healthy Wistar rats... 209
4.7.3. Data analysis ... 209
4.7.4. Results... 210
4.8. Discussion ... 217
4.8.1. Advantages of Gd-ACX ... 217
4.8.2. Reason of Gd-ACX confinement to the blood pool... 217
4.8.3. CBVf in tumor, contralateral and normal brain tissue ... 218
4.8.4. Problems encountered with Gd-ACX... 218
4.8.5. Intravenous tolerance of Gd-ACX... 219
4.8.6. Dissociation of Gd3+... 221
4.8.7. Transmetallation ... 222
4.8.8. In vivo use of Gd-ACX ... 222
4.8.9. β-cyclodextrin derivative ... 223
5. Chapter V: Histological vascular morphometric analysis... 225
5.1. Introduction... 225
5.2. CBVf by epifluorescent microscopy... 226
5.3. The CBVf as vascular volume density Vv... 226
5.4. Adair's stereological method for the estimation of the vascular length density... 227
5.5. Material and methods ... 229
5.5.1. Anti-collagen IV and Hoechst staining ... 229
5.5.2. Image acquisition... 230
5.5.3. Data analysis ... 231
5.6. Results... 234
5.6.1. Pilot study on a cylinder model ... 234
5.6.2. Vascular volume density and vessel diameters in healthy Wistar rats ... 237
5.6.3. Vascular volume density and vessel diameters in C6 tumor tissue... 238
5.7. Discussion ... 243
5.7.1. Vessel diameters ... 243
5.7.2. Method dependence ... 243
5.7.3. Comparison between CBVf obtained by histology and MRI ... 244
5.7.4. Technical considerations ... 245
5.8. Conclusion... 246
6. Chapter VI: CBVf and CA leakage profiles in tumor tissue ... 247
6.1. Introduction... 247
6.1.1. The RSST1 interval with blood pool CA ... 248
6.1.2. The RSST1 interval and CA leakage... 248
6.2. Theory ... 249
6.2.1. Pharmacokinetic model ... 250
6.2.2. The phases of CA uptake in tissue ... 251
6.3. Material and Methods ... 254
6.3.1. Imaging protocol ... 254
6.4. Results... 257
6.4.1. The CBVf ... 257
6.4.2. Leakage profiles in muscle and tumor ROIs... 258
6.5. Discussion ... 259
6.5.1. The CBVf ... 259
6.5.2. Leakage profiles in muscle ROIs ... 260
6.5.3. Leakage profiles in tumor ROIs ... 261
6.5.4. Possible improvements... 263
6.5.5. Conclusion ... 264
General discussion ... 267
1. Possible improvements of the RSST1 method ... 268
1.1. R2 weighting... 268
1.2. Water exchange effect... 269
1.3. Inflow - outflow effects ... 269
1.4. SNR ... 269
2. Possible applications of the RSST1 method ... 270
2.1. Serial studies ... 270
2.2. Sensitivity to CBVf alterations... 270
2.3. CBVf monitoring in dynamic studies... 271
2.4. Utility in fMRI ... 271
3. Advantages of the RSST1 method... 271
3.1. Few assumptions... 272 3.2. No AIF measure ... 272 Conclusion... 273 References ... 277 List of publications... 293 Curriculum vitae ... 298 Appendix ... 299
Appendix I: ImageJ (version 1.38a) macro for vascular morphometric analysis ... 301
Appendix II: A new Magnetic Resonance Imaging method for mapping the cerebral blood volume fraction: the rapid steady-state T1 method ... 311
Appendix III: Cerebral blood volume quantification in a C6 tumor model using Gadolinium Per (3,6) Anhydro Alpha Cyclodextrin as a new MRI preclinical contrast agent ... 313
Acknowledgements
The present work was carried out in the Department of Functional and Metabolic Neuroimaging, French National Institute of Health and Medical Research (INSERM), University Joseph-Fourier, Grenoble, France from 2004 to 2007.
This work would not exist without the encouragement of Professor Jean-François Le Bas from the Department of Neuroimaging of the University Hospital in Grenoble. I am grateful for his confidence and letters of recommendation, which certainly played a considerable role in finding research funding.
I would like to thank my principal supervisor, Hana Lahrech, PhD, and my co-supervisor and director of the laboratory, Christoph Segebarth, PhD, for the support and advice they have provided throughout the duration of my Ph.D, Professor Robert Muller and Professor Anne Ieroy-Willig for acceptance to review this work and Professor Isabelle Berry for agreeing to be part of the jury.
I would also like to thank all the people with whom I have worked over the past three years, without whom this work would have been much more difficult, and particularly
Régine Farion for the cryosections, the histological staining and for teaching me some surgical procedures and the art of handling rats and biological material like tumor cells, histochemicals etc,
Boudewijn van der Sanden, PhD, for explaining me the use of microscopic image acquisition and processing software and for helpful comments,
Taoufik Fadlallah, MSc, for his preliminary work on stereological methods,
Marion Gandit for a first version of an ImageJ macro for the analysis of immunofluorescent histological images of the microvasculature,
Lionel Chièze, who was a Master degree student, for his participation in studying the relaxation properties of the Gd-BCX compound and for working late during our experiments,
Nils Kickler, PhD, for his IT skills and his friendship,
the engineers Olivier Montigon and Hervé Mathieu, PhD, for frequent technical assistance during the MRI experiments,
Marine Beaumont, Irène Troprès and Emanuel Barbier for the introduction to the practical aspects of CBVf measurements using the ΔR2*-method, and for the discussion about
brain tumor models and their permeability to Sinerem,
Jean-Claude Vial, PhD, from the "SPECTRO Laboratory" for the Turbo Pascal code for the creation of a "virtual phantom"
Jean-Claude Debouzy, MD, from the "Laboratoire de Biophysique" of the French Research Center of the Army Health Services (CRSSA) and Pascal Fries, PhD, and Andrée Gadelle, PhD, from the "Laboratoire de Reconnaissance Ionique/Service de Chimie Inorganique et Biologique", of the French Atomic Energy Commission (CEA) for fruitful discussions and for teaching me some basic chemistry techniques, as well as Laurent Lamalle, PhD, for the image reconstruction of Projection Reconstruction
acquisitions.
The project described in this manuscript is based on the theoretical and experimental work carried out by Hana Lahrech and her PhD student Emanuel Fonchy a couple of years before my arrival to the laboratory. I have relied on some of their results, and I would like to acknowledge this contribution.
Guerbet Laboratories provided most of the contrast agents employed in this study and I thank particularly Philippe Robert for his interest in and support of our experiments.
In a more personal context, I want to acknowledge the collegial friendship of Mathilde Pachot-Clouard and Hana Lahrech, who not only shared their office with me, but also helped me out in private issues.
I am deeply grateful to my parents for laying the foundations of scientific approaches during my childhood.
The most precious support came from my husband who took care of our daughter in the evenings waiting for me to finish the experiments: “Merci infiniment, Michel!” for lovingly supporting me and for your willingness to adapt your professional plans to my career.
Finally I would like to thank the Association for Anti-Cancer Research (Association pour la Recherche contre le Cancer, ARC) for their 3- years funding of my PhD and the early recognition of my work by a prize, but I also want to acknowledge the German Academic Exchange Service (Deutscher Akademischer Austauschdienst, DAAD) and the French National Academy of Medicine (Académie Nationale de Médecine, ANM) for offering each of them a one year funding.
English abstract
Cerebral blood volume fraction (CBVf) mapping by magnetic resonance imaging (MRI) can provide information about the progression of tumor angiogenesis without harmful side-effects. In this work, a novel MRI method for in vivo CBVf mapping is developed: the Rapid Steady State T1
(RSST1) method.
The method is based on a two-compartment model, intra- and extravascular, without water exchange, and on the longitudinal relaxivity of intravascular MRI contrast agents (CAs). This method has been validated on healthy Wistar rats at 2.35 T (CBVf: 2 to 3%) and its sensitivity has been evaluated in a hypercapnia experiment (CBVf increase of 1%/mmHg CO2).
In order to apply this method for monitoring disease evolution or treatment efficacy, CAs are evaluated that do not leak across the blood brain barrier during the measuring time. Two experimental CA, Gd-ACX and SINEREM were used on two rat glioma models C6 and RG2. The CBVf measures in tumor tissue obtained with Gd-ACX are confirmed by a histologic vascular morphometric analysis. CBVf mapping with SINEREM necessitates acquisitions with short echo time. The measures were compared with those obtained by a ΔR2*-based steady
state method using the same SINEREM injection.
In case of CA extravasation, such as occurs in tumor tissue with CAs approved for clinical use, the CBVf along with the transfer coefficient κ (a measure related to the endothelial permeability) were obtained by pharmacokinetic two-compartment analysis of dynamic RSST1 acquisitions.
In conclusion, the RSST1 method in conjunction with appropriate CAs can be used for
longitudinal angiogenesis studies to quantify the CBVf and the vascular permeability. Keywords
Angiogenesis
Cerebral blood volume Magnetic resonance imaging Paramagnetic contrast agent
Résumé français
La mesure du volume sanguin cérébral (VSC) par Imagerie par Résonance Magnétique (IRM) permet d’étudier l’angiogénèse tumorale. Dans cette thèse, une méthode IRM, dite méthode T1
stationnaire rapide (RSST1) pour quantifier le VSC est proposée.
Le principe repose sur les propriétés de la relaxation longitudinale avec des agents de contraste (AC) paramagnétiques intravasculaires et sur un modèle du cerveau bi-compartimental extra/intravasculaire sans échange d'eau. La méthode a été validée sur des rats sains à 2.35T (VSC: 2 à 3%) et la sensibilité évaluée sous hypercapnie (augmentation du VSC de 1%/mmHg CO2).
Pour évaluer l’efficacité d’un traitement antitumoral, des AC ne s’extravasant pas durant la mesure à travers une barrière hématoencéphalique (BHE) lésée sont nécessaires. Deux AC expérimentaux, le Gd-ACX et le SINEREM, ont été étudiés sur deux modèles de rat gliome C6 et RG2. Avec le Gd-ACX, les mesures ont été confrontées à une analyse morphométrique de la microvascularisation sur des coupes immuno-histologiques. Les mesures avec le SINEREM ont nécessité le développement d’acquisitions à temps d’écho court et ont été comparées à ceux obtenus par la méthode ΔR2* utilisant le même AC.
Pour des AC qui s’extravasent (Gd-DOTA admis en clinique), utilisant une analyse pharmacocinétique à deux compartiments, les acquisitions de la méthode RSST1 conduisent à
la mesure du VSC et au coefficient de transfert κ lié à la perméabilité de la BHE.
En conclusion, la méthode RSST1, méthode quantitative de mesure de VSC, permet avec des
AC appropriés, de réaliser des études longitudinales de l’angiogénèse tumorale et d’accéder à la perméabilité vasculaire.
Mots-clés Angiogenèse
Volume sanguine cérébral
Imagerie par resonance magnétique Agent de contraste paramagnétique
Lists of abbreviations and symbols
List of abbreviations
2DFT two dimensional Fourier transform
AC agent de contraste
ACD natural alpha-cyclodextrin
ACX modified alpha-cyclodextrin
AIF arterial input function
ANN averaged nearest neighbor gridding algorithm
ASL arterial spin labeling
AV vascular area density
BBB blood brain barrier
BCX modified beta-cyclodextrin
BHE barrière hématoencéphalique
BOLD blood oxygenation level dependent
CA contrast agent
CAs contrast agents
CBF cerebral blood flow
CBV cerebral blood volume
CBVf cerebral blood volume fraction
CEA Commission d'Energie Atomique, French Atomic Energy Commission
CGS centimetre-gram-second unit
CNR contrast to noise ratio
CNS central nervous system
CT computed tomography
DCE dynamic contrast enhanced
DFT discrete Fourier transform
DNA deoxy-ribonucleic acid
DOTA tetraazocyclododecane tetraacetic acid
DSC dynamic susceptibility contrast
DTPA diethylene triamine pentaacetic acid
EPI echo planar imaging
eve extravascular extracellular
evi extravascular intracellular
FDA food and drug administration
FGF fibroblast growth factor
FID free induction decay
FLASH fast low angle shot
FOV field of view
GM gray brain matter
HE Hematoxylin Erythosine
INSERM institut national de la santé et de la recherche médicale
IR inversion recovery
IRM imagerie par résonance magnétique
ivi intravascular intracellular
l leakage
MR magnetic resonance
MRA magnetic resonance angiography
MRI magnetic resonance imaging
MRS magnetic resonance spectroscopy
MTT mean transit time
MV macroscopic vessels
NMR nuclear magnetic resonance
NMRD nuclear magnetic resonance dispersion
NN nearest neighbor gridding algorithm
p plasma
PaCO2 partial arterial carbon dioxide tension
PaO2 partial arterial oxygen tension
PBS phosphate-buffered saline
PDGF platelet derived growth factor
PET positron emission tomography
PGSE pulsed gradient spin echo
PR projection reconstruction
PR3D three dimensional projection reconstruction acquisition mode
RF radio frequency
ROI region of interest
rpm rounds per minute
RSST1 rapid steady state T1
SENSE sensitivity encoding
SNR signal to noise ratio
SPECT single photon emission computed tomography
SPIO superparamagnetic iron oxide
SS steady state
TE echo time
Tinv inversion time
TNF tumor necrosis factor
TR repetition time
USPIO ultrasmall superparamagnetic iron oxide
VASO vascular space occupancy
VPF/VEGF vascular permeability factor/vascular endothelial growth factor
VSC volume sanguin cérébral
VSI vessel size index
VSOP very small superparamagnetic iron oxide particles
WM white brain matter
List of symbols
a major axis of ellipse
ℜ(t) residue function
AV vascular area density
b minor axis of ellipse
B0 main magnetic field
B1(t) oscillating magnetic field perpendicular to B0
Ca arterial concentration (of the CA)
Ce extravascular concentration (of the CA)
Civ intravascular concentration (of the CA)
Cl CA concentration in the leakage compartment
Cp plasma concentration (of the CA)
Ctissue tissue concentration (of the CA)
Cv venous concentration (of the CA)
D water diffusion coefficient
đ mean vessel diameter
d mean diffusion length
E extraction fraction
E(t) signal enhancement
F blood flow
fD transverse relaxation decay term
Fpl trans endothelial CA flow between plasma and leakage compartment
G Gx,Gy,Gz magnetic field gradient
ħ reduced Planck's constant
Hct hematocrit
inv inversion factor
K exchange regime
k kx,ky,kz spatial frequencies
kB Boltzmann's constant
kei extracellular-intracellular exchange rate
kep extravascular-plasma exchange rate constant
kev-iv extravascular-intravascular exchange rate
kie intracellular-extracellular exchange rate
kiv-ev intravascular-extravascular exchange rate
Ktrans endothelial permeability coefficient
LV vascular length density
m
characteristic time of the compartments participating in the water exchange, inverse of the shutter speed
M magnetization
M0 longitudinal magnetization at thermal equilibrium
M0ev extravascular longitudinal magnetization at thermal equilibrium
M0iv intravascular longitudinal magnetization at thermal equilibrium
Mxy transverse magnetization
Mz longitudinal magnetization
Mzev longitudinal magnetization of the extravascular compartment
Mziv longitudinal magnetization of the intravascular compartment
N number of acquisitions
nev number of extravascular water protons or spins
nEx number of experiments
niv number of intravascular water protons or spins
Nk number of α-pulses
nPh number of phase encode steps
nps number of water protons or spins in the system
ntotal total number of water protons or spins niv + nev
Nv vascular density
P endothelial diffusional permeability coefficient
Pm mole fraction of bound water protons
R vessel radius
r x,y,z position
r distance
R1 longitudinal relaxation rate
r1 longitudinal relaxivity
R10 intrinsic longitudinal relaxation rate
R2 transverse relaxation rate
r2 transverse relaxivity
R2* apparent transverse relaxation rate
R2* effective transverse relaxation rate
R20 intrinsic transverse relaxation rate
S signal intensity
S(k) spatial frequency spectrum
S*(k) complex conjugate to the spatial frequency spectrum
S0 signal intensity corresponding to magnetization at thermal equilibrium
S0ev signal intensity corresponding to extravascular magnetization at thermal equilibrium
S0iv signal intensity corresponding to intravascular magnetization at thermal equilibrium
Sev extravascular signal intensity
Siv intravascular signal intensity
Snorm, Spostnorm normalized signal intensity
Spost signal acquired after contrast agent injection
Spre signal acquired prior to contrast agent injection
SV vascular surface
T absolute temperature
t time
T1 longitudinal relaxation time constant
T1app apparent longitudinal relaxation time
T1e, T2e longitudinal and transverse electronic relaxation rates
T1ev extravascular longitudinal relaxation time constant
T1iv intravascular longitudinal relaxation time constant
T2 transverse relaxation time constant
T2*
effective transverse relaxation time,
experimentally observed decay time constant of an FID signal
T2ev extravascular transverse relaxation time constant
T2iv intravascular transverse relaxation time constant
τa water residence or life time in compartment a
Tacq total acquisiton time of a MR scan
τC correlation time
τep time constant for transendothelial contrast agent flow kep-1
τev extravascular water residence or life time
τexch exchange time
τexch-1 exchange rate
τm residence time of coordinated water molecule
τR rotational correlation time
V volume
v volume fraction
vd distribution volume fraction
Ve extravascular volume accessible to the contrast agent
ve fractional volume of the extravascular compartment accessible to the contrast agent
Vev extravascular volume
Veve extravascular extracellular volume inaccessible to the CA
Vevi extravascular intracellular volume
Viv intravascular volume
viv intravascular volume fraction
Vivi intravascular intracellular volume
Vl volume of the leakage compartment
vl volume fraction of the leakage compartment
vp fractional volume of the plasma compartment
Vp plasma volume
Vtotal total tissue volume Viv + Vev
VV vascular volume density
wblood blood water content
wtissue tissue water content
α flip angle
γ proton gyromagnetic ratio: 42.58 MHz/T
Θ polar angle
κ signal enhancement rate
κev enhancement rate of the extravascular compartment
κiv enhancement rate of the intravascular compartment
λ brain - blood partition coefficient for water
π 180° pulse
ρ(r) proton/spin density function
ρblood blood water density
ρtissue tissue water density
σS standard deviation of the averaged signal
Φ azimuthal angle
Χ susceptibility
General introduction
Research environment
This work was carried out in the laboratory for Functional and Metabolic Neuroimaging, affiliated to the French National Institute for Health and Medical Research (INSERM), the Joseph Fourier University of Grenoble and the Federal Institute of Research “NMR: from cell to man”. It is an officially recognized research laboratory of the Atomic Energy Commission (CEA) and has recently become part of the Grenoble Institute of Neuroscience. This interdisciplinary laboratory develops in vivo magnetic resonance imaging (MRI) techniques that are tested on glioma, trauma and ischemia models in rodent brains, before they are transferred to the clinical applications. During the research project that is subject of this dissertation, the laboratory was equipped with two horizontal animal MR scanners (7T and 2.35T), a 4.7T vertical MR scanner, and two human full body MR scanners (1.5T and a 3T). It has fluorescent and confocal microscopes, and access to a two photon microscope for in vivo imaging.
Objectives
Although the human brain makes up only about 2% of the total body weight, it receives up to 20% of the heart's output. A constant and efficient blood supply of the brain is vital. The vasculature of brain tissue is a complex entity having multiple functions and regulatory mechanisms. Most adjustments occur at the microscopic level. Tissues with a high metabolic turnover are generally equipped with a more extensive network of microvessels. Cerebral blood volume (CBV) is defined as the volume occupied by blood per tissue mass (ml/g) or alternatively per volume of brain tissue (%), in which case we call it the cerebral blood volume fraction (CBVf). It can be used to quantify the extent of tissue vasculature. Highly vascularised areas of the brain such as the basal ganglia or the cortical gray matter have a higher CBVf than the less vascularised cerebral white matter. As a functional parameter, the CBVf is altered in the context of vascular auto-regulation. Some diseases affect morphological parameters, such as the vessel density and their size, or hemodynamic parameters, such as the perfusion, which in turn can be detected by an alteration of the CBV. A major research area in which absolute CBV measurements play an important role, are the study of the formation of new microvessels (angiogenesis) for example for the growth and metastasis of malignant brain tumors.
As MRI is a noninvasive technique that does not use ionizing radiation, it is excellent for in vivo experiments especially when repeated studies are required such as in a clinical context. In addition to anatomical and structural information, MRI can also provide quantitative information of physiologic parameters (e.g. membrane permeability, blood oxygenation) and dynamic events (e.g. diffusion and convection of water, concentration time course of magnetic tracers).
The aim of this work is to establish a new MRI method for CBVf quantification and mapping in healthy and diseased brain tissue. It is called the Rapid Steady State T1 (RSST1) method
because it exploits T1 relaxation effects and a dynamic steady state of the magnetization created
by fast MRI. It is based on a two compartment model of the brain tissue and requires the injection of exogenous paramagnetic contrast agents (CAs) that modify the longitudinal relaxation of the intravascular water to distinguish it from the water of the extravascular compartment.
Given the recent developments of antiangiogenic drugs in the treatment of cancer, the proposed RSST1 method is aimed at CBVf-quantification in malignant brain lesions. Several commercial
and experimental CAs are therefore studied for their blood pool properties in malignant brain tumor models in rats.
The following introductory chapter is a literature review of MRI methods providing functional vascular parameters for the evaluation of cancer. Owing to the interdisciplinary character of this work, it is composed of three major parts. The first part provides an overview of the morphological and functional parameters of the microvasculature, describes the process of angiogenesis and the factors involved and reviews the clinical classification of brain tumors and the available animal models of malignant brain tumor. The second part deals with the relaxation properties of CAs and in particular their compartmentalization in the tissue. Finally, the methodological background of medical imaging techniques and in particular of MRI techniques used for CBV quantification is introduced in the last part.
The experimental part of the manuscript is organized into six chapters, corresponding to six studies having different purposes. The first two chapters deal with the methodological development of the RSST1 method and its application to healthy rat brain. The remaining
chapters investigate the utility of different CAs for CBVf quantification in two malignant brain tumor models, RG2 and C6. The CBVf measures are validated using another steady state MRI
method for CBVf mapping based on the transverse relaxation (T2*) effect and using histological
vascular morphometric analysis.
In chapter I, the theoretical background is exposed and the assumptions and experimental conditions are verified by signal modeling and in vitro experiments. Gd-DOTA, a clinically approved small molecular CA, and P760, an experimental intermediate size CA characterized by a higher longitudinal relaxivity, both from Guerbet Laboratories, are used. The sensitivity of the RSST1 method to physiologically occurring CBVf changes is studied. Factors that influence the
accuracy of the CBVf measure are evaluated and the advantages and limits of the method are investigated.
Chapter II concerns further methodological developments necessary for the use of SINEREM, a clinically approved superparamagnetic CA from Guerbet laboratories characterized by a high transverse relaxivity. These developments consist in the implementation of a three dimensional projection reconstruction acquisition mode to image the entire brain volume and to allow a short echo time. In this context the studied method is compared to the T2* based steady state method
for CBVf mapping using the same CA.
The study in chapter III is designed to evaluate SINEREM for its intravascular confinement in an RG2 brain tumor model using the RSST1 method and the T2* based steady state method.
Chapter IV deals with the physicochemical characterization, biocompatibility and biodistribution of Gd-ACX, an experimental CA from the CEA. Its potential for CBVf mapping in a C6 tumor model is evaluated and compared with Gd-DOTA.
In chapter V, a study is described, in which the CBVf measure obtained with Gd-ACX is validated using histological vascular morphometric analysis combined with a stereological technique for CBVf estimation.
Finally, chapter VI deals with the ability to estimate the CBVf in case of CA leakage out of the vasculature. The proposed RSST1 method is investigated for its potential to dynamically monitor
the leakage profile of Gd-DOTA and P760 in a RG2 tumor model. A pharmacokinetic model is applied to the leakage profile allowing the simultaneous estimation of the CBVf, the transfer
constant (related to the permeability of the endothelium to the CA) and the distribution volume of the CA.
Introduction générale
Environnement de recherche
Ce travail a été réalisé dans le laboratoire de Neuroimagerie Fonctionnelle et Métabolique dirigé par Christoph Segebarth. Ce laboratoire est affilié à l’Institut National de Santé et de Recherche Médicale (INSERM), à l’Université Joseph Fourier (UJF) et l’Institut Fédéral de Recherche (IFR) « RMN : de la cellule à l’Homme ». Il est également associé au Commissariat d’Energie
Atomique (CEA). Récemment et depuis janvier 2007, ce laboratoire est intégré dans l’Institut de Neuroscience de Grenoble dirigé par Claude Feuerstein. Les travaux de recherche sont centrés autour de développements de méthodes en IRM et leur utilisation pour l’exploration in vivo du système nerveux central. Le laboratoire dispose de deux plate-formes, une plate-forme petit animal et une plate-forme pour la recherche clinique chez l’Homme. L’expérimentation animale est menée sur plusieurs modèles chez le rat ou la souris (tumeur, ischémie, traumatisme crânien, modèle d’épilepsie). Ce volet préclinique concerne le développement méthodologique et leur validation dans un modèle animal, l’évaluation de méthodes IRM pour l’étude et la caractérisation du modèle ou encore l’évaluation de l’effet de nouvelles drogues. Très souvent, les résultas IRM sont confrontés aux résultats obtenus par analyse histologique par microscopie optique. Pendant la durée de mon travail de thèse, le laboratoire était équipé de deux aimants horizontaux 7T (20 cm) et 2.35T (40 cm), et d’un aimant vertical de 4.7T (11 cm). La plate-forme pour la recherche chez l’Homme est composée de deux aimants (1.5T et 3T). Par ailleurs, le laboratoire est également équipée de microscopes à fluorescence et confocaux et d’ un microscope biphoton pour l’imagerie in vivo.
Objectifs
Le cerveau humain ne pèse que 2% du poids total et malgré cela, il reçoit jusqu’à 20% du sang distribué par le cœur. Pour le cerveau, il est vitale et essentiel que la quantité de sang soit constante. La vascularisation cérébrale est complexe avec des fonctions et des mécanismes régulateurs multiples, qui sont contrôlés au niveau microscopique. Les tissus avec un
métabolisme élevé sont généralement dotés d’un réseau de microvaisseaux plus important. Le volume sanguin cérébral (VSC) est défini comme le volume occupé par le sang par masse tissulaire (ml/g) ou alternativement par volume cérébral (%), dans quel cas on parle de la fraction volumique sanguine cérébrale (fVSC). Le VSC est un paramètre qui permet de
quantifier la vascularisation. Les régions du cerveau hautement vascularisées, comme les ganglions de la base ou le cortex cérébral ont un VSC plus élevé que la matière blanche moins vascularisée. Puisque c’est un paramètre fonctionnel, le VSC est altéré/modifié dans l’auto-régulation vasculaire cérébrale. Dans le cas de pathologies, des paramètres morphologiques tels que la densité vasculaire, la taille des vaisseaux, ou encore les paramètres
hémodynamiques (VSC, débit..) peuvent être affectés. Dans le cas de tumeurs cérébrales, une altération du VSC peut être observée. Un des sujets de recherche dans lequel la mesure du VSC absolu joue un rôle important, est l’étude de la formation des nouveaux microvaisseaux (angiogenèse) qui accompagne par exemple la croissance des tumeurs cérébrales malignes. En Neurosciences, l’IRM est une technique incontournable et permet d’avoir des informations très précieuses aussi bien pour détecter des pathologies ou encore pour étudier les fonctions cérébrales. L’IRM est une technique non invasive qui n’utilise pas de rayonnement ionisant, elle est excellente pour les expériences in vivo, particulièrement quand des études répétées sont nécessaires, comme en clinique. Hormis l’information anatomique des structures cérébrales qui est l’origine du succès de l’IRM, l’IRM fournit également des informations quantitatives sur des paramètres physiologiques (p. ex. la perméabilité membranaire, l’oxygénation sanguine) ou encore des paramètres dynamiques (p. ex. la diffusion et la convection de l’eau, la
concentration des traceurs magnétiques au cours du temps).
Le but de ce travail est de développer une nouvelle méthode IRM pour la quantification et la cartographie de la fVSC dans le tissu cérébral sain et pathologique. La méthode proposée - Rapid Steady State T1 (RSST1), méthode T1 stationnaire rapide, est une méthode IRM rapide
qui exploite les effets de relaxation longitudinale T1 en présence d’un agent de contraste (AC)
paramagnétique et conduit à créer un état stationnaire dynamique rapide du signal. La méthode RSST1 est basée sur un modèle à deux compartiments du tissu cérébral (extra- et
intravasculaire). Le compartiment extravasculaire est caractérisé par des temps de relaxation T1
longs et le milieu intravasculaire est caractérisé par des temps de relaxation T1 courts car, dans
ce compartiment les molécules d’eau sont en contact avec l’AC supposé purement vasculaire. Avec les développements récents dans le traitement du cancer par des médicaments
antiangiogéniques, il est fort utile de pouvoir quantifier l’effet de ces médicaments en mesurant le VSC qui est directement lié à la densité vasculaire. Pour que la méthode RSST1 proposée
souvent accompagnées par des lésions de la BHE, il est important que le modèle à deux compartiments puisse être valable. Les AC autorisés en clinique sont connus pour s’extravaser dans la plupart des tumeurs et quittent le système vasculaire. Des mesures de la fVSC
réalisées dans ce cas seront erronées. Une partie de ce travail de thèse a été orientée pour évaluer les conditions de leur utilisation pour des mesures précises du VSC dans des modèles de tumeur maligne chez le rat.
Le chapitre suivant est un chapitre de revue bibliographique des méthodes IRM qui permettent de mesurer des paramètres vasculaires fonctionnelles pour l’évaluation du cancer. Comme ce travail est interdisciplinaire, il est composé de trois grandes parties.
La première partie est une vue d’ensemble sur les paramètres morphologiques et fonctionnels de la microvascularisation et décrit l’angiogenèse et les facteurs impliqués dans ce processus. On définit également la classification des tumeurs cérébrales et on présente les différents modèles animaux des tumeurs cérébrales malignes.
La deuxième partie concerne les propriétés de relaxation des AC et en particulier leur compartimentation dans le tissu. Finalement, dans la dernière partie, les bases
méthodologiques des techniques d’imagerie médicale sont introduites et en particulier des techniques IRM utilisés pour quantifier le VSC.
La partie expérimentale de ce manuscrit est divisée en six chapitres correspondant à six études avec des buts différents. Les deux premiers chapitres concernent le développement
méthodologique de la méthode RSST1 et ses applications au cerveau de rat sain. Les autres
chapitres étudient les conditions d’utilisation de différent AC expérimentaux pour la
quantification de la fraction volumique sanguine cérébrale (fVSC) dans deux modèles de tumeur chez le rat RG2 et C6. Les mesures de la fVSC sont comparées puis validées en utilisant des méthodes alternatives. Dans un cas on utilise la méthode IRM stationnaire basée sur les effets de la relaxation transverse T2* et dans un autre cas on utilise une analyse histologique de la
morphologie vasculaire.
Dans le chapitre I, la théorie de la méthode est détaillée et les hypothèses et les conditions expérimentales sont vérifiées par des modélisations du signal et par des expériences in vitro. Le Gd-DOTA, un AC de petite taille moléculaire admis en clinique, et le P760, un AC expérimental de taille moléculaire intermédiaire caractérisé par une relaxivité longitudinale plus élevée, tous les deux des Laboratoires Guerbet, sont utilisés. La sensibilité de la méthode RSST1 aux
changements physiologiques du VSC est étudiée. Les facteurs qui influencent la précision de la mesure de la fVSC sont évalués et les avantages et les limites de la méthode sont étudiés. Le chapitre II concerne d’autres développements nécessaires pour l’utilisation de la méthode RSST1 avec le SINEREM, un AC superparamagnétique admis en clinique des Laboratoires
Guerbet, et caractérisé par une relaxivité transversale élevée. Les développements consistent en l’implémentation d’une méthode d’acquisition de projection rétroprojection en trois
dimensions, pour cartographier la fVSC du cerveau entier et pour permettre un temps d’écho court. La fVSC est comparée à celle obtenue par la méthode stationnaire basée sur les effets T2* en utilisant le même AC.
L’étude décrite dans le chapitre III a été menée pour évaluer en utilisant la méthode RSST1 et la
méthode stationnaire basée sur les effets T2* si le SINEREM reste intravasculaire dans un
modèle de tumeur RG2.
Le chapitre IV concerne la caractérisation physicochimique, la biocompatibilité et la
biodistribution de Gd-ACX, un AC expérimental du CEA. Son potentiel pour la cartographie de la fVSC dans un modèle de tumeur C6 est évalué et comparé avec le Gd-DOTA.
Dans le chaptire V, une étude est décrite, qui valide la mesure de la fVSC dans les tumeurs C6 obtenu par IRM avec le Gd-ACX comme AC, en utilisant une analyse histologique de la
morphométrie vasculaire combinée avec une méthode stéréologique pour l’estimation de la fVSC.
Finalement, le chapitre VI concerne la possibilité d’estimer la fVSC quand l’AC s’extravase. Le potentiel de la méthode RSST1 proposée pour suivre dynamiquement le profil d’extravasation de
Gd-DOTA et P760 dans un modèle de tumeur RG2 est étudié. Un modèle pharmacocinétique est appliqué au profil d’extravasation permettant simultanément l’estimation de la fVSC, d’un paramètre lié à la perméabilité de l’endothelium pour l’AC et du volume de distribution extravasculaire de l’AC.
Literature review
1. Purpose of the literature review
The purpose of this work is to validate a fast T1-based MRI method for CBV quantification in
malignant tumor tissue.
Before describing the theoretical framework of this method and the validation studies in chapter I to VI, this introductory chapter presents a literature review of existing MRI methods for CBVf mapping. Furthermore, the purpose of this chapter is:
to define the physiological parameter called CBV or CBVf, to show how it is altered in the case of brain pathologies,
to demonstrate its importance in the clinical assessment of brain tumors, to explain why a quantitative measurement, i.e. absolute CBV, is preferred, to explain why an imaging technique is necessary,
to show the benefit of MRI techniques with respect to other medical imaging techniques, to describe fast MRI techniques,
to compare T1- T2- and T2*-based MRI methods for CBVf mapping, and to explain why a T1
-based technique has been chosen,
to review the classes of CA that are used to assign different relaxation properties to the vascular compartment.
To begin with, the morphology and physiology of microvasculature is first described in order to correctly define the CBVf and to determine the accuracy with which this parameter is measured with different techniques. Then the relevance of CBVf quantification in cancer research and in the management of cancer patients is pointed out. Medical imaging and in particular MRI techniques used in oncology are reviewed.
2. Brain microvasculature
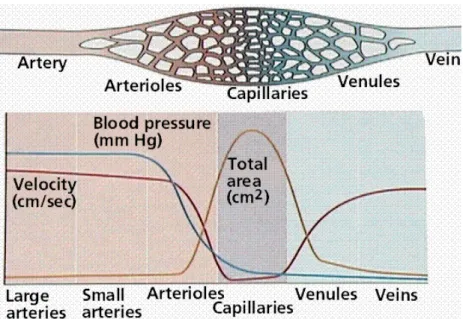
In the direction of blood flow, the brain vasculature is composed of large arteries (e. g. anterior cerebral artery, pial arteries) branching into smaller arteries followed by arterioles (diameters ≈ 100 µm). With decreasing radii, the total amount of vessels and vascular surface Sv (cm2/cm3 or
cm2/g) increases considerably (Fig. 0-2a), facilitating the homogeneous irrigation of the tissue
and the transport of molecules to or from the interstitium, respectively. This exchange takes place in the capillary network. The blood pressure and velocity decrease to facilitate the exchange. The blood flow into the capillary network is regulated by nerve-controlled sphincters that exist at the arteriolar level. The blood is then drained from the tissue by small venules and veins increasing in size into high-volume, low-pressure venous systems known as venous or dural sinuses.
Moving in an outward direction across the blood vessel wall, arterial vessels are formed by layers called intima (made up of endothelial cells), the basal lamina (also called basement membrane, a 40 nm thick membrane composed of type IV collagen and other substances), the elastic lamina, media (comprised of smooth muscle cells) and adventitia (comprised of fibroblasts producing collagen fibers). The veins have thinner walls, and most lack the smooth muscle cell layer.
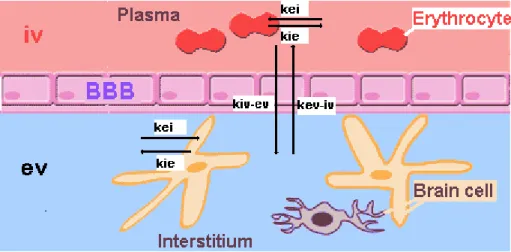
2.1. The blood brain barrier
The radii of capillaries average 4 µm (Guyton and Hall 1997; Ross 1991). They are composed of a unique layer of endothelial cells, the endothelium, which is of continuous type in the brain (Fig. 0-2b). The adjacent endothelial cell membranes at the luminal end fuse and are connected by structures called the tight junctions, composed of transmembrane proteins called occludin and claudin. Other transmembrane proteins such as zonula occludens proteins and cadherins provide additional adhesion towards the abluminal (brain) side. A molecular model of this cellular adhesions is proposed by Huber et al (Huber et al. 2001). In addition, pericytes and foot like processes of astrocytes surround the basal lamina. This forms an entity called the blood brain barrier (BBB), which is a regulatory interface between the blood and the cerebral parenchyma. It is permeable to oxygen, carbon dioxide, hormones, carbohydrates, amino acids, fat, ammonia, lactate etc, but impermeable to many water soluble macromolecules, such as drugs (penicillin) and albumin. Since the paracellular transport of molecules is greatly reduced by the
interendothelial tight junctions, they have to cross the endothelial cells (transendothelial transport), with the consequence that intra-/extravascular exchange is controlled by the cell. The paucity of cytoplasmatic vesicles shows that substances are rarely carried across the endothelial cell by vesicular transport as it happens in most extracerebral tissues (Coomber and Stewart 1985). Differences in the activity of various hydrolytic enzymes at the luminal and abluminal cell membrane indicate the polarity of endothelial function in the control of the blood brain interface (Betz and Goldstein 1978; Brownson et al. 1994; Farrell and Pardridge 1991; Minn et al. 1991). The passage of a substance across the BBB may depend upon its lipid solubility, electrical charge, molecular size, dissociation constant, affinity for a carrier molecule or the capacity of the BBB for active transport of this substance.
Fig 0-2: the vascular system in vertebrates
a: Changes in blood pressure, velocity, and the surface area of the arteries, capillaries, and veins of the circulatory system. Image source (Purves et al. 1995)
b: Continuous capillary endothelium in brain (left) and discontinuous capillary endothelium in liver (right) with distinct intercellular gaps and broken basal lamina. 1. capillary lumen, 2. endothelial cell, 3. basal lamina, 4 Astrocyte process. Image source (Kahle 1991)
b
2.2. The morphology of vasculature
The morphology and quantity of the vasculature is organ specific (Chang et al. 1982). Both can change considerably during a disease process (Seitz et al. 1988) either because of adaptation to new metabolic demands of the affected tissue or because the cells forming the vessels are affected themselves by the pathology. In adaptation to temporally varying metabolic demands, the vasculature undergoes dynamic changes even under physiologic conditions. For example, the vessels are known to dilate or to open vascular shunts (alternative circulatory pathways) when the partial arterial carbon dioxide tension (PaCO2), the arterial pH or the core temperature
increases or the partial arterial oxygen tension (PaO2) decreases. In some pathologies, such as
in malignant tumors, the ability of the microvasculature to respond to such physiologic stimuli can be reduced, and can be used to characterize the disease (Julien et al. 2004; Mazurchuk et al. 1999).
Several parameters are used to describe and quantify the vascular network at a microscopic level. Microvascular density, Nv (cm-2), simply reports the number of vessels regardless of their
shape, orientation or size. The microvascular surface Sv is important for the exchange
processes. The total surface area of the brain microvasculature, available for exchange processes between blood and interstitium is approximately 100 cm2g-1 tissue (Pardridge et al.
1990). Another such parameter is the length density Lv (cm/cm3), which is the total length of
microvessels existing per unit volume or tissue mass. The vessel radii are important for rheological considerations because they define the cross sectional area that in turn is one of the
parameters that determines the blood flow rate. The mean intervascular distance is an index of the access of an interstitial cell to the exchange processes at the vascular boundary, since in the interstitium transport is mainly governed by diffusion. The mean intercapillary distance in the human brain is about 40 µm (Duvernoy et al. 1983). Other morphological parameters that change under physiologic and pathologic conditions exist, e. g. the tortuosity.
2.3. Hemodynamic parameters
From this point of view, medical imaging techniques, such as computed tomography (CT), positron emission tomography (PET) and MRI are rather macroscopic techniques. Vascular parameters accessible by these imaging techniques are the regional blood volume, which is the quantity of blood that participates in the supply of oxygen and nutrients and in the discharge of toxic metabolites. In addition, techniques exist, that allow the measurement of the amount of blood arriving and leaving the tissue of interest in a time interval. This is called the regional perfusion or blood flow. The average cerebral blood flow (CBF) in humans is approximately 50 ml/min per 100g of brain tissue, but may be higher (above 150 ml/min per 100g) in small animals (Calamante et al. 1999; Ginsberg et al. 1985; Rudin and Sauter 1991). Another often reported quantity related to the regional blood volume and flow is the mean transit time (MTT), the average time required for blood to pass through the tissue volume of interest. The permeability of the microvasculature to a substance is often reported as the product of the diffusional permeability coefficient P (cm min-1) and the surface area S
v. PSv has the unit of a volume flow
per tissue mass (ml min-1 g-1). Only values averaged over the volume of the voxel can be
obtained and information about the morphology of the vasculature is lost. However, one MRI technique is sensitive to vessel radii, and the parameter obtained is called the vessel size index (VSI). It will be briefly described in a different paragraph.
Just like and in addition to morphologic analysis of the vasculature, the quantification of such hemodynamic parameters can be useful to study the tissue function and viability in the case of pathologic transformation (Aksoy and Lev 2000). Although the macrovasculature can be involved (Bullitt et al. 2005), most cerebrovascular diseases begin at the microvascular or capillary level. Detection of pathology at the microvascular level is consequently favorable because treatment could be started at an earlier stage of the disease, possibly even before irreversible clinical symptoms develop. The CBV and perfusion are tightly related since only perfused vessels will contribute to the signal change when CAs are used for the measurement.
Therefore, even in brain pathologies that mostly affect tissue perfusion, such as acute cerebral ischemia, the CBVf measure can be of use. Brain pathologies that are accompanied by vascular changes reflected by altered CBV, CBF, BBB permeability or combinations thereof, are brain infarction (ischemia) (Maeda et al. 1997; Rosen 1992; Rother et al. 1996), multiple sclerosis (Broom et al. 2005; Sibson et al. 2002), some forms of dementia such as Alzheimer's disease (Harris et al. 1996; Harris et al. 1998; Maas et al. 1997), Aquired Immune Deficiency Syndrome associated brain diseases (Ernst et al. 1998; Tracey et al. 1998), and traumatic brain injury (Garnett et al. 2001). The main objects of this work are the vascular changes occurring in the development of brain tumors, which require particular methodologic developments, because the BBB becomes permeable to most CAs.
3. Brain tumors
3.1. Epidemiology
In many countries, cancer is one of the three leading causes of death, only outnumbered by cardiovascular diseases (heart diseases, stroke etc). Despite some medical advances reflected in prolonged survival times, no curative treatment has been developed for the majority of tumors. In a report from the American Cancer Society in 2007 (American-Cancer-Society 2007), the annual incidence and mortality of brain and other central nervous system (CNS) tumors in the United States are 20 500 (1.4% of all new cancer cases) and 12 740 (2.3% of all cancer related deaths), respectively. Worldwide, approximately 176,000 new cases of brain and other CNS tumors were diagnosed in the year 2000, with an estimated mortality of 128,000 (Parkin et al. 2001).
3.2. Primary brain tumors
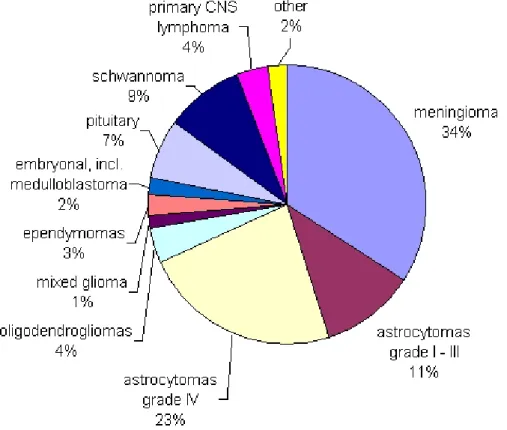
Brain tumors account for over 4/5 of all primary central nervous system tumors (Levin et al. 2001). Primary brain tumors (Fig. 0-3) arise from brain cells, rather than metastasizing to the brain from elsewhere in the body. Meningiomas and other mesenchymal tumors account for approximately 27% of primary brain tumors (Levin et al. 2001). Gliomas are the most common (about 50%) primary neoplasms of the brain (Russell and Rubinstein 1989). There are three
main types of glioma: astrocytoma, ependymoma and oligodendroglioma. About 5% of brain tumors are ependymomas. These develop from so-called ependymal cells, which line the ventricles and spinal cord. Oligodendrogliomas develop from cells called oligodendrocytes that produce the myelin. This glioma type can contain calcium and bleeds easily. Astrocytoma is the commonest type of glioma. Therefore, the terms "astrocytoma” and “glioma” are often employed interchangeably. They vary histologically and are graded into four categories by the World Health Organization (Kleihues et al. 1993).
3.3. Grading
Criteria for grading are the mitotic index (growth rate), vascularity, presence of necrotic areas, invasive potential and the cell differentiation. Grade I gliomas are pilocytic astrocytomas. They grow slowly and rarely spread into adjacent tissue. Grade II gliomas are diffuse astrocytomas, which can invade adjacent tissues and progress to a higher grade. Grade III anaplastic astrocytomas are classified as malignant. The most aggressive grade IV astrocytoma is also called glioblastoma multiforme. Anaplastic astrocytoma and glioblastoma account for approximately 38% of primary brain tumors (Levin et al. 2001).
Mixed gliomas or anaplastic oligodendrogliomas (e.g. oligoastrocytoma = grade II and anaplastic oligoastrocytoma = grade III) contain more than one type of glial cell, usually astrocytes and other glial cell types like oligodendrocytes. The gliosarcoma variant of glioblastoma contains both neuro-ectodermal and mesenchymal elements (fibrous, muscle, bone, cartilage tissue). The prognosis is affected by the cell type with the highest grade present in the tumor. Treatment also focuses on the most malignant cell type found within the tumor.
Other less common primary brain tumors include for example pituitary tumors, schwannomas, CNS lymphomas, and medulloblastomas, the latter mainly occurring in children. The frequency of brain metastases is at least 10 fold higher than primary neoplasms. Brain metastasis occurs in 20% to 40% of cancer patients (Patchell 2003). The exact incidence is unknown, because no national cancer registry documents brain metastases, but it has been estimated that 98,000 to 170,000 new cases are diagnosed in the United States each year (Hutter et al. 2003; Levin et al. 2001). This number may be increasing because of the capacity and increasing sensitivity of imaging modalities such as MRI to detect small metastases and because of prolonged survival resulting from improved systemic therapy (Levin et al. 2001; Patchell 2003). The most common
primary cancers metastasizing to the brain are lung cancer (50%), breast cancer (15%–20%), melanoma (10%), and colon cancer (5%) (Patchell 2003).
Fig. 0-3: Primary CNS tumors, major histopathologic types and their distribution. Source Central Brain Tumor Registry of the United States 1998 - 2002 (http://www.cbtrus.org/2005-2006/tables/2006.table8.pdf)
3.4. Orthotopic rat brain tumor models
Fundamental research necessitating invasive procedures is carried out on animal models of diseases. Although no animal brain tumor model exactly simulates human high grade brain tumors, many of their biological and biochemical properties, including invasive growth pattern, neovascularization and alteration of the BBB, are similar enough to clinically encountered neoplasms. They provide a means to study many issues, from fundamental aspects of
oncogenesis, angiogenesis and invasion to the in vivo response to anticancer therapies. Orthotopic brain tumor models grow in their natural environment, the brain, and additionally provide information about their effect on the adjacent nervous tissue. Syngeneic tumor models can be used in immunocompetent animals without induction of alloimmunogenic responses. Table 0-1 sums up the main orthotopic rat glioma models used in preclinical research and is focused on those obtained by stereotactical intracerebral implantation as concentrated cell suspensions, exhibiting the highest reproducibility. Except the U87 MG cell line, which is a human glioma xenograft, all tumor types have originally been induced in rat brain by a carcinogenic procedure (chemical substance, avian sarcoma virus or radiation) (Barth 1998).
Table 0-1: main orthotopic rat glioma models
tumor model
reference histopathologic classification
grade rat strain
9L, TL gliosarcoma IV Fischer
C6
(Benda et al. 1971;
Schmidek et al. 1971) astrocytoma III Wistar
F98 (Ko et al. 1980) anaplastic glioma III - IV Fischer RG2, D74 (Aas et al. 1995) anaplastic glioma IV Fischer RT 2 (Copeland et al. 1975) anaplastic astrocytoma III Fischer
U87 MG (Tamargo et al. 1988) human glioblastoma IV nude athymic rats or other species
3.5. Angiogenesis
The more aggressive tumor types grow rapidly and have a high metabolism. Growth of solid tumors beyond a diameter of 1 – 2 mm requires the proliferation and formation of new blood vessels by sprouting from existent vessels for the supply of nutriments and oxygen (Folkman 1996; Zama et al. 1991). This process is called neo-angiogenesis. Metastasis occurs via the new tumor microvasculature, too. Failure to induce appropriate angiogenesis leads to necrosis and apoptosis of the cells in the central parts of the tumor that suffer for example of hypoxia. Blood vessel proliferation is a dynamic balance of stimulators and inhibitors. Tumor angiogenesis results from the secretion of angiogenic factors by the tumor cells (Folkman 1992) and by loss of physiological inhibition of endothelial cell proliferation. Angiogenic factors include growth factors such as fibroblast growth factors (FGF), platelet derived growth factor (PDGF),
vascular permeability or vascular endothelial growth factor (VPF/VEGF), tumor necrosis factor-alpha (TNF-factor-alpha), a number of cytokines etc (Cockerill et al. 1995; Hormigo et al. 2007). There are more than twenty known endogenous angiogenesis stimulating factors. The angiogenic growth factors bind to specific receptors located on the endothelial cells of existing vessels, activating a cellular signalling cascade. The activated endothelial cells begin to proliferate and to produce enzymes that dissolve the basal lamina. Transmembrane adhesion proteins (integrins) and enzymes (matrix metalloproteases) further facilitate the migration of endothelial cells towards the tumor and the formation of new blood vessel tubes, which are then stabilized by pericytes (Cuenod et al. 2006).
The morphology of blood vessels in many solid tumors deviate markedly from the vessels in healthy tissue (Cuenod et al. 2006; Dewhirst et al. 1989), which leads to altered blood flow that is spatially more heterogeneous (Carmeliet and Jain 2000; Tozer et al. 1990). There is also an alteration in relative volumes of major tissue compartments, such as the vascular and extravascular extracellular compartments (Jain 1987). In addition, tumor capillaries often differ from those of the surrounding brain in their permeability (Cuenod et al. 2006).
3.6. Treatment modalities
Brain tumors are treated with surgery, radiation therapy and chemotherapy. Depending on the type, location, and size of the tumor, as well as the patient's age and general health status, a multimodal approach may be used. If surgery can not be performed or the resection is incomplete radiotherapy and chemotherapy are generally used as secondary or adjuvant treatments. Different radiotherapy techniques are available including external fractionated radiotherapy, implant radiotherapy, and stereotactic radiosurgery. Chemotherapy drugs prescribed for brain tumors include temozolomide, procarbazine, lomustine, vincristine, cisplatin, carmustine, and carboplatin. Carmustine is also given by polymer wafer implant during surgery (Ewend et al. 2007), and methotrexate may be administered intrathecally (injected directly into spinal fluid). Treating brain tumors with chemotherapy can be difficult because the blood brain barrier can prevent some chemotherapy drugs from entering the brain.
The identification of molecular markers associated with tumor but not with normal tissue has allowed the development of highly specific, targeted therapies for the treatment of cancer. Molecularly targeted therapy is designed to inhibit a molecule produced by cancer cells to promote their survival, proliferation or spread. This therapy is called "smart" because these
medications are specific to cancer cells and have fewer side effects than traditional chemotherapy drugs. For example, nanoparticles coated with gold and specifically targeted to cancer cells can absorb specific wavelength of light. Activated by a laser, the photothermal agent produces intense heat that kills the cancer cells (El-Sayed et al. 2006). Single dendrimers, a few nanometer in size, can carry a molecule that recognizes cancer cells, a therapeutic agent to kill those cells, and a molecule that can be detected by a medical imaging technique or that recognizes the signals of cell death. They are designed to release their contents only in the presence of certain trigger molecules associated with cancer, making the targeted therapy far more effective and less toxic than conventional chemotherapy. Successful treatment with such a vehicle loaded with the anticancer drug methotrexate, folic acid, and a fluorescent imaging agent has been reported in mice (Kukowska-Latallo et al. 2005). Cancer cells possess much more folate receptors on their surface than normal cells, and capture the whole complex, including the drug and the imaging agent. However, these works are still at a very early stage and problems like how to make these drugs cross the BBB have not been solved yet.
3.7. Antiangiogenic treatment
The amount of vascularization of brain tumors has been correlated to their prognosis (Abdulrauf et al. 1998; Assimakopoulou et al. 1997; Brem et al. 1972; Leon et al. 1996). In 1971 Judah Folkman has postulated that inhibition of tumor angiogenesis could cure cancer (Folkman 1971). In 1975 Judah Folkman and Henry Brem discovered the first natural angiogenesis inhibitor (Brem and Folkman 1975), and it was also Judah Folkman who managed to demonstrate suppressed tumor growth caused by a plasminogen fragment called angiostatin (O'Reilly et al. 1994). Today, there is a long list of known endogeneous angiogenesis inhibitors, and also a number of synthetic molecules that have shown a therapeutic potential in experimental studies or are tested in clinical studies.
One class of angiogenesis inhibitors being tested in cancer patients are molecules that directly inhibit the growth of endothelial cells, such as the endogeneous angiostatin and endostatin (collagen XVIII fragment) (Kirsch et al. 2001). Combretastatin A4, causes apoptosis of growing endothelial cells. Other drugs interact with the membrane protein integrin such as Vitaxin®, a
monoclonal antibody directed against the alpha-v/beta-3 endothelial integrin. A second class are molecules that block or interfere with steps in the angiogenesis signalling cascade. Included in this category are epidermal growth factor receptor antibodies and anti-VEGF antibodies.