RESEARCH OUTPUTS / RÉSULTATS DE RECHERCHE
Author(s) - Auteur(s) :
Publication date - Date de publication :
Permanent link - Permalien :
Rights / License - Licence de droit d’auteur :
Bibliothèque Universitaire Moretus Plantin
Institutional Repository - Research Portal
Dépôt Institutionnel - Portail de la Recherche
researchportal.unamur.be
University of Namur
Emulation of a Downlink Spreading Factor Allocation Strategy for Rel'99 UMTS
Van Peteghem, Hugues; Schumacher, Laurent
Published in:
Proceedings of the 64th Vehicular Technology Conference (VTC-fall) - Montreal (Canada), 25-28 September 2006
Publication date:
2006
Document Version
Early version, also known as pre-print
Link to publication
Citation for pulished version (HARVARD):
Van Peteghem, H & Schumacher, L 2006, 'Emulation of a Downlink Spreading Factor Allocation Strategy for Rel'99 UMTS', Proceedings of the 64th Vehicular Technology Conference (VTC-fall) - Montreal (Canada), 25-28
September 2006. <http://www.info.fundp.ac.be/~hvp/rech/pub/index_en.html>
General rights
Copyright and moral rights for the publications made accessible in the public portal are retained by the authors and/or other copyright owners and it is a condition of accessing publications that users recognise and abide by the legal requirements associated with these rights. • Users may download and print one copy of any publication from the public portal for the purpose of private study or research. • You may not further distribute the material or use it for any profit-making activity or commercial gain
• You may freely distribute the URL identifying the publication in the public portal ? Take down policy
If you believe that this document breaches copyright please contact us providing details, and we will remove access to the work immediately and investigate your claim.
Emulation of a Downlink Spreading Factor
Allocation Strategy for Rel’99 UMTS
Van Peteghem H. and Schumacher L.
Pˆole “R´eseaux et S´ecurit´e” FUNDP - The University of Namur
Namur, Belgium
{hvp,lsc}@info.fundp.ac.be
Abstract— Based on the end-to-end delay experienced by the
user, this paper derives a spreading factor allocation map for the four UMTS traffic classes and for four user profiles with the help of a computer testbed emulating the UTRAN. Using this allocation map, the performance of the UTRAN is measured in terms of cell throughput and blocking rate in different scenarios.
I. INTRODUCTION
With the huge improvement of bandwidth and strong support of Quality of Service (QoS) in the Universal Mobile Telecommunications System (UMTS) core network, the UMTS Terrestrial Radio Access Network (UTRAN), especially its air interface, is now the bottleneck for the delivery of value added services. Indeed, compared to wired links, wireless links have a smaller bandwidth and are then not fitted to effectively support QoS as we consider it over a wired network. Therefore, an adaptation has to be made to take into account the lower bandwidth of such links. To overcome this problem, the air interface resources have to be carefully managed according to the traffic to be sent over the wireless interface.
The rest of this paper is organised as follows. Section II exposes the link existing between the Spreading Factor (SF) and the data rate available. Section III presents our SF allocation scheme based on the four UMTS traffic classes and four user profiles. Section IV evaluates the resulting SF allocation map to the operator requirements such as cell throughput and blocking rate. Section V explains our next steps in this research. Finally conclusions are drawn in Section VI.
II. SPREADINGFACTORS ANDDATARATES
Since the UMTS uses Wideband Code Division Multiple Access (WCDMA) as air interface, it has to respect the spreading/despreading concept [1]. Transmissions from a sin-gle source are separated by channelisation codes. The spread-ing/channelisation codes of UTRAN are based on the Orthogo-nal Variable Spreading Factor (OVSF) technique. These codes are picked from a code tree related to one sector and managed at the Radio Network Controller (RNC).
The spreading code allocated to a flow and the bandwidth it will receive are tightly linked: the SF defines how many
chips are used to code one user data symbol. As a result, the longer the spreading code, the lower the data rate. As
WCDMA supports a maximal chip rate of3.84 Mcps and the
available downlink SFs range from4 to 512, Table I (excerpt
from [2]) gives the available downlink data rates in Rel’99 UMTS.
TABLE I
AVAILABLE DOWNLINK DATA RATES INREL’99 UMTS
Spreading Factor Maximum User Data Rate (½ rate coding) 512 3 kbps 256 7.5 kbps 128 15 kbps 64 30 kbps 32 60 kbps 16 120 kbps 8 240 kbps 4 480 kbps
From our point of view, the SF allocation scheme is based on two main properties: the requirements of the data flow itself (traffic class) and the expectation of the user equipment (UE) receiving the data flow (user profile).
A. Traffic Classes
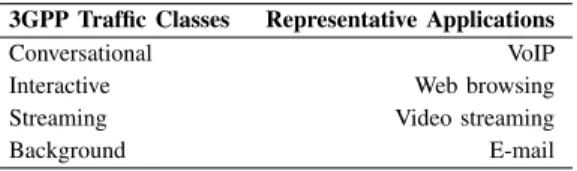
In [3], the 3rd Generation Partnership Project (3GPP) has
defined four traffic classes that need to be supported in UMTS. In order to characterise them, it might be useful to focus on four representative applications (Table II).
TABLE II
TRAFFIC CLASSES AND APPLICATIONS
3GPP Traffic Classes Representative Applications
Conversational VoIP
Interactive Web browsing
Streaming Video streaming
Background E-mail
According to which traffic class a given flow belongs to, its QoS requirements in terms of delay, packet loss and bandwidth will vary. An important aspect to take into account during the
SF allocation is that the Conversational and Streaming classes are considered as real-time flows, which means their
end-to-end delay has to be upper-bounded by a few hundred ms.
On the other hand, the non real-time traffic sets less stringent delay requirements. However, the Interactive class involves human participation and then requires a delay respecting this
responsive behaviour (< 1 s). Finally, the packet delay is not
that much important for the Background traffic. Nevertheless
delays higher than10 s should be avoided.
In accordance with [4], we will assume the following
traffic classes distribution:27% Conversational sessions, 48%
Interactive, 10% Streaming and 15% Background.
B. User Profiles
We have define four different user profiles which seems to be easily mapped on a real cellular network:
• Platinum: Business Contracts. These users will get the
best treatment and the larger bandwidth possible accord-ing to the network state.
• Gold: Postpaid Contracts. These are expensive contracts
which allow the user to easily access the different appli-cations.
• Silver: Postpaid Contracts. These are the classical
con-tracts for an ordinary use of a mobile terminal.
• Bronze: Prepaid Contract. The less expensive contracts
designed for a minimal use of a mobile terminal. These users’ data will mainly be scheduled as best-effort traffic.
In our emulations, we will assume a 5% Platinum, 10%
Gold,15% Silver and 70% Bronze distribution inferred from
postpaid-prepaid ratios recently published by Belgian cellular network operators.
III. SPREADINGFACTOR ALLOCATIONSCHEME
A. Emulation Assumptions
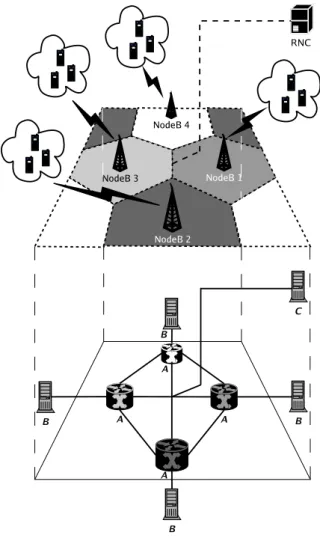
Our work is based on a computer testbed emulating the
UTRAN [5]. As shown on Fig. 1, it consists of 9 PCs
respectively standing for the RNC, 4 NodeBs and 4 sets of
UEs. We emulate 4 macrocell trisectorial NodeBs, each of
them managing a population of UEs over a 27 km2 world
surface.
Synthetic traffic whose distribution complies with the
char-acteristics of the 4 traffic classes is generated from (to) the
RNC to (from) the PC emulating a given UE in the downlink (uplink). These data flows are mapped to Dedicated CHannels (DCHs) which suffer from DCH allocation delay and queueing delay at the NodeB.
Our UEs are mobile and evolve in an urban area. They are
mapped on four specific UE speeds: 3 km/h representing a
pedestrian walk,30 and 70 km/h which represents a UE on
board of a vehicle inside a city and 120 km/h which
repre-sents a UE embarked on a train or on a car on the speedway. The UE speed is fixed at the beginning of the emulation and it remains constant until the end of the emulation. In the urban
area scenario, the UE speed distribution is the following:30%
at 3 km/h, 40% at 30 km/h, 20% at 70 km/h and 10% at
120 km/h.
We finally assume a perfect Radio Link Control (RLC) layer such that there is no retransmission delay and we allocate a quarter of the OVSF tree to signalisation and data transfer over common channels.
Fig. 1. UTRAN testbed representation.
With all these hypotheses, we have emulate several scenar-ios testing different SF allocations for all traffic classes. We were looking for the range of SFs that would enable to meet
the mean delay requirements of the 4 traffic classes (Section
II-A). Emulation was performed with a single UE, to avoid any code starvation or blocking at this stage of the study. The different kinds of traffic were generated with an inter-session
arrival mean of300 s. The emulation length has been fixed to
5, 000 s.
B. Results
Figs. 2-3 represent the mean packet delay. This delay is computed by post-processing the log files of the synthetic traf-fic generator program [6]. It corresponds to a user experienced delay since it is calculated at the application layer. Note that the mean packet delay only refers to delaying in the UTRAN. Core network delays should be added to get the full end-to-end delay.
1 10 100 1000 10000 100000 4 8 16 32 64 128 256 512
Mean Packet Delay [ms]
Spreading Factor Allocated
Conversational & Streaming Limit
Conversational Streaming (Low Quality) Streaming (High Quality) Acceptable Delay Limit
Fig. 2. Real-time traffic mean packet delay vs. allocated SF.
Fig. 2 depicts the results obtained for the real-time flows which have a stringent delay requirement. The edge delay is
upper-bounded by 100 ms so as to leave some time budget
margin for delays in the core network.
The Conversational class is based on a 12.2 kbps AMR
vocoder. The network data flow hence never exceeds20 kbps.
In these circumstances, it would be a waste of network
resources to allocate a SF< 64, whatever the user profile.
The Streaming flows are divided in two categories: high and low quality. This traffic class is the most bandwidth demanding, so it will require the smallest SF. We can see in Fig. 2 that the high quality undergoes unacceptable packet
delay using SF > 4. The same conclusion can be drawn
for the low quality streaming with SF > 8. Therefore we
decided to give the possibility to use a SF = 4 (high quality
streaming) only to the Platinum users. Should the OVSF tree not accept their request, Platinum users would enjoy a lower
quality streaming session with SF = 8, the only SF available
for the other user profiles.
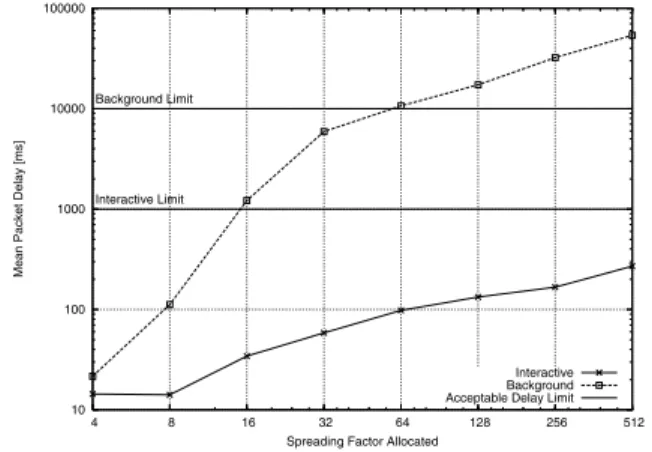
10 100 1000 10000 100000 4 8 16 32 64 128 256 512
Mean Packet Delay [ms]
Spreading Factor Allocated Interactive Limit
Background Limit
Interactive Background Acceptable Delay Limit
Fig. 3. Non real-time traffic mean packet delay vs. allocated SF.
The non real-time traffic mean packet delay is shown on Fig. 3. We notice that the Interactive traffic class suffers from a moderate delay regardless of the received SF. This can be explained by the nature of the traffic. Web browsing consists of multiple little downloads (successive pages) separated with page reading times. The bandwidth required for this traffic
class is rather small. The SF allocation logic here is to allocate
a16-chip spreading code to the Platinum users allowing them
to downgrade their request to a SF = 512 if the OVSF tree
has not enough room to accept their previous request. In a
similar way, the Gold users begin with a SF= 32, the Silver
ones with SF= 64 and the Bronze users with SF = 128. All
of them have also the opportunity to downgrade to512.
Finally the Background traffic represents massive down-loads and thus, even if it does not require a small mean packet delay, it has to receive some bandwidth. That is why we choose
to allocate a SF= 8 to Platinum users which can degrade to
16 or even 32. Gold users have the ability to access a SF = 16 or 32 and the only spreading code length available for
the other users is 32.
We choose not to allocate smaller SFs to non real-time traffic since the very substantial delay gain that would result would be obtained at the risk of code starvation. Table III summarises our SF allocation map.
TABLE III SFALLOCATION MAP
Platinum Gold Silver Bronze Conversational [64] [64] [64] [64] Interactive [16 − 512] [32 − 512] [64 − 512] [128 − 512]
Streaming (H) [4] n.a. n.a. n.a.
Streaming (L) [8] [8] [8] [8]
Background [8 − 32] [16 − 32] [32] [32]
IV. BLOCKINGRATE ANDCELLTHROUGHPUT
In the previous Section, the SF allocation scheme has not taken into account the operator’s point of view, i.e. the blocking rate and the cell throughput levels. We have then injected this SF allocation map into new emulations in order to evaluate its impact in three different scenarios:
• the operator’s worst case (OWC), where all the UEs get
the smallest possible SF or are blocked,
• the user’s worst case (UWC), where all of them receive
their maximal SF, and
• the OWC where downgrading is enabled in order to avoid
blocking as much as possible (OWC+).
Note that when a UE receives a SF at the beginning of a session, be it minimal, maximal or degraded, it keeps it until the end of its currently opened session. To optimise the code placement and replacement of successive SF requests and to avoid the fragmentation of the OVSF tree, we have implemented the crowded-first algorithm proposed in [7].
We decided to load each sector with 8 UEs (total of 96
UEs in the emulated 4-cell world) generating the different
kinds of traffic which will definitely lead to blocked calls.
The emulation length has been fixed at 5, 400 s.
The different blocking rates are presented on Fig. 4. As we could expect, the number of accepted SF queries in the UWC is greater than in the OWC. Indeed, in the UWC scenario the OVSF tree fills up more slowly since all the UEs requests their
90 92 94 96 98 100 102 OWC+ UWC OWC SF Queries % Testing Scenarios Blocked Queries Degraded Queries Accepted Queries
Fig. 4. Accepted/degraded/blocked SF queries.
maximal SF. That leads to less resource consumption and less blocked SF queries.
We can also see that the OWC+ gives approximately the same number of accepted queries as in the OWC. But, thanks to the downgrading, the number of blocked queries is lower.
The cell throughputs obtained in the different cases are depicted on Fig. 5. In the UWC, it appears clearly that even if the UEs are not able to use as much as bandwidth as they
0.1 0.2 0.3 0.4 0.5 0.6 0.7 0.8 0.9 1 0 200 400 600 800 1000 Traffic %
Traffic Rate (Kbits/s)
OWC UWC OWC+
Fig. 5. Cdf of cell throughputs.
would need, more UEs are able to transfer data which leads to a better cell throughput. In the OWC, the UEs are able to use all the bandwidth they need but, due to the OVSF tree structure, all of them waste a little bit of resource leading to a smaller cell throughput.
The OWC+ scenario gives approximately the same cell throughput as the OWC due to the small number of degraded
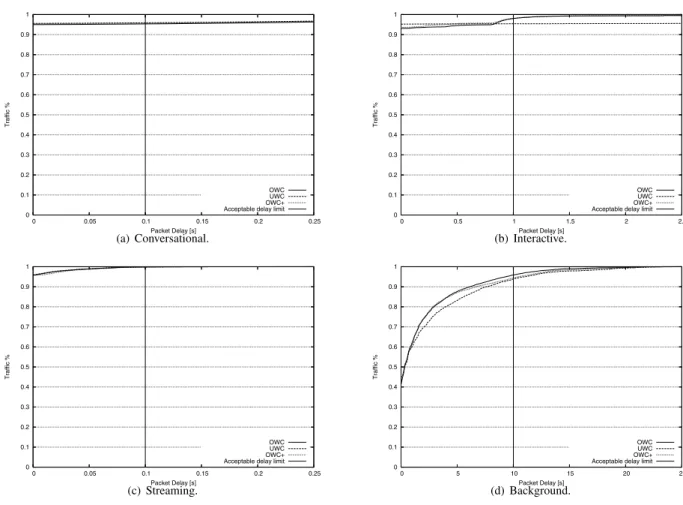
queries (about1%). 0 0.1 0.2 0.3 0.4 0.5 0.6 0.7 0.8 0.9 1 0 0.05 0.1 0.15 0.2 0.25 Traffic % Packet Delay [s] OWC UWC OWC+ Acceptable delay limit
(a) Conversational. 0 0.1 0.2 0.3 0.4 0.5 0.6 0.7 0.8 0.9 1 0 0.5 1 1.5 2 2.5 Traffic % Packet Delay [s] OWC UWC OWC+ Acceptable delay limit
(b) Interactive. 0 0.1 0.2 0.3 0.4 0.5 0.6 0.7 0.8 0.9 1 0 0.05 0.1 0.15 0.2 0.25 Traffic % Packet Delay [s] OWC UWC OWC+ Acceptable delay limit
(c) Streaming. 0 0.1 0.2 0.3 0.4 0.5 0.6 0.7 0.8 0.9 1 0 5 10 15 20 25 Traffic % Packet Delay [s] OWC UWC OWC+ Acceptable delay limit
(d) Background. Fig. 6. Cdfs of mean packet delay.
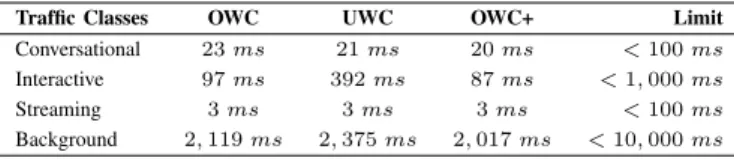
TABLE IV
TRAFFIC CLASSES MEAN PACKET DELAY
Traffic Classes OWC UWC OWC+ Limit
Conversational 23 ms 21 ms 20 ms < 100 ms Interactive 97 ms 392 ms 87 ms < 1, 000 ms Streaming 3 ms 3 ms 3 ms < 100 ms Background 2, 119 ms 2, 375 ms 2, 017 ms < 10, 000 ms
We can finally compare the packet delay in the different case. Table IV summarises these values for the different traffic classes where Fig. 6 depicts their cdfs, and equivalently the ratio of satisfied users.
We can see that the ratio of satisfied users (whose mean packet delay is lower than traffic class requirement) are identical for Conversational and Streaming traffic classes. This is obvious since a single SF is available regardless of the scenario. Only Interactive and Background traffic could be impacted by downgrading the SF allocated to a session. Indeed, in the UWC this ratio is slightly lower than in the OWC and OWC+ scenarios.
The mean packet delay is also higher in the UWC, although still below its relevant upper bound. This difference is extremely noticeable in the Interactive case where the
SF allocated to a session can be as high as 512, where in
Background it can not be greater than 32.
It is to be said that the difference between the OWC and the OWC+ scenarios is rather small here due to the small number of degraded sessions. The OWC+ scenario would certainly give better results by allowing downgrading to ongoing sessions.
V. FUTUREWORKS
Disregarding the Dedicated Shared CHannel (DSCH), user’s data may use two different Rel’99 UMTS transport channels to transit over wireless interface:
• DCH: it carries a single user data with a fixed bit rate
depending on the spreading factor allocated by the RNC, and
• Forward Access CHannel (FACH): it carries small
amounts of different user data using time multiplexing. Its bandwidth is rather small since it is not supposed to support large data transfers.
Based on the 3GPP standardisation [1], the transport channel used depends on the traffic class (Table V) according to a decision of the RNC.
In this paper we have directly allocated a DCH to each user session to identify the optimal SF allocation map. The idea now will be to allow the Interactive and Background sessions to use the FACH and to implement the following channel switching policy: a connection uses the common channel
(FACH) until we get an indication that the current burst might be long (the queue length exceeds a fixed threshold), then the RNC shall try to allocate a DCH to that connection. In the opposite way, when no more packets are sent using the DCH, a timer is initialised and the connection remains on the DCH during this period. If there are no new arrivals within this timeout period, the connection is switched back to FACH.
TABLE V
TRAFFIC CLASSES AND CHANNELS MAPPING
3GPP Traffic Classes Authorised Transport Channel(s)
Conversational DCH
Interactive FACH or DCH
Streaming DCH
Background FACH or DCH
These two parameters are respectively known as upswitch threshold (from DCH to FACH) and downswitch timer (from FACH to DCH) [8] and have to be optimally set up.
VI. CONCLUSION
We have presented the first results obtained in terms of QoS management using our computer testbed. We have established a SF allocation map giving the best possible treatment to a data flow depending on its traffic class and the user profile of the UE receiving the flow. We have then evaluated this allocation scheme with respect to the operators requirements (cell throughput and blocked rate) in different scenarios.
ACKNOWLEDGMENT
The authors would like to thank the anonymous reviewers for their valuable comments.
REFERENCES
[1] J. Laiho, A. Wacker, and T. Novosad, Radio Network Planning and
Optimisation for UMTS, 2nd ed. Wiley inter-science, 2006.
[2] H. Holma and A. Toskala, WCDMA for UMTS, 3rd ed. Wiley inter-science, Oct. 2004.
[3] Technical Specification Group Radio Access Network, “TS 23.107 V6.3.0, Quality of Service (QoS) concept and architecture,” 3rd Gen-eration Partnership Project (3GPP), Tech. Rep., June 2005.
[4] D. Soldani, “QoS Management in UMTS Terrestrial Radio Access FDD Networks,” Ph.D. dissertation, Helsinki University of Technology, Oct. 2005.
[5] H. Van Peteghem and L. Schumacher, “Description of an IPv6 Linux-Based UTRAN Testbed,” in Proceedings of the2ndInternational
Con-ference on Testbeds and Research Infrastructures for the Development of Networks and Communities (TridentCom), Barcelona (Spain), Mar. 2006.
[6] “Traffic generator tool,” http://www.postel.org/tg/tg.htm, last visited: 16 February 2006.
[7] Y.-C. Tseng, C.-M. Chao, and S.-L. Wu, “Code Placement and Replace-ment Strategies for Wideband CDMA OVSF Code Tree,” ManageReplace-ment
IEEE Transactions on Mobile Computing, Dec. 2002.
[8] B. J. Prabhu, A. Altman, K. Avratchenkov, and J. Abadia Dominguez, “A simulation study of TCP performance over UMTS Downlink,” in
Proceedings of the 58th Vehicular Technology Conference (VTC-fall), Orlando (FL - USA), Oct. 2003.