Publisher’s version / Version de l'éditeur:
Thermochimica acta, 2, 5, pp. 393-403, 1971-07
READ THESE TERMS AND CONDITIONS CAREFULLY BEFORE USING THIS WEBSITE. https://nrc-publications.canada.ca/eng/copyright
Vous avez des questions? Nous pouvons vous aider. Pour communiquer directement avec un auteur, consultez la première page de la revue dans laquelle son article a été publié afin de trouver ses coordonnées. Si vous n’arrivez pas à les repérer, communiquez avec nous à [email protected].
Questions? Contact the NRC Publications Archive team at
[email protected]. If you wish to email the authors directly, please see the first page of the publication for their contact information.
NRC Publications Archive
Archives des publications du CNRC
This publication could be one of several versions: author’s original, accepted manuscript or the publisher’s version. / La version de cette publication peut être l’une des suivantes : la version prépublication de l’auteur, la version acceptée du manuscrit ou la version de l’éditeur.
Access and use of this website and the material on it are subject to the Terms and Conditions set forth at
Modified thermal analysis equipment and technique for study under
controlled humidity conditions
Feldman, R. F.; Ramachandran, V. S.
https://publications-cnrc.canada.ca/fra/droits
L’accès à ce site Web et l’utilisation de son contenu sont assujettis aux conditions présentées dans le site LISEZ CES CONDITIONS ATTENTIVEMENT AVANT D’UTILISER CE SITE WEB.
NRC Publications Record / Notice d'Archives des publications de CNRC:
https://nrc-publications.canada.ca/eng/view/object/?id=1444ce9c-810c-4c83-a0e2-5cccde4f0012 https://publications-cnrc.canada.ca/fra/voir/objet/?id=1444ce9c-810c-4c83-a0e2-5cccde4f0012APPAREIL MODIFIE D'ANALYSE THERMIQUE ET TECHNIQUES D'ETUDE SOUS DES CONDITIONS CONTROLEES D'HUMIDITE
SOMMAIRE
L'article ddcrit un appareil qui facilite les essais par analyse thermique ponddrale et analyse therrnique diffdrentielle sur des Bchantillons exposds
A
des conditions prdddtermindes. Les rksultats sont prdsentds pour le verre poreux et le ciment portland hydratd. Pour le verre poreux, les essais obtenusA
l'aide d'une balance d'ab- sorption et d'absorption en vacuum peuvent Etre reproduits par analyse thermique d'dchantillons conditionnds individuellement. I1 n'est pas possible de distinguer entre une seule ou plusieurs couches d'eau adsorbde. Pour le cirnent portland hydratd cependant, deux extremes ont dtd notds et interprdtds comme dtant respectivement des couches intermddiaires et de l'eau adsorbde. Ceci semble confirmer le nouveau mod6le pour le ciment portland hydratd.Thermochimico Acto
Elsevier Publishing Company, Amsterdam Printed in Belgium
MODIFIED T H E R M A L ANALYSIS EQUIPMENT A N D T E C H N I Q U E F O R S T U D Y U N D E R CONTROLLED H U M I D I T Y CONDITIONS*
R. F. FELDMAN AND V. S. RAMACHANDRAN
Division of Building Research, National Research Council of Canada, Ottalua (Canada)
(Received November 20th, 1970)
ABSTRACT
An apparatus is described that enables samples to be run on both DTA and T G A with prior exposure only to a desired condition.
Results are presented for porous glass and hydrated portland cement. For porous glass the runs obtained by a vacuum sorption balance can be reproduced by thermal analysis of separately conditioned samples, and no distinction can be made between monolayer and multilayer adsorbed water. For hydrated portland cement, however, two peaks were detected and interpreted, respectively, as interlayer and adsorbed water. This supports the new model for hydrated portland cement.
INTRODUCTION
Dynamic methods of differential thermal analysis (DTA) and thermogravi- metric analysis (TGA) have been extensively applied in clay mineral studies and recently have attained great importance in inorganic chemistry1-'. As these tech- niques are applied in diverse fields, there is a continuous demand for special types of equipment that will suit a particular field of activity. This demand has resulted in many modified types of equipment designed to meet very special requirements.
In cement chemistry, clay mineralogy, and colloid chemistry extreme caution is required in the drying of materials prior to thermal analysis. They are very sensitive to humidity conditions. Different workers have shown variability in thermal effects, especially below 200°C, and this can be traced to different methods of drying the samples. In clay mineralogy a recent recommendation states that all clays be equili- brated to 56% R H over C a ( N 0 3 ) , . 4 H 2 0 prior to analysis. As this salt has a high temperature coefficient, Wink and Searsg have suggested the use of Mg(N03), . 6 H 2 0 . No attempt has been made to ensure the transference of the material a t a constant temperature and humidity to the specimen container cf the thermal unit.
In examining hydrated products of cements by thermal methods the drying procedure is very critical. Insufficient drying may not effectively remove the physi- cally held water and too severe a drying may remove the chemically held water. In *This paper is a contribution from the Division o f Building Research, National Research Council o f Canada, and is published with the approval o f the Director o f the Division.
394 R . F. FELDMAN, V . S. RAMACHANDRAN addition, exposure t o carbon dioxide in a humid atmosphere may carbonate the hydrated cement. In the thermal analysis of cement pastes no uniform method of drying has yet been attempted.
Greenel' has suggested vacuum-drying of the sample a t 1 o r 2 mm H g for 2 to 3 h. Kalousek et a/." washed the samples four times with acetone, twice with ethyl ether, and dried them at a pressure of 0.01 mni for 1 h. In recent studies Kalousek recommends passing the sample through 30-mesh. inundating it in pure acetone for 3 min, suction-filtering and finally.evacuating at 4-5 x torr for 24 h. Re)i'2 has found that washing with acetone and ether and evacuation in vacuum for 6 h is insufficient to remove all the physically held water. A more efficient treatment consisted of treatment with acetone followed by five washings with ether and drying at 0. I mm H g for I h. Copeland and HayesI3 have reported that hydrated cement pastes should be dried in a vacuum desiccator connected to a trap with dry ice at - 78.j°C
at a vapour pressure of 5 x 1 0 - 4 mm/Hg (known as the rl-drying method j.
In general, in thermal investigations of cementitious materials the material is placed in the specimen holder at the ambient humidity and temperature conditions following an arbitrary drying procedure. Under these conditions the information obtained is of limited use.
A new model for hydrated portland cement has recently been p r o p o s e d ' 4 L 4 . It is based on the fact that a large proportion of the water formerly considered to be adsorbed water is in fact interlayer water. There is thus great interest in experiments that provide a means of distinguishing between types of water, adsorbed and other. at the low temperature region of thermal analysis techniques. A technique by which samples conditioned t o various humidities could be placed in e q ~ i p m e n t and main- tained at a particular humidity free of interference from ambient humidity conditions and carbon dioxide would therefore be useful. By such humidity-controlled thermal analysis results could be used t o plot a relation of the amount of water adsorbed a t different humidities (isotherm).
This paper describes a method of carrying out DTA and TGA under controlled conditions of humidity. The usefulness of these techniques is illustrated by investi- gation of porous glass arid hydrated portland cement exposed to different humidities. EXPERIMENTAL
Equipment
DTA. -The 900-DuPont Thermal Analyzer is used for differential thermal
measurements. This unit has a remote plug-in module called the calorimetric cell. Two silver cups are located in separate air cavities in a heating block in the cell. Chromel-alumel thermocouples contact the bottom o r the holders. Samples are placed in disposable cups made of aluminum. A bell jar covers the cell during ope- ration.
The cell is placed in a gloved box controlled a t the required humidity and connected to the recorder through a length of shielded wire. Samples of required
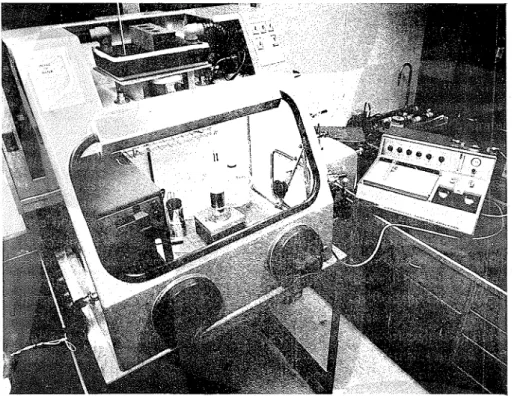
STUDY UNDER CONTROLLED HUMIDITY CONDITIONS 395 quantity are weighed in a balance placed in the gloved box (Fig. 1). The samples contained in disposable liners made of aluminum are then placed in the silver cup. An inert material, a-Al,O,, is placed in the other silver cup. The cell is covered with a bell jar and thermal curves are obtained at a heating rate of IO°C'min.
Fig. I . DTA in a coritrolled hurilidity box
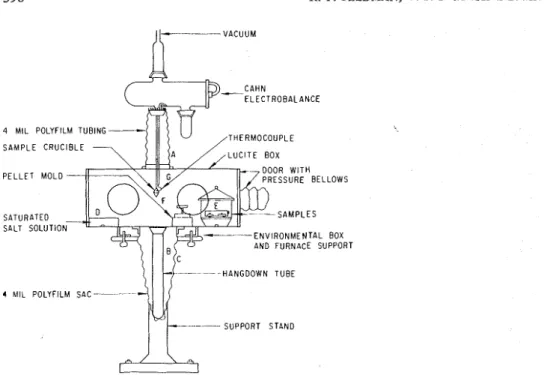
TGA. - A gloved environn~ental box was constructed so that the conditioned sample could be placed in a Cahn R H electrobalance. Fig. 2 shows a schematic diagram of the box, which is constructed of lucite and is 32 x 12 x 12 in. A tube (A) on the top of the box connects the box to the balance through the position of the hang-down tube. This polyethylene tube is constructed of 4-mil film inaterial and is fastened to the gloved box and the balance container by an O-ring and a spring clip, respectively. The hang-down tube (B) is supported by another po!yfilm sac (C) at the bottom of the gloved box. A container and stirrer (D) for humidity control and a mould for making small pellets of the sample are included. The conditioning desic- cator (E) containing the sample is placed in the box. When box and balance are at the required relative humidity, the desiccator is opened, the material placed in the mould and the pellet made.
The pellet is formed at low pressures to avoid loss of sample when rapid decom- position occurs. It is placed in the sample crucible (F) and a thermocouple (G) is fixed close to it. After balancing adjustments have been made, the hang-down
ir---
VACUUM ELECTROBALANCE4 MIL POLYFILM TUBING-
THERMOCOUPLE SAMPLE CRUCIBLE
PELLET MOLD- PRESSURE BELLOWS
SATURATED
ENVIRONMENTAL BOX AND FURNACE SUPPORT
- -- HANGDOWN TUBE
4 hllL POLYFILM SAC - -
SUPPORT STAND
Fig. 2. Environmental glove box for mounting samples in electrobalance at controlled conditions
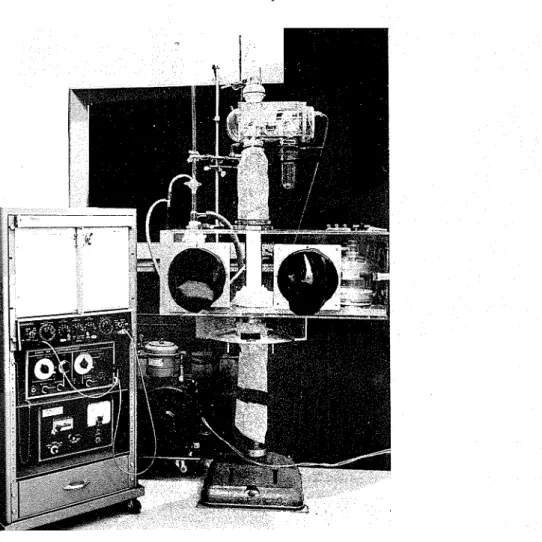
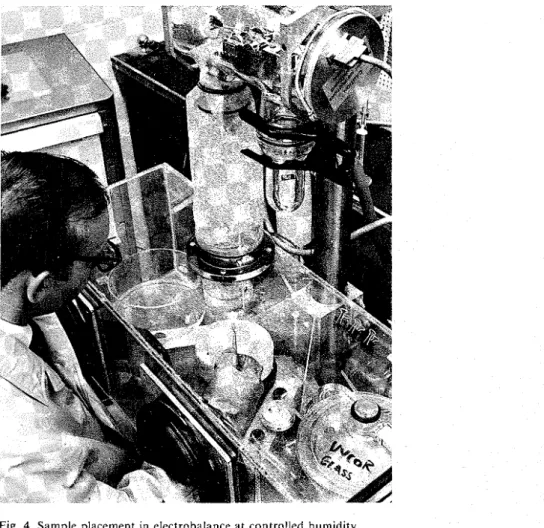
tube is carefully drawn up from C into A and fastened onto the Cahn balance, so that the sample is enclosed in the balance without being exposed t o outside conditions. The box and connections are removed from the balance, the furnace is mounted, and the run started, usually under vacuum conditions. Figs. 3 and 4 describe the set-up with the box in position and the placement of the sample, respectively.
Materials
Porous glass (No. 7930) was supplied by Corning Glass Works in the form of 2.5-cm diameter tubes of 0.2-cm thickness. Surface area, measured by nitrogen adsorp- tion, was 178 m2Ig. Pieces of the tube were taken for water a d s o ~ p t i o n in the high vacuum apparatus. Samples ground to pass a 100-mesh sieve and heated t o 150°C for 24 h were conditioned at different humidities for DTA and T G A analysis.
Portland cement, ASTM Type 11, was bottle-hydrated for 18 months at a water-solid ratio of 5. T h e liquid was filtered off and the cement was placed in a desic- cator a t 11 % RH and retained for 6 months under vacuum to ensure equilibrium at this condition.
Procedure
Samples of both porous glass and hydrated cement were stored in desiccators a t 11,32,44, 58, 65, 68,75, 83 and 100% relative humidity obtained by using saturated solutions of various salts (Table I). Great care was taken t o ensure that these humi- dities were attained. Stirring was essential, but could be only intermittent because heating of the solution by the magnetic stirrer caused the humidity to increase.
STUDY UNDER CONTROLLED HUMIDITY CONDITIONS
Samples of porous glass were taken from the 100% RH condition and placed in of the lower conditions to obtain the desorption isotherm.
397 each
Fig. 3. TGA set-up with controlled humidity box in position. TABLE I
SALTS USED FOR HUMIDITY CONDITIONS LISTED
Relative Itumidity, % Salt
LiCI. H 2 0 CaCIZ. 6 H Z 0 K 2 C 0 3 ' 2 H 2 0 NaBr. 2H,O NaN02 CuC12. 2H20 NaCl KBr H z 0 Thermochim. Acta, 2 (1971) 393403
398 R. F. FELDMAN, V. S. RAMACHANDRAN
Fig. 4. Sample placement in electrobalance a t controlled humidity.
RESULTS
D TA
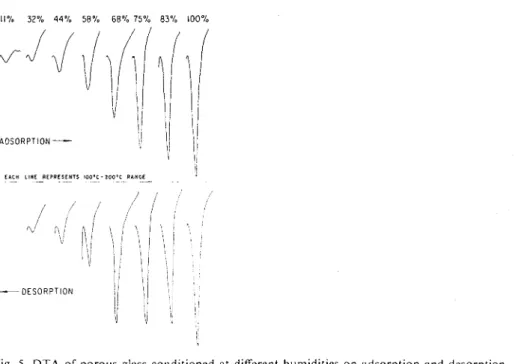
Porous Glass. - Fig. 5 gives DTA curves forthe samples of porous glass condi-
tioned at humidities of ll,32,44,58,68,75,83 and 100% RH on both adsorption and desorption. The peak at 95°C for 1 1 % RH grows as the humidity is increased, shifting to about 105"C, but there is no major change in the characteristics of the adsorbed monolayer (which is complete at approximately 11% RH) and the subsequently adsorbed multilayers. Fig. 6 shows a plot of peak height us. relative humidity and a qualitative picture of the isotherm, including the hysteresis loop (see isotherm ob- tained by vacuum sorption balance, Fig. 7). Continued heating above 175°C results in a further loss of water, which is in the form of hydroxyl groups on the surface of the glass16. This does not result in any prominent peak and does not appear to be affected by the humidity condition.
STUDY UNDER CONTROLLED HUMIDITY CONDITIONS
Fig. 5. D T A of porous glass conditioned at different humidities on adsorption and desorption.
Fig. 6. Adsorption-desorption isotherms of porous glass determined by D T A .
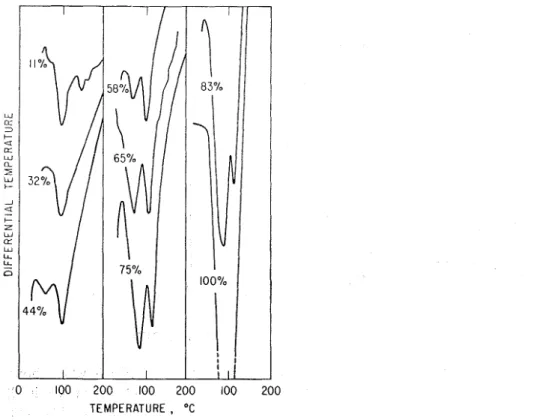
Hydratedportland cement. - DTA curves are presented on Fig. 8, which shows
the effects up to 200°C, the area of interest. Two endothermic peaks are present in all curves a t different humidities; one a t temperatures varying from 90 to 1 IO°C, and growing with humidity; the other at temperatures from 120 to 150°C, and remaining relatively constant. At 11 and 32% R H the low temperature peak is present as a small shoulder, but by 43% R H it is well developed. Between 65 and 75% RH the low temperature peak has exceeded the higher temperature peak in height. Previous work1' was not able to show this clear separation of peaks. It is considered in the
400 R. F. FELDMAN, V. S. RAMACHANDRAN
present work to represent a separation of adsorbed and interlayer water. This point will be referred to again in the discussion.
Fig. 7. Isotherms of porous glass. ( a ) , vacuum sorption; (b). therniogravimetric analysis.
0 I00 200 100 200 100 200
TEMPERATURE, O C
Fig. 8. DTA of portland cement paste equilibrated to different humidities.
TGA and isotherm results
Porous glass. - Two isotherms are plotted on Fig. 7. These results were ob- tained by vacuum sorption balance and by Cahn thermal electrobalance, respectively.
STUDY UNDER CONTROLLED HUMIDITY CONDITIONS 40 1
In the latter case samples were loaded into the balance at their respective humidities by means of the gloved box. It may be seen that the two methods give similar results: the hysteresis range, the total adsorbed water, and the general shape of the curve are similar. The isotherm obtained by the salt solution technique cannot be considered as reproducible as the sorption balance technique, but it is presented to show that the method of loading samples into the thermal balance works well to preserve the state and condition of the sample and thus can be used for studying the state of the water or the characteristics of unstable hydrates in the low temperature range of TGA. In the vacuum sorption balance the sample was heated a t 150°C for 24 h in high vacuum before the start of the isotherm determination.
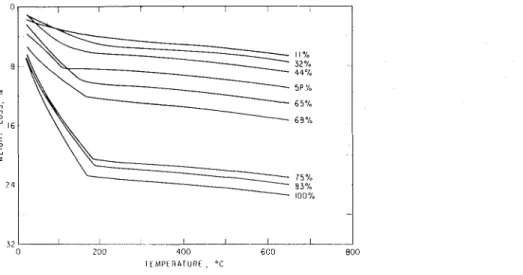
The results for T G A are shown on Fig. 9 for all samples conditioned from 11 to 100% RH. As humidity increases the weight loss in the low temperature region
Fig. 9. Therniogravimetric analysis of porous glass conditioned at different relative humidities.
increases, as was observed in DTA. This rapid weight loss ends quite abruptly at approxiniately 180°C and is followed by a linear reglon of relatively low weight loss up to 650°C, where the runs were terminated. This weight loss is considered to be due to the decomposition of hydroxyl groups on the surface of the glass and not part of the physically adsorbed water. It niay be observed that beyond 180°C the curves for the samples at all the relative humidity conditions are parallel, showing that relative humidity does not affect this part of the curve, i.e., the quantity of chemically held
water does not increase with relative humidity under these conditions. Consequently, the amount of physically held water was estimated for the thermogravinietric isotherm by the weight loss after heating to 250°C.
Hydratedportlandcenient. - T G A was performed on the same samples reported
for DTA. Similar results were obtained. It was not possible to take an arbitrary temperature on the normal T G A curve and obtain weight loss giving a satisfactory isotherm. This was achieved by placing the sample in the ther~iial balance and heating
it in vacuum a t a constant temperature of 100°C for 3 h. By this technique a n isotherm was obtained very similar to that obtained by normal vacuum sorption balance tech- . niques.
DISCUSSION
These results a r e only the initial stage of a wider program that includes different degrees of initial drying of samples, including cl-drying" a n d lengthy times of condi- tioning. It has been shown that the technique is suitable for studying the hydrated portland cement-water system. It has also been shown that no clcar difference can be observed in the D T A cilrves betwcer~ the n ~ o n o l a y c r anci milltilayers of adsorbed water o n porous glass. In hydrated portl:~nd cement, on tile other hand. two low temperature peaks were observed, the lowcr of thesc growing from I I 00 I1 1-1. t h c higher remaining relatively constant. F r o m previous work involving sorption a n d length change scanning isotherms of water o n hyclratcd portland ceiiient i t was concluded that at I IU/u R H less than 10'!4 of the total water (rcferretl to in cement chemistry a s evaporablei8) was physically adsorbcii, thc remainder being mainly interlayer. This would explain the smaller l o w temperature peak in the DT'A ~.csulrs. In this work also, t h e adsorbed water arid interlayer water wcrc c c l ~ ~ a l in quantity : ~ t aboilt 65 to 70'!40 RIH. This can be inferred by c x a i ~ i i n i r ~ g the IITA curves in I-ig. 8, it' one concludes that the low ten1perature peak is adsorbed water a n d the higher peak interlayer water. '
Previoils workcrs17 did not obtain S L I C ~ a clear separation of peaks, a n d it mirst
be concludeti that this is due to the lack of humidity control in their thcrmal analysis and possibly to low sensitivity.
These results have led to further work where the samples have been dried t o different degrees before conditioning. Early indications are that the results will confirm the present tentative conclusions.
CONCLUSIONS
(1) A n apparatus has been designed that enables thermal analysis under con- trolled humidity conditions (both D T A and T G A ) of materials that change in state o r composition with humidity o r react with components of the air.
(2) T G A a n d D T A analyses of porous glass reproduce a n isotherm similar t o that of the normal adsorption technique.
(3) T h e difference between t h e monolayer a n d multilayers o f adsorbed water cannot be detected by DTA.
(4) Thermal analysis of hydrated portland cement produces t w o endothermal peaks a t low temperatures, a n d the results allow t h e tentative conclusion that t h e lower temperature one is d u e t o adsorbed water, t h e other d u e t o interlayer water.
STUDY UNDER CONTROLLED HUMIDITY CONDITIONS
ACKNOWLEDGMENTS
The nature of this paper clearly indicates the important role played by labora- tory assistants. The authors wish to acknowledge, therefore. the competence of S.E. Dods, G. M. Polomark and H. F. Slade and to thank them for their contribution to this research project.
R E F E R E N C E S
I C . D ~ V A L , Itrorgotric. Tltert~rogrcrui~tretric Atiolysis, Elsevier, New York, 1963. 722 pages.
2 R. S C H W E N K E R A N D P. D . G A R N (Eds.), T/rerr?rtr/ Atrolysis, Val. 2, Academic I'ress, New York, 1969, l 508 pagcs.
3 V. S. K A M A C H A N D R A N , Applic(rtiotr~ of' DTA it! Crtrrrtrt Chet?ristr~., Chemical ~ u b l i s h i n ~ Co., New York. 1969, 308 pages.
4 K. C. M A C K E N Z I E (Ed.), Diffrrrtrtiol Tl~erttretl Atrcrlysis, VOI. 1 and 11, Academic Press, L o n d o n , 1970, 775 pages.
5 D. S C ~ I U L T Z E , Diffi,r(,ttti(tl Tlrertttootrol~~se, Verlag Chernie, Wcinheirn, 1969, 335 pages.
6 W. J . SMOTHERS A N D YAO C H I A N G , licrtrdhooli 01 D T A , Chemical Publishing Co., New York, 1966, 633 pages.
7 H. G . M C A D I E (Ed.), Proc. I , 1 1 otrd 111 Torotrto Syttrposiro~r 0 1 1 Tlrert?rcrl Atrc;lysis, 1965, 1967.
1969, pp. 162, 144, 277.
8 J . P. KEDFERN (Ed.), Tlrerttrul Atrtrlysis, 1965, MacMillan, London, 1965, 293 pages. 9 W. A. W I N K A N D G . R . SEARS, Tcrppi., 33 (1950) p. 96A.
10 K . T. G R E E N E , Proc. 4th Itrt. Syttrp. Clrettr. C'ettrrttts, Woslritrgtotr, 1960, p. 359.
1 1 G . L. KALOUSEK, C . W. D A V I S AN[) W . E. SCHMERTZ, J . AtI~er.. Cutler. I t l ~ t . , 20 (1949) 693. 12 M. K E Y , Siliccttes Itrci., 22 (1957) 533.
I3 L. E. COPELAND A N D J . C . H A Y E S , A S T M BIIII., 194 (1953) 70. I4 R. F. F E L D M A N A N D P. J . S E R E D A , M(rt6r. Cotrstr., I (1968) 509.
15 R. F. F E L I ) ~ I A N , 5tll /lit. S,l'ttt/I. C/~Oltt. C ~ t t t ~ t l t ~ , To/<J'o, 1968, V01. 111, p. 53. 16 J . H O C K E Y , Chettr. Itrd., (1965) 57.
17 G . E N G L L R T A N D F. W I T T M A N N , Mcrtc;r. C'ottstr., 6 (1968) 535-546.
18 T. C. POWERS A N D T. L. BROWNYARD, J. Atner. Cotrcr. Itrsr. Proc., 43 (1947) 276.