PASSIVE CONTROL STRATEGY FOR MIXING VENTILATION IN
HEATING MODE USING LOBED INSERTS
Pierre Bragança1, Kodjovi Sodjavi1, Amina Meslem2,* Ilinca Nastase3
1 LaSIE, University of La Rochelle, Pôle Sciences et Technologie, avenue Michel Crépeau,
17042, La Rochelle, France
2 LGCGM EA3913, University of Rennes 1, 3 rue du Clos Courtel, BP 90422, 35704 Rennes
Cedex 7, France
,
3 CAMBI Research Centre, Faculty of Building Services Engineering, Technical University of
Civil Engineering in Bucharest, Romania
*Corresponding author email: [email protected]
Research Highlights:
Flow pattern and thermal comfort are analyzed in a room under mixing ventilation > A vertical hot jet is generated by a conventional ceiling multi-cone diffuser > The effect of inserted lobes into the conventional diffuser is analyzed > Significant improvement of thermal comfort is achieved due to jet induction increase > It was not observed a significant increase in pressure drop and noise
ABSTRACT
The main purpose of ventilation systems is to satisfy the need of occupants in terms of thermal comfort and air quality. In the case of mixing ventilation, based on the use of jets from one or from multiple diffusers placed in the room, the fresh air and the thermal loads should be distributed in the entire occupied zone. Therefore, the design of the diffusers must aim, beyond aesthetic aspect, the ability to provide a good mixing between the jet and the ambient air. Enhancement of jet induction by means of lobed inserts into a diffuser, was recently proposed in an European patent as a promising and low-cost solution for improving the performance of HVAC systems. In this paper, an experimental investigation on jet characteristics and thermal comfort generated by a classical multi-cone ceiling-mounted diffuser is proposed. Its performance is compared with the same diffuser equipped with lobed inserts. A simplified heated manikin simulates the presence of a human body in the test room. Airflow pattern from the diffuser and its interaction with the manikin were analyzed with whole-field PIV technique.
Thermal comfort was analyzed based on traditional pointwise measuring probes and on the standard ISO 7730. It is revealed that the thermal comfort was significantly improved using the lobed diffuser compared to the conventional one, without increase of pressure drop and sound pressure levels.
KEYWORDS
Mixing ventilation; Ceiling diffuser, Heating mode, Lobed inserts, Lobed jet, Thermal comfort
1. INTRODUCTION
The main purpose of ventilation systems is to satisfy the need for thermal comfort and air quality for the occupants. This objective however has to be accompanied by the lowest possible energy consumption. The three design criteria must be considered as they are fundamental to the thermal environment and energy performance. For mixing ventilation purpose, a high induction level is required because it allows an optimal mix of the ventilating jet with its ambient air such that occupants will be satisfied in terms of thermal comfort and air quality. Ceiling diffusers have gained popularity since the sixties [1], and nowadays they are the most used terminal devices in commercial and office buildings. Koestel [2] studied the jet flow patterns from ceiling diffusers based on both experimental data and jet theory. The author gives a set of equations allowing a designer of air distribution systems to estimate air jets velocities under isothermal conditions. In the case of multi-cone diffusers, the author shows the importance of the angle () between the ceiling and the axis tangent to the inner surface of the cones. When the diffuser is not flush mounted, the jet attaches to the ceiling under Coanda effect for ≤ 45°, independently of the inlet volumetric flow rate. For > 45 °, the supplied air tends to form a downward vertical jet. The review paper of Becher [1] gives interesting information and practical recommendations on different types of air outlets for building ventilation systems, among them, the circular ceiling diffuser. Similar equations than those proposed by Koestel [2] are given. When the circular ceiling diffuser is flush mounted, the supplied air tends to form a radial ceiling attached jet with < 30°.For > 30°, the supplied air forms an annular downward vertical jet, and a vacuum in the void space below the central part of the diffuser appears. As a consequence, a recirculation zone is forming in the vacuum region. Koestel [2] also mentioned that phenomenon. As described in ASHRAE Fundamental handbook [3], the airflow pattern in cooling mode from such a ceiling diffuser is projected downward to the floor and follows it, producing a stagnant region near the ceiling. In heating
mode, the airflow reaches the floor and folds back toward the ceiling. If the downward air does not reach the floor, a stagnant zone appears near the floor. Based on these features, modern commercial multi-cone diffusers were developed to mechanically adjust the inner cones, to switch from vertical flow pattern in heating mode, to horizontal flow pattern in cooling mode. The adjustment of the cones could be automatic or manual.
Considering that the efficiency of mixing ventilation systems relies on a better mix between ventilating jets and the ambient air, some studies were conducted to find suitable diffusers geometries with high induction features. The vortex diffusers were studied for that purpose, because they produce jet flows with a high degree of spin, allowing an increase in jet induction. The spin is generated by guide vanes placed inside the diffuser. The use of vortex diffusers could be considered as a traditional strategy of jet passive control to enhance jet induction in mixing ventilation. Chuah et al. [4] conducted in isothermal conditions, a comparative study of a ceiling vortex diffuser to two multi-cone ceiling diffusers and were particularly interested in their induction performances. Shakerin and Miller [5] have conducted a similar study, by comparing under isothermal conditions three vortex diffusers to a conventional circular multi-cone diffuser. In the two studies the authors came to the same conclusion, i.e., the vortex diffusers have better induction performance than the multi-cone diffusers. They observed, however, that the vortex diffusers required higher static pressure than the multi-cone diffuser. Vortex diffusers have other limitations related to the long throw that is provided. They are suitable for rooms where the ceiling is rather high.
The innovative concept of lobed diffuser to achieve high induction in mixing ventilation of buildings was proposed for the first time by Meslem et al. and Nastase et al. in [6, 7]. Lobed geometry was defined either by lobed fins integrated into a rectangular grille diffuser [7] or by lobed orifices integrated into a perforated panel diffuser [6]. The authors conducted fundamental fluid mechanics studies on elementary lobed jets for the characterization of the phenomena at the origin of the entrainment increase, in comparison to reference round jets [8-12]. The proposed concept of lobed diffuser relies on the idea of relatively inexpensive and simple modification of the exit boundary geometry of a conventional diffuser. That idea is inspired by other domains i.e., combustion and aeronautic. In fact, lobed geometries were widely used before in combustion chambers to improve their efficiency and reduce their emission of pollutants [13, 14]. Also, they have been integrated into ejectors of aircraft engines to improve their thrust [15, 16], to attenuate their noise level [17], or to attenuate their infrared signature in military application [18].
In mixing ventilation, high mixing between primary air and ambient air is desired so that occupants would be more satisfied in terms of thermal comfort and air quality. It was shown that entrainment of the jet issued from the grille with lobed fins is 1.5 times higher than the one of the jet from the standard grille with straight fins. Furthermore, the geometry of the lobed grille was not found to generate supplementary noise and pressure losses were found to have similar values for innovative and standard grilles. As for the perforated panel diffuser [6], the use of cross-shaped orifices allows to induce on average two times more ambient air into the jet than circular orifices. Despite the consequent gain in air induction for the lobed perforated panel flow, the streamwise maximum velocities display comparable values in the far field, which signifies comparable throws for the two flows [6].
The objective of the standards ISO 7730 [19] and ASHRAE 55 [20] is to provide an engineering tool for thermal comfort assessment inside the occupied zones of buildings. The two standards have adopted the PMV-PPD model (Predicted Mean Vote-Predicted Percentage of Dissatisfied) and the DR index (Draft Rate), proposed by Fanger [21, 22]. The PMV index was originally developed for human subjects in homogenous thermal environmental conditions and the corresponding PPD is the percentage of people dissatisfied by the thermal environment. According to Fanger [21] and Awbi [23], for a uniform thermal environment, a single value of PMV-PPD indices is sufficient to express the thermal discomfort in the occupied zone. For non-uniform thermal environment, the authors proposed that measurements should be carried out at various points in the occupied zone and these are then used to calculate the distribution of PPD indices throughout the zone [23]. Although there is a dispute regarding the use of PMV-PPD model in non-uniform environmental conditions, this model was considered in such conditions in several studies, among them those of Wan and Chao [24] and Arghand et al. [25]. It is used by the authors for both global and local evaluations of thermal comfort generated by ventilation systems.
The DR index is a local discomfort model which characterizes draft effect on the neck of an occupant. It can be extended to other body regions [23]. Nastase et al. [7], Chow and Wong [26], and Tomasi et al. [27] have used this index to study experimentally the thermal comfort generated by mixing ventilation diffusers.
This study presents an experimental evaluation of the air distribution patterns and of the thermal comfort level generated inside a climate chamber in hating mode, by a vertical jet issued from a conventional ceiling flush-mounted multi-cone diffuser. The climate chamber was used to
simulate winter conditions under steady state thermal conditions. The impact on jet behavior and the resulting thermal comfort due to lobed inserts [28] used as induction promoters into the multi-cone diffuser were evaluated. Compared to the “built-in lobed diffuser” of Nastase et al. [7], the proposed concept of lobed inserts [28] allows an easier integration of jet passive control into commercial diffusers’ manufacturing process without major changes into the whole production. The flow patterns were obtained via the in plane velocity distributions from large-scale 2D PIV technique. As in [24, 25], Fanger’s PMV-PPD model was used to evaluate the global thermal comfort, whereas the DR index is used to estimate the discomfort due to draft effect.
2. EXPERIMENTAL APPARATUS
2.1. Test chamber and air handling circuit
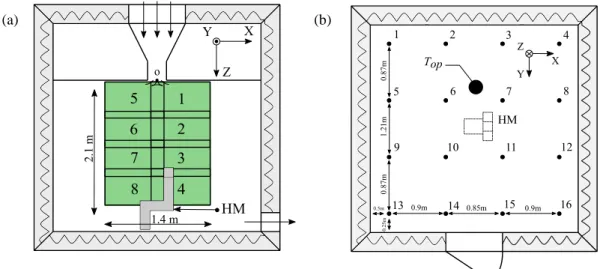
The experiments were carried out in a full scale model room, coupled to an air diffusion circuit including an air handling unit (Fig. 1a). The chamber is a cube of side 3470 mm. The six inside faces are black painted and thermally controlled, using a hydraulic circuit composed of capillary tubes inserted in the walls and connected to a reversible heat pump. To simulate a standard occupied volume inside of a residential or an office building, a dropped ceiling was installed at height 2500 mm to reduce the test zone. In the test chamber, the air temperature (Ta) measured
at the air extraction is controlled via the hydraulic circuit integrated in the walls. The air extraction is positioned at the bottom of the test chamber (see Fig. 1a). The ventilating jet was generated by the air handling unit equipped with a fan, a heater and a chiller, followed by a plenum box. The diffuser is installed at the extremity of the plenum box. The initial flow rate (Q0) and the air temperature (T0) of the jet were controlled with sensors placed between the
handling unit and the plenum box, and again measured at the jet exit using a balometer from ACIN (Flowfinder mk2). The accuracy in flow rate measurement was ±3% of the reading. Exit velocity profile from mixing ventilation diffusers depends greatly on the velocity distribution upstream of the jet exit, hence, it is depending on the velocity distribution in the upstream neck before the airflow enters the diffuser. As the aim of the present study is to investigate the effect of inserted lobes into a flush-mounted ceiling multi-cone diffuser, on the jet dynamics and the resulting thermal comfort in the occupied zone, the neck mean velocity profile should be as uniform as possible, with low turbulence intensity, and the upstream flow perturbations from the air-distribution circuit should be minimized. This is explained by modifications in the dynamics of the jet flow by the lobed inserts with the aim to achieve a higher induction. Hence, for a clear analysis of the flow’s behaviour, it is necessary to isolate and decouple the effect of the lobes from any intrusive perturbation effect which could come
from the air-distribution circuit. Uniformity and symmetry of the flow entering the diffuser depend, among other factors, on the connecting conditions of the diffuser to the air-distribution circuit. Smoljen and Balen [29] showed that a plenum box with a side entry perpendicular to the diffuser axis, creates a very asymmetric inlet velocity profile. A perforated plate installed in the plenum box and inclined at 45° relative to the mean flow axis in the plenum, does not supply uniform inlet velocity profile.
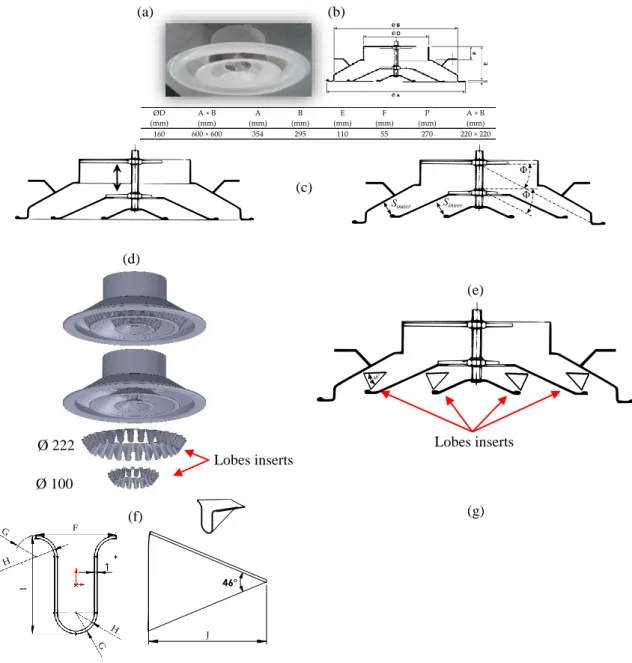
In the present study, after the air handling unit, and before entering the test zone through the diffuser, the air passes through a plenum box including a divergent followed by a short duct equipped with a perforated plate normal to the duct, a convergent, and again a short duct equipped with a honeycomb (Fig. 1, a and b). With this particular installation, the round jet generated through the neck of the plenum box without the diffuser has been characterized in isothermal conditions. Near the neck exit, at Z/D= 0.25 (Fig. 1, b), the mean radial velocity profiles (Fig. 1, c) measured on two normal axis are similar and almost flat in the region of the jet core. The turbulent intensity profile (Fig. 1, d) is flat at about 2% in the central region. The presence of high turbulence values, at around 12%, next to the peripheral region of the flow, is due to the shear layer of the jet. As expected, the turbulent intensity is quite high in regions where the local shear in the mean radial velocity is large. This way we ensured that the flow through the neck was uniform, axisymmetric a priori, and very weakly turbulent. This subsequently allowed us to characterize the jets from the diffusers without upstream disturbances that could alter their diagnostic, especially in the presence of lobed inserts. A three-cone circular ceiling-mount diffuser (Fig.2, a-c) has been chosen to be tested in the full scale model room (Fig. 1, a). This diffuser is of typical manufacture and has adjustable cones for changing the air diffusion pattern within the test room. The two inner cones may be adjusted manually with a screw (Fig.2, c) to switch from vertical jet behavior (recommended in heating mode) to radial jet behavior (recommended in cooling mode). The present study was conducted in heating mode, hence, the diffuser was set as shown in Fig.2, c (right) to generate a downward vertical flow. The diffuser described in Fig. 2, a-b, having three cones of constant angle = 33°, is designated by “conventional diffuser” (CD). When equipped by lobed insets as shown in Fig. 2, d-e, the diffuser is designated by “lobed diffuser” (LD).
The geometric parameters of the lobes are given in Fig.2, f-g. They were made of resin material and were built by a 3D printer. They are 1 mm in thickness (Fig. 2 f), and have an undulated trailing edge of 1164 mm and 2204 mm in length, for the inner insert and the outer insert, respectively, leading to an obstruction ratio of about 14 % of diffuser effective area Aeff,
to the sum of areas of inner and outer slots at the location of lobes inserts, of thickness S (Sinner
31 mm; Souter20 mm) and perimeter p, which is equal to lobe insert perimeter (pinner=100
mm, pouter=222 mm, see Fig. 2, d).
It is to be noted that the Aeff of the considered conventional multi-cone diffuser (Fig. 2, a and b)
is not provided by the manufacturer, and could vary with the setting of the cones (Fig. 2, c) and with the point where one defines the diffuser’s outlet (see the notches at the trailing edges of the cones in Fig. 2, e, leading to shrinking of the thickness outlet). This fact explains in the present study the choice of the neck-area An (An = D²/4 = 0.021 m², where D = 160 mm is the
neck-diameter upstream the diffuser), as a reference parameter, like this has been done in [4] for ceiling diffusers similar to our diffuser. It is interesting to note that the value of An is very
close to the estimated value of Aeff. The corresponding neck velocity Wn= Q0 /An, will be used
as reference velocity.
2.2. Heated manikin
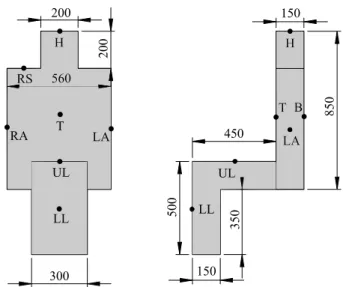
A rectangular-shaped seated manikin [30] of 8 heated parts (Fig. 3), was used to simulate an occupant located at the center of the climate chamber (Fig. 4). The core structure of the manikin is composed of polystyrene. The surface of each part is covered with a heating film connected to an electric dimmer to adjust the thermal power. The power supplied to each part is given in Table 1. The total power corresponds to a mean skin temperature of 32 °C in a room with still air and an operative temperature of 26 °C. This is consistent with sedentary activity of a seated occupant [30].
The work presented in [31] focuses on the influence of manikin geometry on the global and local airflow around a manikin located in mixing ventilated surroundings. A series of full-scale experiments with four different thermal manikins, from a simple rectangular-shaped manikin to a humanlike breathing thermal manikin, were performed. The authors concluded that when one interested in global flow conditions, a thermal manikin with a simple geometry can prove sufficient. Global flow conditions are evaluated when interested in the overall airflow pattern in a ventilated room. When one interested in local conditions, a more detailed geometry would be necessary to evaluate thermal and atmospheric comfort close to the occupant. As our study deals with global air pattern in the occupied zone, the considered manikin geometry would be satisfying.
Airflows generated by air diffusion devices in building scale indoor spaces are usually complex and difficult to characterize. The most common pointwise measurement techniques are time consuming and cannot capture details of the flow dynamics at large scales. According to the review of Cao et al. [32], with current advanced laser and camera technologies, Particle Image Velocimetry (PIV) becomes an ideal measurement tool to investigate the airflow pattern in indoor spaces.
PIV is a non-intrusive laser optical measurement technique for flow diagnostics. The 2D2C PIV technique considered in the present study uses a pulsed laser sheet, a digital camera synchronized with the laser, and olive oil seeding particles as tracer. The position of the fluid is imaged through the laser light scattered by the tracer particles considered to be sufficiently small and light to move with local flow velocity. Measurement of instantaneous velocity field is achieved by taking two images, the second shortly after the first, and calculating the distance travelled by the tracer particles in the fluid within time interval between the two images. In this study, the velocity field was investigated using a Dantec Dynamics PIV system having an acquisition rate of 2 Hz. It is composed of a Dantec HiSense 11M CCD camera with a sensor of 4000×2672 pixels equipped with a Nikkor 50 mm lens, and of a dual-cavity 200 mJ laser having a wavelength of 532 nm. The airflow was seeded with olive oil droplets generated by a laskin nozzle generator. This experiment aimed a global investigation of the flow in the half middle cross section (1900×2100 mm) of the room (in green color in Fig. 4, a), resulting from the jet and its interaction with the heated manikin. To construct the whole field, 8 PIV regions, each having 1000×670 mm in size were assembled. For each PIV region, 600 image pairs were acquired and processed through an adaptive multi-grid correlation algorithm handling the sub-pixel window displacement. The final size of the interrogation window was 64×64 sub-pixels, with an overlap of 50%. The resulting vector spacing is 8.4×8.4 mm.
As for any measurement system, the accuracy of PIV measurements could be influenced by many parameters. Most of the error sources have been discussed by Raffel et al. [33]. It consists mainly in systematic errors, due among them to correlation method, background noise, seeding density and particles size. According to Sandberg [34], in ventilated rooms the velocity is low and the relative systematic errors for a 2D PIV measurement could be estimated to be on the order of 1 to 2%. The contribution of insufficient particle size to this error could be higher for large scale PIV measurements using oil droplets. In this case, the particle diameter is less than one pixel, which leads to the peak locking effect because particles displacement tends to be biased towards integer pixel value. In this study this effect was systematically checked by computing displacement histograms. No peak locking effect was detected in the histograms due
to high accuracy sub-pixels interpolation algorithm. An example of the obtained displacement histograms is given in Fig. 5 for the measurement window 3 (Fig. 4).
Another source of error is the statistical error, mainly due to the random sampling. Cao et al. [35] used the central limit theorem to estimate the random sampling error of the time-averaged velocity, resulting in an absolute velocity error calculated as follows:
U U z N u rms r 2 1 (1)
Where N is the number of samples (here N = 600), z the confidence level, Urms the local
turbulence level and U the local velocity. For our experiments, with a local velocity varying from 0.02 to 3.8 m/s, and a confidence level of 0.95, the random sampling error was ranging from 2.7 to 4.0 mm/s, which corresponds to a relative velocity error ranging from 14% for the lower velocity to 1% for the higher velocity.
2.4. Thermal comfort measurements
According to Fanger [21] and Awbi [23], for a uniform thermal environment, a single value of PMV-PPD indices is sufficient to express the thermal discomfort in the occupied zone. For non-uniform thermal environment, the authors proposed that measurements should be carried out at various points in the occupied zone and these are then used to calculate the distribution of PMV-PPD indices throughout the zone [23]. In this study, thermal comfort was investigated using the method proposed by Fanger [21] for non-uniform environments. Environmental parameters such as, local air temperature (Tair) and local air speed (Vair) were measured using thermocouples
(type K, accuracy of ±0.3 °C) and hot-sphere anemometers (TSI 8475, accuracy of ±3 % of the reading). The occupied zone was meshed in 16 vertical canes (Fig. 4, b), each including 4 heights from the floor at 0.1 m, 0.6 m, 1.2 m and 1.8 m. These positions correspond to the levels of ankles, waist, and head of a seated occupant and respectively to the head of a standing occupant [20]. The interior surface temperatures (Tp) of walls, floor and ceiling were also
measured. Each surface was divided into 4 subzones of equal dimensions, each equipped with one thermocouple located at its center. Fig. 6 gives the values of (Tp) for both diffusers (CD
and LD) and both inlet flow rates (Q0=200 m3/h and Q0=275 m3/h) considered in this study (see
§ 2.6). In Fig. 6, each wall refers to a cardinal point; the reference wall with the door is the south wall. As it could be seen in this figure, each surface had almost uniform temperature with a maximum difference of 1°C between the corresponding 4 subzones. The mean radiant temperature (Tr ) was obtained using the method described in ISO 7730 [19] and ASHRAE
Standard 55 [20], based on surface temperatures of the 6 faces and a seated manikin with unknown azimuthal angle. A black globe thermometer of 150 mm in diameter, equipped with a PT100 probe (of accuracy of ±0.3 °C), is used to acquire the operative temperature (Top) at
the point located at 1.25 m above the ground (see Fig. 4, b), centered in X direction, and offbeat at 1000 mm from the center in Y direction due to the presence of the manikin (Fig. 4). After a duration of about 6 hours necessary to achieve steady state conditions, thermal comfort experiments were carried out in an interval of 8 hours with a sampling time of 1 minute. Calculations of thermal comfort indices were performed with a home-made software and the obtained PMV-PPD values were verified using the ASHRAE 55 Comfort tool [20].
2.5. Static pressure and acoustic sound pressure level measurements
The total pressure loss was measured according to EN 12238 standard [36] using a KIMO MP110 micro-manometer. One pressure tap was installed at 1.5 D upstream the diffuser (D is the neck-diameter) and the second in the occupied zone outside the jet region (i.e., 1 m horizontally from the diffuser and 1.25 m vertically from the floor).
The sound pressure levels were recorded with and without the diffusers using a handheld type 2250 Sound Level Meter of Class 1 Precision from Bruel & Kjaer. According to ISO 10052 [37], a diffuser is considered as a technical equipment, for which time average equivalent sound pressure level with A-weighting, Leq (dBA), must be measured. Measurements were performed
as recommended in [37] at two locations P1 and P2 (see Fig.1, a), during an interval of 6 s, as specified in [38]. The locations are corresponding respectively to the nearest position to the diffuser located in the occupied zone of the room, and the limit of the occupied zone in the case when the destination of the room deals with people being seated.
2.6. Tested configurations
The present study was conducted in heating mode using a hot jet generated vertically by a three-cone ceiling mounted diffuser in its conventional form (CD), and in an enhanced mixing form (LD) using lobed inserts [28]. The multi-cone diffuser considered (Fig.2, a-c) is recommended for flow rate ranging from 200 to 400 m3/h. The air handling unit equipped with its plenum box
(Fig. 1 a-b) and the multi-cone diffuser (Fig. 2), provides flow rates in the range of 15 to 300 m3/h. Hence, in this study the volumetric flow-rate was set at Q
0 =200 m3/h and Q0 =275 m3/h,
respectively. The operating conditions for the considered cases are summarized in Table 2, including the jet Reynolds number, Re Wn An / and the jet Archimedes number
2 0 a / a n
n T T TW
A g
Ar , where is the cinematic viscosity of the air, g the gravitational
acceleration, T0 the supply air temperature, Ta the ambient air temperature (measured at the
extraction of the chamber), An the neck area, and Wn is the neck air velocity.
The heating load Qt CpQ0T Sf , where is the air density, Cp the air specific heat and
Sf is the floor surface, is also given in Table 2. It is defined as the density of thermal energy to
be bring in the room, to maintain the desired comfort conditions.
According to ISO 7730 standard [19] and to the ASHRAE 55 standard [20], for an individual office with one occupant having a sedentary activity, the recommended value of operative temperature (Top) for optimal thermal comfort in winter conditions is 22 °C. The obtained values
(Table 2) are close to the recommended value.
PIV measurements were conducted for Q0 = 200 m3/h considering respectively, the
conventional diffuser CD and the innovative lobed diffuser LD with the presence of the manikin. To analyze induction performance of the diffusers in a reference cases, the same experiments were conducted in same conditions, but without the presence of the manikin.
3. RESULTS AND DISCUSSION
3.1. Airflow pattern analysis
The reconstructed mean velocity fields obtained as described before (Fig. 4, a) are given in Fig. 7, a1 and b1, using isocolors and streamlines representations. The PIV measurements were performed for Q0 = 200 m3/h (Table 2). The global airflow pattern in the room for the two
diffusers was found to be almost identical. There is an important interaction between the vertical jet and the thermal manikin (Fig. 7, a1 and b1). The “shower” effect of the jet on the manikin’s surface generates two stagnation points, one on the head and another on the lap. The air speed around the manikin, reaches a maximum value of 1.5 m/s for Q0 = 200 m3/h, and sure more for
Q0 = 275 m3/h, which could be a source of discomfort. For comparison, the maximum value of
0.25 m/s is recommended for the air speed in the occupied zone [20]. Without the manikin in the test room, (cases not shown for brevity), the jet reaches the floor and folds back toward the ceiling, as described before in [3].
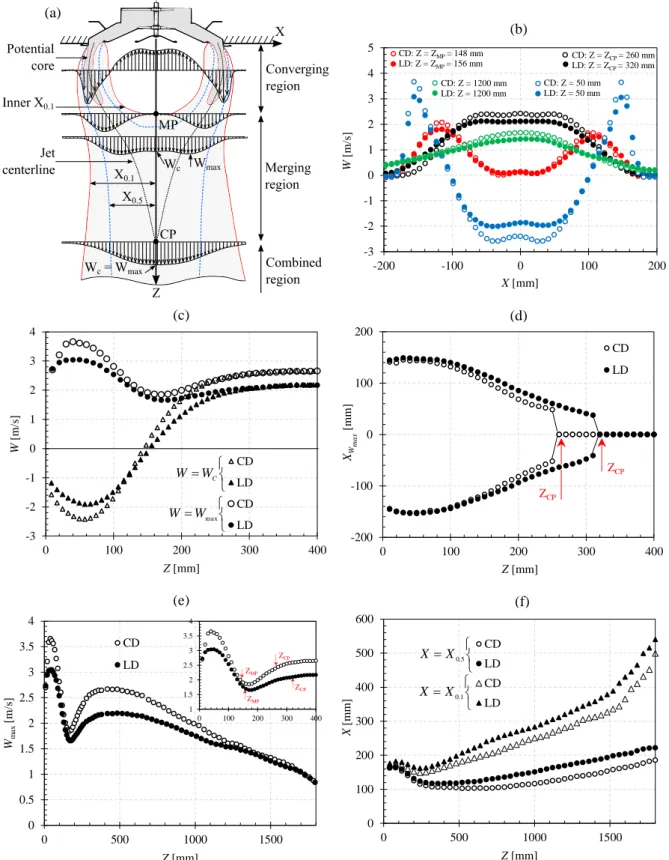
As the jet is annular at the exit, a vacuum in the void space below the central part of the diffuser appears (Fig. 7, a2 and b2). This behavior has been qualitatively described by Becher [1] and Koestel [2], and has been related to the geometry of the multi-cone diffuser. We want to conduct herein a quantitative analysis of this phenomenon. Due to the vacuum, the annular jet converges
vertically towards its central axis, merges at a distance ZMP, and becomes a replete round jet
after a certain distance ZCP downstream of the diffuser (Fig. 7 and Fig. 8, a). This behavior is
somewhat similar of that of twin jets [39-41]. The merging point MP is defined as the point on the central axis X= 0, where the centerline velocity WC = 0 (Fig. 8, a-c). The axial location of
the point MP as a function of the diffuser outer diameter B (see Fig.2 b), is found to be equal to 0.50B and 0.53B for CD and LD, respectively. The obtained values are very close to the values of 0.50B and 0.52B obtained in the literature [42, 43] for academic annular jets. Upstream MP, WC is negative due to the presence of the central vacuum (Fig. 8, c). Downstream
MP, WC becomes positive and increases gradually. The velocity profile (Fig. 8, b) has an
M-shape from the outlet till the combined point CP. Beginning with this point, the jet behaves as a circular jet, with maximum velocity Wmax positioned on the central axis X=0 (Fig. 8, a-c).
Fig. 8, d gives the positions XWmax of the maximum axial velocity Wmax. It is interesting to note
that with lobed inserts, the coalescence is extended by 23% in terms of ZCP. This is due to the
reduction of depression effect visible in Fig. 8, c, following the high induction generated by the lobes. Whereas Wmax near the jet exit, at Z= 8.2 mm = 0.05D, has a same value (i.e. 2.73 m/s)
for CD and LD, respectively (Fig. 8, c), Wmax in LD becomes further downstream lower than
that in CD (Fig. 8, c and e), till about Z=1400 mm (Fig. Fig. 8, e), where the two jets display similar values. This effect was already observed in both fundamental work [9] and HVAC related work [7] of lobed jets. Despite the strong induction of the lobed jet, its throw is not lower than the one of conventional reference jet. Immediately after the combined point CP, it could be observed before the start of the decrease of Wmax, a plateau (Fig. 8, c and e) which
resembles a potential core of a classical jet.
The jet widths X0.5 and X0.1 (Fig. 8, f) are defined as the radial distances from the jet axis where
the axial velocity W in the external mixing layer equals 50% and 10%, respectively, of its maximum value Wmax. After the combined point ZCP, the larger jet widths for LD relative to CD
confirm the higher ambient air entrainment in the former than in the later. Their axial evolutions are linear with a constant slope for X0.5, and a double slot for X0.1. The second slope of X0.1
appears at about Z=1500, i.e., 400 mm before the jet reaches the lap of the manikin (Fig. 7, a1 and b1). This increase in jet expansion is due to reaction forces in the impinging region. The impact of the jet on the manikin makes difficult the comparison of our data to the literature. That is why we have made reference tests under the same conditions as before (i.e., cases Q0=
In the combined region, i.e. Z/√An ≥ 8), the mean flow becomes fully developed and the global
features of the jet are similar to those of the round jet. The self-similar state in this region was confirmed by the linear growth of the jet half velocity width X0.5 in the reference tests without
mannequin (Fig. 9, a). Fitting the data in the far flow region (Z/√An ≥ 8) by a linear regression,
the linear spread rate (C) corresponding to Eq. 2 is estimated:
x n n b A Z C A X 0.5 (2)
Where bx is the geometric virtual origin.
The obtained values of C are 0.091 and 0.108 for CD and LD, respectively, and are in accordance with literature values for annular jets [44].
The decrease in the axial velocity of the jet in the same region could be modeled by the following equation: w n w c n b A Z K W W (3)
Where bw is the kinematic virtual origin and Kw is the axial velocity law coefficient.
Fig. 9 b gives the best curve fit of normalized centerline velocity in the region Z/√An ≥ 8. The
values of Kw are 0.16 and 0.20 for CD and LD, respectively.Similar values are obtained by
Kuhlman [44] for different configurations of annular jetsin the case of subsonic jets (Mach = 0.4).
The fact that C and Kw values for LD are larger than those of CD, confirms the higher mixing
performance of the former than the later.
To emphasis the fully developed state of the flows in the combined region of the reference cases without manikin, the axial velocity profiles are extracted in three different axial locations and plotted against the transverse coordinate normalized by the jet half velocity width X0.5 (Fig. 9 c
and d). The self-similarity relation proposed by Tuve [45] for axisymmetric round jet and given
2 5 . 0 3 . 3 10 ln exp X X W W c (4)
As can be seen on Fig. 9 c and d, velocity profiles of both jets are in a good agreement with the similarity law of Tuve [45]. In the self-similar region, the axial evolution of the volumetric flow rate can be estimated by the following equation:
0 . . 2 ) (Z W X dX Q (5)Where Q( Z) is the volumetric flow rate at the axial position Z.
By integrating Eq. 5 using Eq. 3 and Eq. 4, the normalized volumetric flow rate can be expressed as in [44]: n w A Z C K Q Z Q 10 ln 3 . 3 4 ) ( 2 0 (6)
Where Q0 is the initial volume flow rate at the diffuser’s neck. The actual entrainment rate of
the jet in the corresponding region is then equal to4 3.3 ln10 2
C Kw
. Using values of C and Kw
obtained in the present study (see Fig. 9 a and b), the entrainment rate is equal to 0.294 for CD and 0.337 for LD. The obtained values compare favorably with the available literature data for round axisymmetric jets [46, 47] and are in good agreement with those obtained by Kulhman [44] for annular jets. The entrainment rate is about 14 % higher for the LD compared to the CD. This can be related to the higher induction generated by the lobed inserts. It is to be noted that annular jets are recognized to have greater entrainment rate than circular round jets [44]. This fact explains their wide use in combustion and aeronautic, as well as in mixing ventilation. The above results demonstrates that the use of lobed inserts further improve the entrainment rate of the annular jet.
3.2. Thermal comfort analysis
Thermal comfort and draft rate were analyzed through Fanger’s PMV-PPD and DR models computed on 64 nodes of the occupied zone (see Fig. 4, b). For DR index, the turbulence intensity is not accessible from the hot-sphere anemometer. ISO 7730 standard [19] recommends a value of 40% in this case. A maximum difference of 0.1% in DR distributions is recorded, using respectively this recommended value and turbulence intensity (ranging from
9 to 12 %) measured by PIV in the occupied zone (Fig. 4, a). Hence, the recommended value of 40 % has been adopted in all the cases.
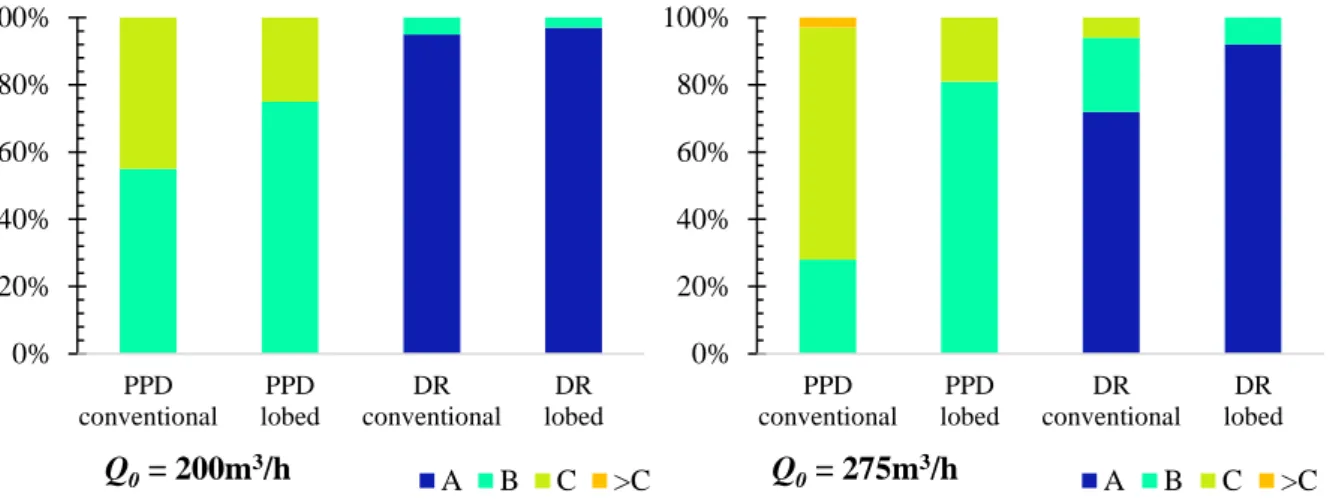
According to the standards [19, 20], subjective parameters for PMV-PPD model as metabolic rate, mechanical work and clothing insulation were fixed at 1.2 met, 0 W/m² and 1 clo, respectively, corresponding to a seated occupant with winter clothing having a sedentary activity. Fig. 10 and Table 3 provide the statistic distribution of the 64 nodes in terms of PPD and DR levels (A, B, C) for the two flow rates considered (Table 2). The results reveal clearly the advantage of the lobed inserts: the higher thermal comfort obtained according to PPD and the lower local thermal discomfort environment according to DR were achieved with the LD. For Q0 = 200 m3/h, in terms of the PPD index, 55% of the data falls in the category B and 45%
in the category C for CD. For LD, 75% falls in the category B and only 25% falls in the category C. In terms of the DR index, surprisingly almost all the points fall in the category A for the two diffusers (95% for CD and 97% for LD). It is to be noted that these results could be an indication of the comfort level in the occupied zone outside the jet region. In the region of the interaction between the jet and the manikin, local discomforts are probably important.
For Q0 = 275 m3/h, the indices show a slight degradation of the thermal comfort compared to
Q0 = 200 m3/h. However, the LD performance relative to the reference CD is more significant
in this case. In terms of DR index, 92% of data falls in the category A for LD compared to 72% for CD. The improvement is more significant in terms of PPD index, with 81%, 19% and 0% of data falling in the category B, C, and > C for LD, compared to 28%, 69% and 3% for CD. The higher thermal comfort obtained with the LD results from its ability to generate higher mixing with ambient air, as revealed previously by jet flow analysis (see § 3.1).
Global values of comfort indices are given in Table 5. Two methods were considered to achieve these values. The arithmetic average of the indices obtained in the 64 nodes of the occupied zone is performed and is compared to values obtained using ASHRAE 55-2010 comfort tool (ACT) using inlet data given in Table 4, where Vair and Tair are respectively the mean air
velocity and the mean air temperature of the 64 nodes values. As it could be seen in Table 5, the two methods provide similar values. It is interesting to note that the temperature Tair (Table
4) is close to Ta (Table 2), the temperature at the extraction point of the chamber (Fig. 1 a), with
a maximum difference of 1.4 °C.
For both volumetric flow rates considered, the global analysis of thermal comfort virtually erase the benefits previously observed in the LD case (Fig. 10). Both diffusers provide conditions
which are complying with the ASHRAE 55 standard [20]. In terms of ISO 7730 standard [19], both CD and LD allow to reach the category B for Q0 = 200 m3/h. For Q0 = 275 m3/h, LD allows
to reach the category B, whereas the lower category C is achieved with CD.
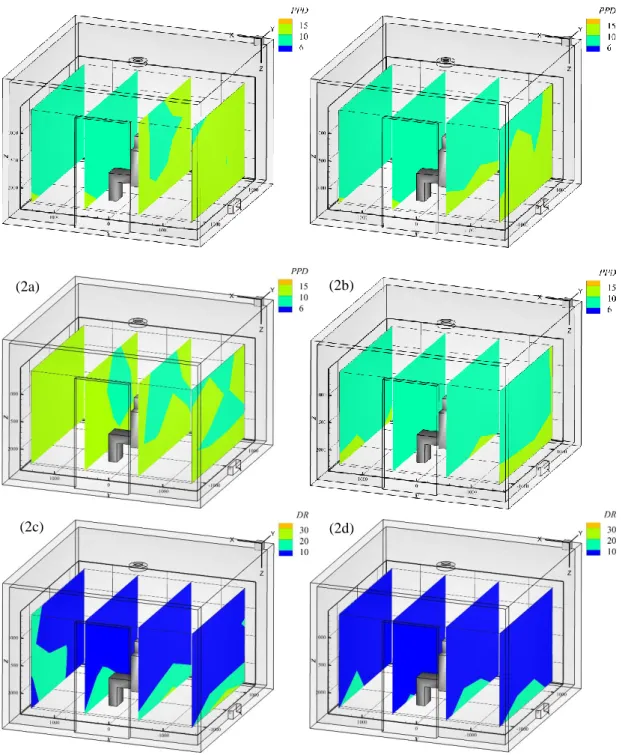
In Fig. 11 are displayed the distributions of PPD and DR indices in the occupied zone. As for Q0 = 200 m3/h almost all points fall in the category A in terms of DR index, the corresponding
distributions were not included in this figure. The distributions are organized in 4 vertical planes parallel to YZ plane (Fig. 4, b), each corresponding to an interpolation of data in 16 measurement points.
In terms of DR index, discomfort regions seem to be correlated with high velocities at the vicinity of the floor, due to jet impingement on the latter. These regions are less widespread for LD than that for CD (see Fig. 11, 2c, 2d, and Fig. 12, 1a, 1b, 2a, 2b).
For the PPD index, it is difficult to know a priori from Fig. 11 and Fig. 12, if uncomfortable regions are due to uncomfortable air temperatures, uncomfortable air velocities, or both in the same time. Anyway, thermal comfort in terms of PPD index is improved with lobed inserts, and this improvement is more significant for the higher volumetric flow rate.
3.3. Acoustic and pressure loss data analysis
The impact of the lobed inserts, on the pressure drop and on the sound pressure level were evaluated.
In Fig. 13 are given total pressure losses for the CD and the LD, measured following EN 12238 standard [36], as a function of the inlet volumetric flow rate Q0 in the range 100 to 275 m3/h.
As it could be observed from this figure, the two diffusers display similar values of the pressure losses, with differences around 3 Pa, which are very close to the accuracy of the pressure sensor (±2 Pa).
In Fig. 14, a and b, are given for the two acoustic measurement positions (positions P1 and P2, see Fig. 1, a, and paragraph § 2.5), global sound pressure levels in the test chamber as a function of the initial volumetric flow rate Q0.
These global sound pressure levels reflect in the same time both the possible noise generation of the diffusers and of the air handling unit and air diffusion ducts. The air diffusion system is equipped with a plenum box (Fig. 1, b) on which the diffuser is mounted. Three cases were considered. In the first one the measurements were performed without any diffuser mounted on the plenum. The other two cases correspond to the functioning of the system with the
conventional diffuser CD and with the lobed diffuser LD, respectively. The measurements were taken for the two positions P1 and P2.
On the proximity of the diffuser (position P2) it could be observed from Fig. 14, b that for the lowest initial volumetric flow rates less than 175 m3/h, the global sound pressure displays higher levels in the case without diffuser. This means that for small values of volumetric flow rates both diffusers are playing a part in the attenuation of the noise generated by the air distribution ducts and the air handling unit. This also means that in this case, the contribution of the diffusers themselves on the global noise generation cannot be extracted directly.
For larger values of initial flow rate (Q0175 m3/h), the sound pressure levels of the diffusers
themselves were extracted (Fig. 14, c). As recommended by ISO 10052 standard [37], mean values of pressure levels were calculated as representative values of the global noise generated in the occupied zone (Fig. 14, d). The mean value is an average weighted by the coefficients 2/3 and 1/3 of sound pressure levels in P1 and P2, respectively. This figure does not show a significant difference between the two diffusers in terms of noise generation.
The above results in terms of pressure losses and of sound pressure levels are grouped in a single figure as a function of the volumetric flow rate, for the CD (Fig. 15, a) and the LD (Fig. 15, b), respectively. The sound pressure levels with each diffuser are acceptable for office spaces, according to national regulations and building codes of many European countries [48].
CONCLUSION
In this study, jet characteristics, indoor airflow pattern, and thermal comfort were analyzed in a full-scale model room in mixing ventilation and heating mode. The presence of an occupant has been simulated using a simplified heated manikin, positioned at the center of the room. The hot jet is generated from a multi-cone diffuser (CD), flush-mounted in the center of the ceiling and operating in vertical jet generation. The effect of inserted lobes into the diffuser being LD, has been evaluated.
As the jet is annular at the exit, a vacuum in the void space below the central part of the diffuser appears. The vacuum is much stronger in the jet from the CD than that in the jet from the LD. The depression is lower in LD due to the lobed inserts which are generating a large ambient air induction and a fast diffusion of jet momentum at the vicinity of the diffuser outlet. The annular jet converges vertically towards its central axis, merge and then combine in a single jet after a certain distance downstream of the diffuser. As a consequence of depression reduction in LD, its coalescence length is extended by 23% relative to that in CD.
The higher entrainment of ambient air in the jet from LD produces a larger jet expansion and a faster decrease of its velocity, involving an increase by about 14% of the entrainment rate in its far field region relative the jet from CD.
Thermal comfort analysis based on both ASHRAE 55 and ISO 7730 standards, reveals significant improvement of thermal comfort indices in the presence of lobed inserts into the diffuser. This is achieved without significant increase in pressure drop and noise.
Beyond the performance ensured by of lobed inserts, the concept is easy to integrate in manufacturing chain relatively to the built-in lobed diffuser. For all these reasons, this concept represents a promising low-cost solution to enhance the performance of HVAC systems.
ACKNOWLEDGEMENT
This work was supported by the grants of the French National Research Agency (ANR) as part of the FLUBAT- ANR-12-VBDU-0010 project.
REFERENCES
[1] Becher, P., Air distribution in ventilated rooms, in Heating and air-technical Conference. 1966, JIHVE: Budapest. p. 219-227.
[2] Koestel, A., Jet velocities from radial flow outlets, in Semi-annual Meeting of ASHACE, ASHRAE, Editor. 1957: Murray Bay Canada.
[3] ASHRAE, Space air diffusion, in ASHRAE Handbook: Fundamentals, ASHRAE, Editor. 2009.
[4] Chuah, Y.K., Hu, S.C., and Barber, J.M., Airflow Characteristics of Circular Ceiling Diffusers. International Journal on Architectural Science, 2000. 1: p. 59-67.
[5] Shakerin, S. and Miller, P.L. Experimental study of Vortex Diffusers. in 1996 Annual Conference. 1996. San Antonio, TX.
[6] Meslem, A., Nastase, I., and Allard, F., Passive mixing control for innovative air diffusion terminal devices for buildings. Building and Environment, 2010. 45: p. 2679-2688.
[7] Nastase, I., Meslem, A., Vlad, I., and Colda, I., Lobed grilles for high mixing ventilation – An experimental analysis in a full scale model room. Building and Environment, 2011.
46(3): p. 547-555.
[8] Nastase, I., Meslem, A., and Gervais, P., Primary and secondary vortical structures contribution in the entrainement of low Reynolds number jet flows. Experiments in Fluids, 2008. 44(6): p. 1027-1033.
[9] Nastase, I. and Meslem, A., Vortex dynamics and mass entrainment in turbulent lobed jets with and without lobe deflection angles. Experiments in Fluids, 2010. 48(4): p. 693-714.
[10] El Hassan, M. and Meslem, A., Time-resolved stereoscopic particle image velocimetry investigation of the entrainment in the near field of circular and daisy-shaped orifice jets. Physics of Fluids, 2010. 22(3): p. 035107.
[11] El Hassan, M., Meslem, A., and Abed-Meraim, K., Experimental investigation of the flow in the near-field of a cross-shaped orifice jet. Physics of Fluids, 2011. 23(4): p. 045101.
[12] Meslem, A., El-Hassan, M., and Nastase, I., Analysis of jet entrainment mechanism in the transitional regime by time-resolved PIV. Journal of Visualization, 2011. 14(1): p. 41-52.
[13] Mitchell, M., Smith, L., Karagozian, A., and Smith, O., Emissions measurements from a lobed fuel injector/burner, in 36th AIAA Aerospace Sciences Meeting and Exhibit. 1998, American Institute of Aeronautics and Astronautics.
[14] Mitchell, M.G., Smith, O.I., and Karagozian, A.R., Passive Fuel-Air Mixing and Emissions Control Via Lobed Injectors. AIAA Journal, 2004. 42(1): p. 61-69.
[15] Hunter, C., Presz, W., and Reynolds, G., Thrust augmentation with mixer/ejector systems, in 40th AIAA Aerospace Sciences Meeting & Exhibit. 2002, American Institute of Aeronautics and Astronautics.
[16] Shan, Y., Zhang, J.-z., and Huang, G.-p., Experimental and Numerical Studies on Lobed Ejector Exhaust System for Micro Turbojet Engine. Engineering Applications of Computational Fluid Mechanics, 2011. 5(1): p. 141-148.
[17] lieber, L.S. and Weir, D.S. Comparison of measured low-frequency engine noise with combustion and jet noise predictions for a turbofan engine with an internal lobed mixer nozzle. in ASME Turbo Expo 2007: Power for Land, Sea, and Air. 2007.
[18] Zhang, J., Pan, C., and Shan, Y., Progress in helicopter infrared signature suppression. Chinese Journal of Aeronautics, 2014. 27(2): p. 189-199.
[19] ISO, Ergonomics of the thermal environment -- Analytical determination and interpretation of thermal comfort using calculation of the PMV and PPD indices and local thermal comfort criteria, in ISO 7730. 2005.
[20] ANSI/ASHRAE, Thermal environmental conditions for human occupancy, in Standard 55-2013. 2013.
[21] Fanger, P.O., Thermal Comfort, Analysis and Applications in Environmental Engineering. 1970: Mc Graw Hill Book Company.
[22] Fanger, P.O., Melikov, A.K., Hanzawa, H., and Ring, J., Air turbulence and sensation of draught. Energy and Buildings, 1988. 12(1): p. 21-39.
[23] Awbi, H.B., Ventilation of Buildings. Second edition ed. 2003, London, U.K.: SPON. 522.
[24] Wan, M.P. and Chao, C.Y., Experimental Study of Thermal Comfort in an Office Environment with an Underfloor Ventilation System. Indoor and Built Environment, 2002. 11(5): p. 250-265.
[25] Arghand, T., Karimipanah, T., Awbi, H.B., Cehlin, M., Larsson, U., and Linden, E., An experimental investigation of the flow and comfort parameters for under-floor, confluent jets and mixing ventilation systems in an open-plan office. Building and Environment, 2015. 92: p. 48-60.
[26] Chow, W.K. and Wong, L.T., Experimental studies on air diffusion of a linear diffuser and associated thermal comfort indices in an air-conditioned space. Building and Environment, 1994. 29(4): p. 523-530.
[27] Tomasi, R., Krajčík, M., Simone, A., and Olesen, B.W., Experimental evaluation of air distribution in mechanically ventilated residential rooms: Thermal comfort and ventilation effectiveness. Energy and Buildings, 2013. 60: p. 28-37.
[28] Vialle, P.J., Leroy, E., and Meslem, A., Diffusion device with lobe inserts and fan coil comprising such a device, in European Patent Office. EP2933575. October 2015. [29] Smoljan, D. and Balen, I., Experimental study of a vortex diffuser with a side entry
plenum box. Transactions of FAMENA, 2009. 33(4, p1).
[30] Dogeanu, A., Iatan, A., Bode, F., Croitoru, C., and Nastase, I., Conception of a simplified seated thermal manikin for CFD validation purposes. Romanian Journal of Civil Engineering, 2014. 5.
[31] Topp, C., Hesselholt, P., Trier, M.R., and Nielsen, P.V. Influence of geometry of thermal manikins on room airflow. in Healthy Buildings 2003 - Proceedings 7th International Conference. 2003. National University of Singapore.
[32] Cao, X., Liu, J., Jiang, N., and Chen, Q., Particle image velocimetry measurement of indoor airflow field: A review of the technologies and applications. Energy and Buildings, 2014. 69(0): p. 367-380.
[33] Raffel, M., Willert, C.E., Wereley, S.T., and Kompenhans, J., Particle Image Velocimetry A Practical Guide. Second Edition ed. 2007.
[34] Sandberg, M., Whole-Field Measuring Methods in Ventilated Rooms. HVAC&R Research, 2007. 13(6): p. 951-970.
[35] Cao, X., Liu, J., Pei, J., Zhang, Y., Li, J., and Zhu, X., 2D-PIV measurement of aircraft cabin air distribution with a high spatial resolution. Building and Environment, 2014.
82(0): p. 9-19.
[36] AFNOR, Ventilation des bâtiments - Bouches d'air - Essais aérodynamiques et caractérisation pour applications en diffusion à mélange, in NF EN 12238. 2001. [37] ISO, Acoustique -- Mesurages in situ de l'isolement aux bruits aériens et de la
transmission des bruits de choc ainsi que du bruit des équipements -- Méthode de contrôle, in ISO 10052. 2004.
[38] Ministère de l’Écologie du Développement durable et de l’Énergie Ministère du Logement et de l’Égalité des territoires, Guide de Mesures Acoustiques. 2014.
[39] Ko, N.W.M. and Lau, K.K., Flow structures in initial region of two interacting parallel plane jets. Experimental Thermal and Fluid Science, 1989. 2(4): p. 431-449.
[40] Harima, T., Fujita, S., and Osaka, H., Turbulent properties of twin circular free jets with various nozzle spacing. Engineering Turbulence Modeling and Experiments, 2005. 6: p. 501-510.
[41] Meslem, A., Dia, A., Beghein, C., El-Hassan, M., Nastase, I., and Vialle, P., A comparison of three turbulence models for the prediction of parallel lobed jets in perforated panel optimization. Building and Environment, 2011. 46: p. 2203-2219. [42] Patte-Rouland, B., Lalizel, G., Moreau, J., and Rouland, E., Flow analysis of an annular
jet by particle image velocimetry and proper orthogonal decomposition. Measurement Science and Technology, 2001. 12(9): p. 1404.
[43] Li, K. and Tankin, R.S., A Study of Cold and Combusting Flow Around Bluff-Body Combustors. Combustion Science and Technology, 1987. 52(4-6): p. 173-206.
[44] Kuhlman, J.M., Variation of entrainment in annular jets. AIAA Journal, 1987. 25(3): p. 373-379.
[45] Tuve, G.L., Air velocities in ventilating jets, ASHVE Research Report No.1476, in ASHVE Transactions, 58. 1953. p. 261-283.
[46] Rajaratnam, N., Turbulent jets. 1976, Amsterdam, Netherlands: Elsevier Scientific Publishing Company.
[47] Ricou, F.P. and Spalding, D.B., Measurements of entrainment by axisymmetrical turbulent jets. Journal of Fluid Mechanics, 1961. 11(01): p. 21-32.
[48] Brelih, N., Thermal and acoustic comfort requirements in European standards and national regulations. REHVA Journal, 2013.
Fig. 1 (a) Sketch of the climate chamber – 1 perforated plate, 2 honeycomb, 3 diffuser, 4 dropped ceiling, P1 and P2 acoustic measurement points; (b) Details of the plenum box; (c; d)
Mean velocity profile and corresponding turbulence intensity profile at the exit of the plenum box Z=0.25D - W0 = 2.13 m/s 0 2 4 6 8 10 12 14 -1.2 -0.8 -0.4 0 0.4 0.8 1.2 Wrm s / W 0 (%) X / D or Y / D Pr1 Pr2 0 0.2 0.4 0.6 0.8 1 1.2 -1.2 -0.8 -0.4 0 0.4 0.8 1.2 W / W 0 X / D or Y / D Pr1 Pr2 (a) (b) (c) (d)
Fig. 2. (a, b) Conventional diffuser (CD) and its dimensions; (c) Control-setting of jet behavior - double-headed arrow (left) indicates the movement up/down of the inner cones, the
two arrows (right) indicate the position of inner cones for radial jet generation; (d, e) Mounting of the inserted lobes into the CD, (f, g) Geometry details of the inserted lobes
(a) (b) ØD (mm) A × B (mm) A (mm) B (mm) E (mm) F (mm) P (mm) A × B (mm) 160 600 × 600 354 295 110 55 270 220 × 220 (c) Lobes inserts F J I (d) (e) (g) (f) Lobes inserts Ø 100 Ø 222
Fig. 3 Heated zones of the manikin – the dimensions are in mm and the heating powers are given in Table 1
Fig. 4 (a) PIV windows in the vertical middle cross section of the room (in green); (b) positions in the horizontal plane of the room of the heated manikin (HM), of the 16 verticals canes, of hot-sphere anemometers and thermocouples, and of the black globe thermometer
Fig. 5 Example of histograms of PIV displacement data: (a) full range displacements in window 3 of Fig. 4, a; (b) corresponding sub-pixel displacements (zoom around the most
probable mode) 0 1 2 3 4 5 6 -2 -2 -1 0 1 2 2 3 4 5 P ro b ab il it y [ %] Displacement [pixel] 0 0.25 0.5 0.75 1 1.25 1.5 1.75 2 -0.5 -0.4 -0.3 -0.2 -0.1 0.0 0.1 0.2 0.3 0.4 P ro b ab il it y [ %] Displacement [pixel]
Fig. 6 Indoor wall-surface temperatures in steady state conditions for two inlet volumetric flow-rates 18.1 17.1 18.4 17.9 18.0 17.1 17.2 16.8 17.7 17.5 17.7 17.5 18.1 17.1 16.8 17.1 20.4 20.9 8 19.7 19.1 20.3 21.3 20.1 19.5 17.4 17.2 17.6 16.9 16.2 16.1 15.8 15.3 18.1 17.3 16.2 15.7 17.5 17.2 16.4 16.1 19.3 18.9 18.1 19.1 19.2 19.0 19.2 18.7 Q0 = 200 m3/h Q0= 275 m3/h Ceiling W Wall N Wall E Wall S Wall Floor CD N S E W 18.4 17.3 18.6 18.0 18.1 17.2 17.0 16.4 17.8 16.9 17.8 17.1 18.4 17.3 16.9 16.1 20.3 21.2 19.6 19.5 20.1 21.0 19.4 19.6 17.8 17.5 17.6 17.1 15.8 16.1 15.8 15.4 18.3 17.5 16.2 15.8 17.6 17.3 16.3 16.2 19.7 19.1 18.2 18.0 20.1 18.9 19.4 19.6 Q0 = 200 m3/h Q0 = 275 m3/h Ceiling W Wall N Wall E Wall S Wall Floor LD
Fig 7 (a1, b1) Velocity magnitude of the jet field for Q0=200 m3/h - hatching zone around the
manikin corresponds to the laser scattering, the magenta line represents
(a1) CD (b1) LD (a2) (b2) 2 2 W U
Fig. 8 (a) Sketch of annular jet; (b) Axial velocity profiles; (c) Maximum axial velocity changes; (d) Positions of maximum velocity; (e) Maximum velocity and centerline velocity in
the merging and the converging regions of the annular jet; (f) Annular jet width X0.5, X0.1 -200 -100 0 100 200 0 100 200 300 400 XW m ax [mm] Z [mm] CD LD ZCP ZCP (a) (b) (c) (d) (e) (f) 0 100 200 300 400 500 600 0 500 1000 1500 X [mm] Z [mm] CD LD CD LD X0.5 X X0.1 X 0 0.5 1 1.5 2 2.5 3 3.5 4 0 500 1000 1500 W m a x [m/ s] Z [mm] CD LD 1 1.5 2 2.5 3 3.5 4 0 100 200 300 400 ZCP ZCP ZMP ZMP -3 -2 -1 0 1 2 3 4 0 100 200 300 400 W [m/ s] Z [mm] CD LD CD LD WC W Wmax W -3 -2 -1 0 1 2 3 4 5 -200 -100 0 100 200 W [m/ s] X [mm] CD: Z = ZMP = 148 mm LD: Z = ZMP= 156 mm CD: Z = ZCP= 260 mm LD: Z = ZCP= 320 mm CD: Z = 50 mm LD: Z = 50 mm -2 -1 0 1 2 3 4 -200 -100 0 100 200 W [m/ s] X [mm] CD CD LD LD CD LD CD: Z =ZMP CD: Z =ZCP LD: Z =ZMP LD: Z =ZCP CD: Z =100 mm LD: Z =100 mm -2 -1 0 1 2 3 4 -200 -100 0 100 200 W [m/ s] X [mm] CD CD LD LD CD LD CD: Z =ZMP CD: Z =ZCP LD: Z =ZMP LD: Z =ZCP CD: Z =100 mm LD: Z =100 mm -2 -1 0 1 2 3 4 -200 -100 0 100 200 W [m/ s] X [mm] CD CD LD LD CD LD CD: Z =ZMP CD: Z =ZCP LD: Z =ZMP LD: Z =ZCP CD: Z =100 mm LD: Z =100 mm -2 -1 0 1 2 3 4 -200 -100 0 100 200 W [m/ s] X [mm] CD CD LD LD CD LD CD: Z =ZMP CD: Z =ZCP LD: Z =ZMP LD: Z =ZCP CD: Z =100 mm LD: Z =100 mm -2 -1 0 1 2 3 4 -200 -100 0 100 200 W [m/ s] X [mm]
CD
CD
LD
LD
CD
LD
CD: Z =ZMP CD: Z =ZCP LD: Z =ZMP LD: Z =ZCP CD: Z =100 mm LD: Z =100 mm -2 -1 0 1 2 3 4 -200 -100 0 100 200 W [m/ s] X [mm]CD
CD
LD
LD
CD
LD
CD: Z =ZMP CD: Z =ZCP LD: Z =ZMP LD: Z =ZCP CD: Z =100 mm LD: Z =100 mm CD: Z = 1200 mm LD: Z = 1200 mm -3 -2 -1 0 1 2 3 4 5 -200 -100 0 100 200 W [m/ s] X [mm] CD CD LD LD CD LD Série7 Série8 CD: Z =ZMP = 148 mm LD: Z =ZMP = 156 mm CD: Z =ZCP = 260 mm LD: Z =ZCP = 320 mm CD: Z =50 mm LD: Z =50 mm -2 -1 0 1 2 3 4 -200 -100 0 100 200 W [m/ s] X [mm] CD CD LD LD CD LD CD: Z =ZMP CD: Z =ZCP LD: Z =ZMP LD: Z =ZCP CD: Z =100 mm LD: Z =100 mm -2 -1 0 1 2 3 4 -200 -100 0 100 200 W [m/ s] X [mm]CD
CD
LD
LD
CD
LD
CD: Z =ZMP CD: Z =ZCP LD: Z =ZMP LD: Z =ZCP CD: Z =100 mm LD: Z =100 mm -2 -1 0 1 2 3 4 -200 -100 0 100 200 W [m/ s] X [mm]CD
CD
LD
LD
CD
LD
CD: Z =ZMP CD: Z =ZCP LD: Z =ZMP LD: Z =ZCP CD: Z =100 mm LD: Z =100 mm -2 -1 0 1 2 3 4 -200 -100 0 100 200 W [m/ s] X [mm] CD CD LD LDCD
LD
CD: Z =ZMP CD: Z =ZCP LD: Z =ZMP LD: Z =ZCP CD: Z =100 mm LD: Z =100 mm -2 -1 0 1 2 3 4 -200 -100 0 100 200 W [m/ s] X [mm] CD CD LD LD CD LD CD: Z =ZMP CD: Z =ZCP LD: Z =ZMP LD: Z =ZCP CD: Z =100 mm LD: Z =100 mm -2 -1 0 1 2 3 4 -200 -100 0 100 200 W [m/ s] X [mm]CD
CD
LD
LD
CD
LD
CD: Z =ZMP CD: Z =ZCP LD: Z =ZMP LD: Z =ZCP CD: Z =100 mm LD: Z =100 mm CD: Z =1200 mm LD: Z =1200 mm -3 -2 -1 0 1 2 3 4 5 -200 -100 0 100 200 W [m/ s] X [mm] CD CD LD LD CD LD Série7 Série8 CD: Z =ZMP = 148 mm LD: Z =ZMP = 156 mm CD: Z =ZCP = 260 mm LD: Z =ZCP = 320 mm CD: Z =50 mm LD: Z =50 mm -2 -1 0 1 2 3 4 -200 -100 0 100 200 W [m/ s] X [mm] CD CD LD LD CD LD CD: Z =ZMP CD: Z =ZCP LD: Z =ZMP LD: Z =ZCP CD: Z =100 mm LD: Z =100 mm -2 -1 0 1 2 3 4 -200 -100 0 100 200 W [m/ s] X [mm]CD
CD
LD
LD
CD
LD
CD: Z =ZMP CD: Z =ZCP LD: Z =ZMP LD: Z =ZCP CD: Z =100 mm LD: Z =100 mm -2 -1 0 1 2 3 4 -200 -100 0 100 200 W [m/ s] X [mm]CD
CD
LD
LD
CD
LD
CD: Z =ZMP CD: Z =ZCP LD: Z =ZMP LD: Z =ZCP CD: Z =100 mm LD: Z =100 mm -2 -1 0 1 2 3 4 -200 -100 0 100 200 W [m/ s] X [mm] CD CD LD LDCD
LD
CD: Z =ZMP CD: Z =ZCP LD: Z =ZMP LD: Z =ZCP CD: Z =100 mm LD: Z =100 mm -2 -1 0 1 2 3 4 -200 -100 0 100 200 W [m/ s] X [mm] CD CD LD LD CD LD CD: Z =ZMP CD: Z =ZCP LD: Z =ZMP LD: Z =ZCP CD: Z =100 mm LD: Z =100 mm -2 -1 0 1 2 3 4 -200 -100 0 100 200 W [m/ s] X [mm]CD
CD
LD
LD
CD
LD
CD: Z =ZMP CD: Z =ZCP LD: Z =ZMP LD: Z =ZCP CD: Z =100 mm LD: Z =100 mm CD: Z =1200 mm LD: Z =1200 mmFig. 9 (a) Jet width fit; (b) Axial velocity fit; (c,d) Axial velocity profiles for the CD (c) and for the LD (d) - Comparison with the similarity law of Tuve [45]. The data were obtained
without the presence of the manikin
0 0.2 0.4 0.6 0.8 1 1.2 -2 -1 0 1 2 W /W m a x X/X0.5 = 8.5 = 10.6 = 12.7 Tuve [45] 0 A Z 0 A Z 0 A Z 0 0.2 0.4 0.6 0.8 1 1.2 -3 -2 -1 0 1 2 3 W /W m a x X/X0.5 = 8.5 = 10.6 = 12.7 Tuve [45] 0 A Z 0 A Z 0 A Z (a) (b) (c) (d) CD LD 0 0.5 1 1.5 2 0 2 4 6 8 10 12 14 0 A X 0 5. 0 A X LD curve fit: C = 0.108; bx= 0.250; R² = 0.99 0 0.5 1 1.5 2 0 5 10 15 CD LD 0 A X 0 5. 0 A X b A Z C A X 0 0 5 . 0 CD curve fit: C = 0.095; b = 0.101; R² = 0.99 LD curve fit: C = 0.108; b = 0.250; R² = 0.99 0 0.5 1 1.5 2 0 5 10 15 CD LD 0 A X 0 5. 0 A X b A Z C A X 0 0 5 . 0 CD curve fit: C = 0.095; b = 0.101; R² = 0.99 LD curve fit: C = 0.108; b = 0.250; R² = 0.99 CD curve fit: C = 0.095; bx= 0.101; R² = 0.99 x n n b A Z C A X0.5 0 1 2 3 4 0 2 4 6 8 10 12 14 LD curve fit: Kw= 0.20; bw= 0.120; R² = 0.99 CD curve fit: Kw= 0.16; bw= 0.146; R² = 0.99 0 0.5 1 1.5 2 0 5 10 15 CD LD 0 A X 0 5. 0 A X b A Z C A X 0 0 5 . 0 CD curve fit: C = 0.095; b = 0.101; R² = 0.99 LD curve fit: C = 0.108; b = 0.250; R² = 0.99 0 0.5 1 1.5 2 0 5 10 15 CD LD 0 A X 0 5. 0 A X b A Z C A X 0 0 5 . 0 CD curve fit: C = 0.095; b = 0.101; R² = 0.99 LD curve fit: C = 0.108; b = 0.250; R² = 0.99 0 A X c n W W w n w c n b A Z K W W
Fig. 10 Statistic distribution of PPD and DR indices for the two diffusers, ISO 7730 standard is considered: (a) Q0 = 200 m3/h, (b) Q0 = 275 m3/h 0% 20% 40% 60% 80% 100% PPD conventional PPD lobed DR conventional DR lobed A B C >C Q0= 200m3/h 0% 20% 40% 60% 80% 100% PPD conventional PPD lobed DR conventional DR lobed A B C >C Q0= 275m3/h
Fig. 11 Distributions of PPD (a,b) and DR (c,d) in CD (left) and LD (right), (1) Q0 = 200
m3/h, (2) Q0 = 275 m3/h
(2a) (2b)
Fig. 12: Distributions of velocity magnitude (a,b), and air temperature (c,d) for CD (left) and LD right), (1) Q0 = 200 m3/h and (2) Q0 = 275 m3/h
Fig.13 Total pressure loss as a function of volumetric flow rate 0 10 20 30 40 50 60 50 75 100 125 150 175 200 225 250 275 300 Δ P [ P a] Q0[m3/h] CD LD
Fig.14 (a-d) Global sound pressure level of the diffusers and the ventilation equipment measured at the locations P1 and P2 of Fig. 1,
30 32 34 36 38 40 42 44 46 48 50 150 175 200 225 250 275 300 L eq [ d B (A )] Q0[m3/h] With CD - Mean With LD - Mean 30 32 34 36 38 40 42 44 46 48 50 150 175 200 225 250 275 300 L eq [ d B (A )] Q0[m3/h] With CD - P1 With CD - P2 With LD - P1 With LD - P2 30 32 34 36 38 40 42 44 46 48 50 50 75 100 125 150 175 200 225 250 275 300 L eq [ d B (A )] Q0[m3/h] Without diffuser - P2 With CD - P2 With LD - P2 30 32 34 36 38 40 42 44 46 48 50 50 75 100 125 150 175 200 225 250 275 300 L eq [ d B(A )] Q0[m3/h] Without diffuser- P1 With CD - P1 With LD - P1 (a) (b) (c) (d)
Fig.15 Pressure losses and sound pressure levels as a function of volumetric flow rate for CD (a) and LD (b) 1 10 50 75 100 125 150 175 200 225 250 275 300 Δ P [ P a] Q0[m3/h] 32 38 42 46 47 Leq [dB(A)] 1 10 50 75 100 125 150 175 200 225 250 275 300 Δ P [ P a] Q0[m3/h] 32 37 43 46 47 Leq [dB(A)] (a) (b)
Table 1: Thermal power for the 8 parts of the heated manikin
Zone Head Torso Back Left
Arm Right Arm Upper Legs Lower Legs Right Shoulders Total [Watts] Symbols H T B LA RA UL LL RS 81 Power [Watts] 6 8 9 10 12 9 18 9
Table 2. Experimental conditions for thermal comfort measurements Cases Experimental conditions (*) Q0 [m3/h] T0 [°C] Ta [°C] r T [°C] Top [°C] p T [°C] RH [%] Qt [W/m²] Ar Re CD 200 ±6 34.9 ±0.1 21.6 ±0.2 18.3 ±0.6 21.6 ±0.3 18.1 ±0.6 46 ±2 74.2 0.0091 25000 275 ±8 31.0 ±0.1 22.2 ±0.2 18.0 ±0.6 20.8 ±0.3 17.6 ±0.6 41 ±2 67.5 0.0033 34400 LD 200 ±6 34.9 ±0.1 21.9 ±0.2 18.4 ±0.6 21.3 ±0.3 18.2 ±0.6 46 ±2 72.5 0.0089 25000 275 ±8 31.0 ±0.1 22.4 ±0.2 18.1 ±0.6 21.0 ±0.4 17.7 ±0.6 41 ±2 67.0 0.0032 34400
Table 3: Statistic distribution of PPD and DR indexes for the two diffusers Cat. ISO 7730 Conditions Conventional 200 m3/h Lobed 200 m3/h Conventional 275 m3/h Lobed 275 m3/h A DR < 10% 95 97 72 92 B 10 < DR < 20% 5 3 22 8 C 20 < DR < 30% 0 0 6 0 A PPD < 6% 0 0 0 0 B 6 < PPD < 10% 55 75 28 81 C 10 < PPD < 15% 45 25 69 19 out PPD > 15% 0 0 3 0
Table 4: Physical parameters for PMV-PPD calculation using ASHRAE 55-2010 comfort tool
Physical parameters Conventional 200 m3/h Lobed 200 m3/h Conventional 275 m3/h Lobed 275 m3/h r T (°C) 18.3 18.4 18.0 18.1 air T (°C) 20.3 20.5 20.8 21.1 Ta (°C) 21.6 21.9 22.2 22.4 T0 (°C) 34.9 34.9 31.0 31.0 air V (m/s) 0.08 0.07 0.14 0.10 RH (%) 46 46 41 41 Icl (clo) 1 1 1 1 Meta (met) 1.2 1.2 1.2 1.2


![Fig. 9 (a) Jet width fit; (b) Axial velocity fit; (c,d) Axial velocity profiles for the CD (c) and for the LD (d) - Comparison with the similarity law of Tuve [45]](https://thumb-eu.123doks.com/thumbv2/123doknet/14387632.507601/30.892.113.785.113.661/width-axial-velocity-axial-velocity-profiles-comparison-similarity.webp)