HAL Id: hal-01022260
https://hal-enac.archives-ouvertes.fr/hal-01022260
Submitted on 23 Jul 2014
HAL is a multi-disciplinary open access
archive for the deposit and dissemination of
sci-entific research documents, whether they are
pub-lished or not. The documents may come from
teaching and research institutions in France or
abroad, or from public or private research centers.
L’archive ouverte pluridisciplinaire HAL, est
destinée au dépôt et à la diffusion de documents
scientifiques de niveau recherche, publiés ou non,
émanant des établissements d’enseignement et de
recherche français ou étrangers, des laboratoires
publics ou privés.
FromDaDy : spreading aircraft trajectories across views
to support iterative queries
Christophe Hurter, Benjamin Tissoires, Stéphane Conversy
To cite this version:
Christophe Hurter, Benjamin Tissoires, Stéphane Conversy. FromDaDy : spreading aircraft
trajec-tories across views to support iterative queries. INFOVIS 2009, IEEE Information Visualization
Conference, Oct 2009, Atlantic City, United States. pp 1017-1024, �10.1109/TVCG.2009.145�.
�hal-01022260�
FromDaDy: Spreading Aircraft Trajectories Across Views to
Support Iterative Queries
Christophe Hurter, Benjamin Tissoires, and Stéphane Conversy
Abstract—When displaying thousands of aircraft trajectories on a screen, the visualization is spoiled by a tangle of trails. The
visual analysis is therefore difficult, especially if a specific class of trajectories in an erroneous dataset has to be studied. We designed FromDaDy, a trajectory visualization tool that tackles the difficulties of exploring the visualization of multiple trails. This multidimensional data exploration is based on scatterplots, brushing, pick and drop, juxtaposed views and rapid visual design. Users can organize the workspace composed of multiple juxtaposed views. They can define the visual configuration of the views by connecting data dimensions from the dataset to Bertin’s visual variables. They can then brush trajectories, and with a pick and drop operation they can spread the brushed information across views. They can then repeat these interactions, until they extract a set of relevant data, thus formulating complex queries. Through two real-world scenarios, we show how FromDaDy supports iterative queries and the extraction of trajectories in a dataset that contains up to 5 million data.
Index Terms—visualization, iterative exploration, direct manipulation, trajectories.
1 INTRODUCTION
In the Air Traffic Control (ATC) field, analyzing traffic or devising new ways of managing airspace requires trajectories analysis. An aircraft trajectory is a record of positions of an aircraft in a given airspace (3D+time plus other information such as identifier, speed etc). As such, trajectories are multidimensional data. Air Traffic stake-holders regularly analyze traffic to:
• understand past conflicts and then improve safety with adequate evolutions,
• assess new onboard and ground safety systems and the resulting aircraft trails,
• devise new air space organization and procedures to handle traffic increase,
• compare trails with environmental considerations (fuel consumption, noise pollution, vertical profile comparison), • study profitability from a business trajectory point of view
(number of aircraft on a specific Flight Route per day, number of aircraft that actually landed at a specific airport…),
• filter and extract trajectories in order to re-use them (this task will be later illustrated in this paper in the section on trajectory extraction for Air Traffic Controllers’ training). Formulating queries over trajectories in a declarative, textual-language based manner, such as a SQL, is hard. Even if it is possible to select trajectories that flow over specific locations, it is very difficult to specify features like “select trajectories where this part of the trajectory is straight” or “where this part has a constant climbing rate”… Thus, visual analysis remains the only way to detect relevant trajectory features efficiently.
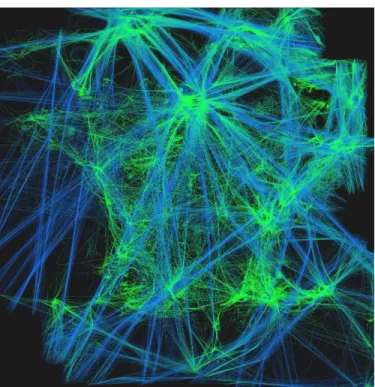
Trajectories are numerous and tangle: one-day's traffic over France for example, represents some 20000 trajectories ( Fig. 1). When dealing with trajectories, users must perform dynamic requests (response time < 100 ms [15]) on a huge multi-dimensional dataset (>1 million data). In addition to the data size problem, users have to deal with a dataset that contains many errors and uncertainties: recording is done in a periodic manner (in our database: a radar plot per aircraft every 4 minutes), but a plot can be missed, or have erroneous values because of physical problems that occurred at the time of recording. The problem we address in this paper is to find a way to express these queries, simply and accurately, given the constraints of size and uncertainty of the datasets.
We have developed FromDaDy (which stands for “FROM DAta to DisplaY”), a visualization tool that tackles the challenge of representing, and interacting with, numerous trajectories involving uncertainties. FromDaDy employs a simple paradigm to explore multidimensional data based on scatterplots, brushing, pick and drop, juxtaposed views and rapid visual configuration. The fundamental new aspect of FromDaDy compared to existing visualization systems, is to enable users to spread data across views. Together with a finely tuned mix between design customization and simple interaction, users can filter, remove and add trajectories in an iterated manner until they extract a set of relevant data, thus formulating complex queries.
The remainder of this paper is organized as follows. First, we present relevant related work. Then we list the design requirements to fulfill the trajectory analysis task. Next, we describe FromDaDy features and justify our implementation choices. Finally, we outline the strengths of FromDaDy with two specific data extraction scenarios. • Christophe Hurter is with DSNA/DTI R&D, ENAC and IRIT/IHCS
E-Mail: christophe.hurter@aviation-civile.gouv.fr.
• Benjamin Tissoires is with DSNA/DTI R&D, ENAC and IRIT/IHCS
E-Mail: tissoire@cena.fr.
• Stéphane Conversy is with ENAC and IRIT/IHCS
E-Mail: stephane.conversy@enac.fr.
Manuscript received 31 March 2009; accepted 27 July 2009; posted online 11 October 2009; mailed on 5 October 2009.
For information on obtaining reprints of this article, please send email to: tvcg@computer.org .
2 RELATED WORK
FromdDaDy proposes a simple model of interaction that, compared to existing models of interaction, provides more explicit support for incremental data exploration, visual configuration and Boolean operations. Our work is based on many previous research publications on visualization and interaction with multidimensional data (Spotfire [1], Tableau/Polaris [16], GGobi [17], TimeSearcher [11]).
2.1 The dataflow model
Card, Mackinlay and Shneiderman [6] proposed a model that describes visualizations as a data flow sequence from the raw data to the views. This data flow model is still widely used in a lot of visualization software (SpotFire [1], VQE [7] , InfoVis Toolkit [9], ILOG Discovery [3], nVizN [19]…).
Fig. 1 : One-day’s record of traffic over France. The color gradient from green to blue represents the ascending altitude of aircraft (green being the lowest and blue the highest altitude). The French coastline is
apparent here in terms of sightseeing by light aircraft and the straight blue lines represent high altitude Flight Routes.
2.2 Simple filtering and selection
Though originally designed for data exploration, Dynamic Queries [2] represents the seminal work in query design. The associated “range-slider” widget, allows for fast, incremental manipulation of ranges, with immediate effect [15] . As such, a range-slider reifies a simple query, which filters out data outside the range.
Some systems allow data to be selected by defining an area over graphical entities, which changes their appearance (for example, they are reddened). In a multiple view system, such as a scatterplot matrix, selected data appear highlighted both in the view manipulated by the user, and in the other views, making it possible to understand the relationships between selected data.
Interactions for selecting data include one-by-one designation [12], rubber-band rectangle [12][8], lassoing [8] or brushing [4]. Various systems propose enhanced brushing techniques, such as XmdvTool [18]. However, they require a complex interface to tune parameters, which hinders rapid iteration. For example, an “erase-data” mode in XmdvTool is accessible, but only through a dialog box.
2.3 Defining filtering and selection
All tools enable the user to define a selection, but again in various degrees. With Dynamic Queries, users can point to a range-slider previously manipulated to adjust the range. “Rolling the Dice” [8] makes it possible to “sculpt” queries, but only by defining a new selection to be combined with existing ones. Though not fully explained, it seems that redefining a selection requires defining a completely new one: it does not seem possible to resize a rubber
rectangle or modify a lasso shape. XmdvTools allows the user to add a new brush over an existing one, but does not allow removal of parts of the stroke [18]. TimeSearcher allows the user to select time series with movable boxes [11].
2.4 Multiple filtering and selections, Boolean operations
Multiple range-sliders implicitly combine their queries into a single one, implementing a Boolean “and” operation. Some systems allow multiple selections (sometimes called “layers”), differentiated by colors. This enables the user to find patterns between the different groups of selected data. The combination of selections is done by the visualisation of a mix of differently colored shapes. Thus users visually apply a “xor” operation when seeking groups of isolated shapes, while they apply an “and” operation when they try to group differently-colored shapes.
In some systems, users can explicitly define how selections are combined by choosing a Boolean operation: the resulting selection is then highlighted with yet another color. The interaction uses either a specific tool [18], or a specific button of the interface at the start of the interaction [13]. “Rolling the Dice” [8] reifies selections into stacked rectangles that enable the user to combine selections by dragging and dropping one rectangle onto another. The choice of which Boolean operation to apply is made by dragging either with the right button (and) or the left button (or). Once executed, the two selections are merged into one, and they cannot be manipulated any further.
2.5 Views organization and navigation
Matrix scatterplots are scatterplots arranged in a matrix, so that every scatterplot on a row (or column) shares the same dimension on the X (or Y) axis. As each dimension is spatially matched to the others, users can detect spatial patterns at a glance. In addition, there is no need to navigate between views, as all of them are displayed at once. This enables users to switch rapidly between views, so as to interact with the view that is the most adapted to the problem at hand. By contrast, a traditional visualization system offers few ways to display multiple views, and forces the user to switch between views with standard window manipulation.
However, the size of scatterplots matrix scales quadratically with the number of dimensions, and results in thumbnail views that are difficult to visualize and interact with. Furthermore, even if interaction-free navigation requires finding a particular scatterplot in the matrix, this sometimes takes time; the user has to find the row and the column of the two dimensions to explore, and then find the scatterplot at the intersection between the row and the column. Designed to overcome this problem, “Rolling the Dice” [8] offers a number of interactions to navigate from one scatterplot to another, and displays a rolling dice-like animation when switching between views. However, “Rolling the Dice” displays only one scatterplot at a time (with geometrically transformed selections already made in other views). This makes interaction with previous selections longer, as it requires the user to look back and switch to a more appropriate view.
3 DESIGN REQUIREMENTS
This section presents the design requirements required to achieve trajectory exploration. The majority of our tasks consist in finding real world trajectories with a specific set of features. This contrasts with the traditional InfoVis tasks, where the goal is to discover trends or outliers. Trajectory features are difficult to specify for two reasons. First, they are often only specifiable with visual features (straight lines, or general shape). Furthermore, users often explore the queries as much as they explore the data: in the course of exploration, users discover that the set of features they thought relevant has to be adapted, either because they were false, or because
they cannot figure out how to query them efficiently. Hence, the system must permit the customization of views so as to offer multiple means of understanding and querying the data visually. It should allow for a quick change of mapping between data and visual dimensions. Often, the set of interesting trajectories for a particular task can only be described by extension: hence, the system must also support iterative selection design, i.e. the ability to store a temporal state of a selection and to be able to improve it later. Trajectory databases are huge and multidimensional (more than 500000 records with more than 10 fields: aircraft’s name, speed, location…). The system should be able to handle this amount of data, and display graphical entities with a frame rate compatible with smooth interaction. As said earlier, our database contains many errors and uncertainties; thus the user must be able to figure out if the displayed trajectory is reliable or not. If not, users must understand why.
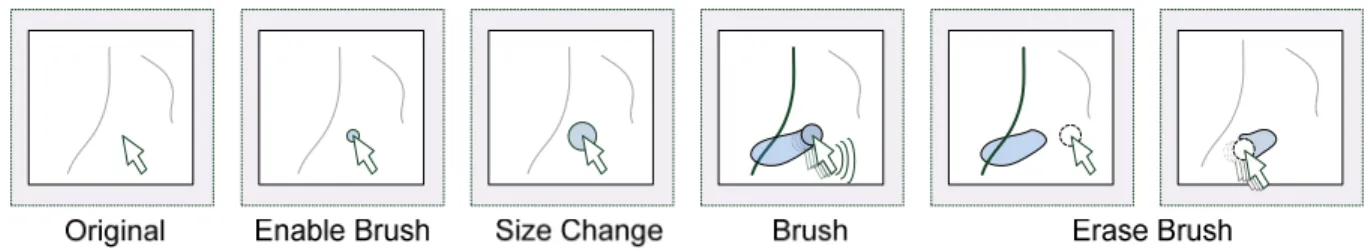
Fig. 2 : The brushing interaction allows the user to select trajectories by brushing them with a size configurable tool.
4 RADAR DATASET
Our radar dataset contains recording of aircraft parameters at a given time (Table 1). This dataset may contain many other fields, but we present here the most important ones. Records are linked through the aircraft identifier (provided by radar tracking). Points are gathered to form trajectories.
Field name details
Latitude Latitude of the aircraft at a given time Longitude Longitude of the aircraft at a given time Flight Level Altitude of the aircraft
Time The time of the record
Speed The aircraft speed Track ID The unique identifier of the aircraft
Table 1 : Record field names and semantics.
The trajectories dataset contains many errors:
• The radar tracking system is faulty when an aircraft has a very low altitude,
• The onboard system may emit temporally wrong information (aircraft ID and altitude) ,
• The flight route used by aircraft may not correspond to the current aircraft heading (due to metrological considerations, traffic optimization or safety reasons). These errors are very important since they can highlight a radar loss detection area, or onboard technical problems. Errors can easily be detected visually when they create outliers or discontinuities in visualization: e.g. the aircraft altitude suddenly jumps to zero then back to high.
The dataset also contains uncertainties, which are due to the sampling rate of the aircraft position. Our available dataset contains aircraft positions every four minutes. Therefore the actual aircraft position between two consecutive positions is unknown. For exemple, aircraft having landed may stop at a high altitude (the last detected position lasting four minutes).
5 SYSTEM DESCRIPTION
This section details FromDaDy basic features for trajectory exploration tasks.
5.1 Visual configuration
FromDaDy uses the data flow model, through a tool that enables a user to draw connections between data dimensions and visual variables [5], thus specifying a visual configuration. For instance, in the left hand image of Fig. 3, the user connected the longitude with the X axis of the view and the latitude with the Y axis of the view. The user also connected the altitude field of the database to the color of the lines. The resulting connections produce a vertical representation of a one-day traffic record over France (see right Fig. 3). The user can also double-click on axis X or Y of a view to make the field selection menu appear, and change the mapping for that axis.
FromDaDy uses an automatic scaling process to make data visible on the screen. This process is based on scaling with the min/max value of each field of the dataset and the configuration of the view. For instance, the user connected longitude with the X screen and latitude with the Y screen: FromDaDy scales the view so that all latitude and longitude values fit into the view.
Fig. 3. The connection tool for visual design (left), menu axis (right)
5.2 Brushing interaction and incremental selection
The user selects a subset by means of a brushing technique. Brushing is an interaction that allows the user to “brush” graphical entities, using a size-configurable or shape-configurable area controlled by the mouse pointer [4]. Each trajectory touched by the area during the mouse movement is selected, and becomes gray. The selection can be modified by further brush strokes (“Ctrl key” pressed), or by removing parts of it with brush strokes in the “erase” mode (“Shift key” pressed). Our implementation leaves a brush trail, so that the user can see and remember more easily how the selection was made. All trajectories that cross the trail are selected: hence, modifying the selection is like painting or erasing the trail (Fig. 2). While the ctrl and shift key are pressed, the size of the stroke can be adjusted with the mouse wheel. If neither of them is pressed, the mouse wheel
allows zooming of the view in and out. The combination of fast switching between the add or erase mode, trail visualization, rapid size-setting, and cursor-centered zooming with the mouse wheel provides for fast, incremental selection.
5.3 “Pick and drop” paradigm
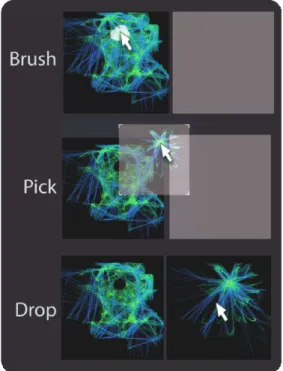
Thanks to the brushing technique, the user can select and highlight parts of the displayed data. By hitting the space bar, the user can extract previously selected data and attach them to the mouse cursor (beginning of Fig. 5). By default, the selected data are picked: they are removed from the view, and appear in a “fly-over” view (transparent background). When the user hits the space bar for the second time, a drop occurs in another view under the cursor. If there is an empty view under the cursor (gray views as shown in Fig. 5), the software creates a new view with the selected data. If the user presses the space bar while moving over an existing view, FromDaDy adds the selected data to this view.
Although it resembles to a regular drag’n’drop operation, we prefer to use the term “pick’n’drop” [14], in the sense that data is removed from the previous view and is attached to the mouse even if the space bar is released.
Fig. 5. Pick and Drop interaction
5.4 The organization of Views
A session starts with a view displaying all the data. The visualization employs a default visual configuration, i.e. the mapping between data dimensions and visual variables. The view is inside a window,
and occupies a cell in a virtual infinite grid that extends from the four sides of the cell. With the brushing and the Pick/Drop paradigm, the user creates new views and changes their visual configurations. The user can select the other cells to display another representation of the data. The user can also destroy a view if the brush selects all the trajectories and if the user picks them.
Fig. 4 : Users control the transition between top (Latitude, Longitude) view and vertical (Altitude, Longitude) view by dragging the mouse along the vertical axis.
5.5 Rolling dice animation
Sudden changes in the axis of the view are disruptive since they prevent the user from tracking changes over time. Therefore FromDaDy uses an animation similar to “Rolling the Dice” [8]. In other words, one dimension in the focused view is preserved while the other changes. The change is visualized using an animated transition. As in [8], instead of simply interpolating the position of each point for the transition, FromDaDy performs the transition as a 3D rotation. This gives some semantic meaning to the movement of the points, allowing the human mind to interpret the motion as a rotating shape, and to keep the focus on visual entities during the transition. The user can also control the transition with a click and drag along an axis (Fig. 4). Rolling dice animation is also used when dragging the picked data over a view.
Fig. 6. FromDaDy interface with cells, design tools and one picked selection
6 INITIAL OBSERVED BENEFITS
FromDaDy has been used by engineers and Air Traffic Controllers. During this qualitative evaluation we observe how they took advantage of FromDaDy’s assets: the spreading of trajectories across views, the extended features of the pick/drop paradigm, the visual configuration choices, and the implicit Boolean operations.
6.1 Spreading data across views
Within FromDaDy, there is a single line per trajectory instance: trajectories are not duplicated, but spread across views. The advantage of this technique is twofold. Firstly, it enables the user to
remove data from a view (and drop them on to the destination view).
The fly-over view enables the user to decide rapidly if the revealed data (previously hidden by the picked one) are interesting. Secondly, it makes it possible to build a data subset incrementally. In this case, the user can immediately assess the quality of the selection, by seeing it in the “fly-over” view. Furthermore, by removing data from the first view, the user makes it less cluttered, and makes it easier for him to pick data again from the first view and drop them on to the second view.
6.2 Picking, transition, and visual configuration picker
The rolling dice animation is also used when the user moves a picked set of trajectories around. When moving over an existing view, the visual configuration of the view may be different from the picked view. In order to prevent sudden changes, FromDaDy animates the transition: the colors, size, pan and zoom change until they reach the parameter of the view under the mouse pointer. This animation is easy to understand and helps the user to figure out the selection layout in the new view before dropping. This enables users to re-assess the quality of the selection, as it allows them to forecast the result of the drop. Furthermore, this interaction acts as a visual configuration picker. The user may want to pick trajectories and apply the visual configuration of another view. To do so, the user brushes and picks trajectories, moves the picked trajectories over the
view with the desired visual configuration, sees FromDaDy apply the configuration to the picked trajectories, and drops the trajectories into an empty cell.
Fig. 7. Union Boolean operation
Fig. 8. Intersection Boolean operation
6.3 Line and brush combination for efficient selection
Trajectories are displayed as dots connected by a line. Other design choices may have been envisaged: one color, shape or size per trajectory. Because trajectories are too numerous, lines remain the only suitable design to separate them visually.
As said above, brushing selects entire trajectory instead of single plots. Line brushing has significant advantages: in a very dense area the brushing of a specific trajectory is difficult, whereas the user can select the same trajectory in a less dense area (for example, the surroundings). The zoom is not always a suitable solution to address the problem of selection in a dense area, since the user often needs a complete view on the trajectories. This design choice may lead to false interpretation as the system connects two non-consecutive plots: the line may hide radar detection loss. This kind of data error can be visually detected when trajectories are straight over a long distance.
Trajectory exploration requires more complex selection shapes than a simple rectangle box, and a configurable selection shape, as supported by FromDaDy is more important than, i.e. a movable one. Unlike many visualization systems, FromDaDy employs a simple brushing tool: the user is able to add brush strokes, and remove parts of them. There is no “erase-data” mode, as pick and drop into a trash cell does the same thing. Though simple to master, FromDaDy allows for complex geometrical queries that other visualization software cannot easily perform.
6.4 Implicit specification of Boolean operations
Boolean operations are cumbersome to produce, even with an astute interface, as results are difficult to foresee [20]. FromDady reduces this drawback, since any operation of the interaction paradigm (brushing, picking and dropping) implicitly performs Boolean operations. The following two examples illustrate the union,
intersection and negation Boolean operations. With these three basic operations the user can perform any kind of Boolean operation: AND, OR, NOT, XOR…
Fig. 7, the user wants to select trajectories that pass through region A or through region B. He or she just has to brush the two desired regions and Pick/Drop the selected tracks into a new view. The resulting view contains his or her query, and the previous one contains the negation of the query. In Fig. 8 the same process is used to find the tracks that pass through A and B. By sequencing two “pick and drop” operations, the user formulates his or her request.
6.5 Seamless view navigation
FromDaDy gives the user partial control over the organization of the workspace. There are no windows to create and manipulate, and there is only a single layout available (juxtaposed views). This enables quick back and forth pick and drop operations between two views, with rough brushing to unveil hidden trajectories followed by precise brushing to restore some of them. The visual configuration tool is always available and allows for rapid representation change. Hence the user never has to interrupt the exploration process to cope with secondary manipulation.
Furthermore, when exploring a query, the user can arrange the workspace, so as to lay out successive steps. This results in a kind of a storyboard that helps visualize the procedure (and not only the data). Thus, in the middle of an unsuccessful exploration, the user can quickly check intermediate views to figure out why the procedure is incorrect.
7 SCENARIOS
This section presents two scenarios that underline FromDaDy's assets. This first scenario illustrates how users can explore a dataset and interactively refine their visual queries. The second scenario is a real case, where FromDaDy was used to extract trajectories for a training simulator for Air Traffic Controllers.
7.1 Iterative exploration
The visualization shown in Fig. 9 displays air traffic over France during one day. The user wants to display transatlantic aircraft that landed or took off at Roissy airport during one day (Roissy is at the main intersection of the lines). To answer this query, the user first devises a procedure composed of two ordered steps. He or She initially decides to filter aircraft that flew over the Atlantic Ocean. To do so, the user brushes the left hand area of the visualization which selects aircraft that flew over the ocean (Fig. 9, right).
Fig. 9. One day traffic (left), transatlantic selection (right). The thicker polygon is the outline of France.
For the second step, the user changes the view configuration to a vertical view (altitude, latitude) and selects aircraft that have a very low altitude at the latitude of the airport (Fig. 10). The user then changes back the view configuration to a top view (X:latitude, Y:longitude).He or She picks the selected data and starts dragging it.
Then the user discovers that trajectories from a second airport, close to Roissy, is part of the selection, and that trajectories landing at Roissy still exist in the view with unpicked data. Furthermore, an intruder aircraft stands out (on the bottom right of Fig. 11). This aircraft performed an unexpected transit flight through Lyon airport, which was not requested.
Fig. 10. One day traffic vertical view (left), bottom selection (right).
Fig. 11. Resulting selection with one intruder (left), zoomed (right) The result of the visual selection is effectively inaccurate: the selection misses trajectories that did not end at a low altitude (erroneous data due to radar detection loss or to the 4 minute sampling rate). Furthermore, the vertical view forces the user to select all trajectories with a low altitude at the same longitude of the selected airport (the two main airports in France have the same longitude but not the same latitude).
Hence, the user has to revise the formulation of the query. He or she performs many tentative explorations and finally finds an additional statement: “aircraft that land at this airport do not overshoot it”. The user selects aircraft that flew over the ocean, and deletes the ones that overshoot the airport, by using a filter-out brushing operation. He or she thus obtains the required result.
Fig. 12. Selection of non overshooting items (left), Zoom out (right). This example illustrates how iterative exploration allows the user to find out the correct procedure to use and how the user modified the query to find the correct result. It also illustrates how unexpected data can be easily removed.
7.2 Specific trajectory extraction for ATC controller training purposes
In this section, we detail in an actual scenario, in which FromDaDy was used to carry out a data exploration task. The user is a specialist in the Air Traffic Control field. His task was to extract specific aircraft fulfilling the following criteria. Aircraft must pass exactly over specific beacons (corresponding to referenced Flight Routes). Their vertical profile must correspond to a constant climbing
trajectory: there should be no continuous horizontal flight. Finally, aircraft must be sorted by their main departure direction.
Aircraft do not always follow standard Flight Routes. Air Traffic Controllers can shorten a trajectory for optimization reasons. Furthermore, an aircraft can deviate from its trajectory if it overshoots beacons. The user has to filter out this kind of data, even though the criteria that specify them are fuzzy.
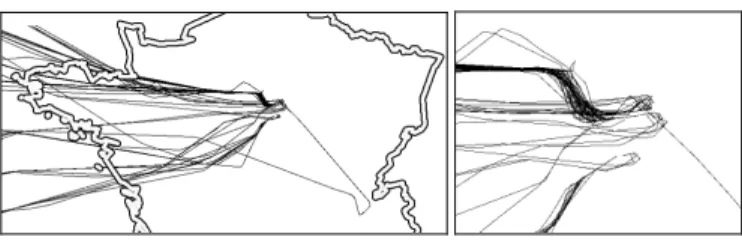
Fig. 13. Original aircraft trajectories (left), landing aircraft trajectories (right) and standard procedures (right hand figure, outlined trajectories
are the published Flight Routes by the air transportation authority) 7.2.1 Step by step actions
The system first displayed a specific view (longitude->X, latitude->Y) (Fig. 13). As explained above, the data are linked by the “Track ID name”, the user can group and join them with a line on the screen, in order to display the different trajectories. Thus, each trajectory concerns a single aircraft.
The user has a rough idea of the position of the standard trajectories and immediately detects them: as they are superposed, they merge into darker lines. The trajectories that surround them are either trajectories shortened by the controller or trajectories that deviated from the initial plan. The user eliminates these trajectories by brushing them and dragging them into a trash cell. FromDaDy also displays two numbers that correspond to the cursor position in the data dimension of the visualization. This enables the user to position the brush precisely at the longitude of the last beacon, and brushes all trajectories that overshoot it, in order to drag them into the trash cell.
Fig. 14. Trajectories that follows the standard procedures (center), sorted trajectories (corners)
At this stage, the user creates as many views as identified aircraft procedures (two North, one East, and one South departure). To do so,
he selects, picks and drops each trajectory into their corresponding view (sorting stage: Fig. 14).
The final step is the selection of the correct vertical profile (Fig. 15). The user changed the visual configuration to a “vertical view” (latitude->X, altitude->Y). The user wanted a constant vertical profile: no aircraft with a continuous flat altitude. Thus the user began to dismiss more aircraft in one view. However, he noticed that he would have been obliged to do so with the three other views. He thus retracted to the previous step by recreating the cell with unsorted trajectories.He applied the vertical profile filtering, and did the sorting step again, thus optimizing his procedure. By organizing the layout of temporary views, the user has been able to target rapidly which steps to retract to.
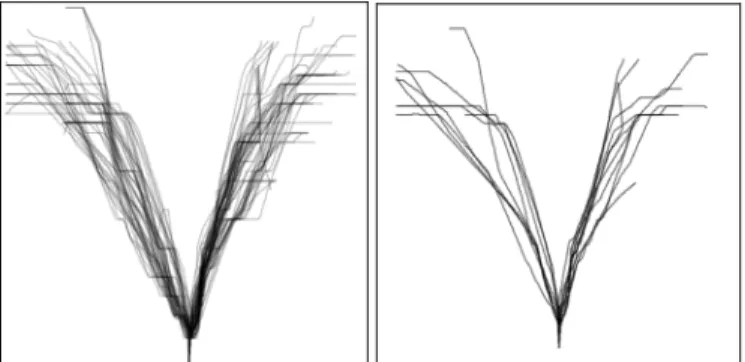
Fig. 15. Trajectories with flat level vertical profile (left), trajectories without flat level (right).
During the vertical profile filtering, the user noticed that the animated transition could have helped him if the views had been correctly arranged. He copied the vertical view under the top view, so that the animation between the top view (longitude, latitude) and the vertical view (longitude, altitude) helped to filter the requested flights: the longitude is common to the two views, therefore the user could focus on the longitude of the last beacon of the Flight Plan and, during the view transition, he could pick out aircraft that had a constant climbing rate up to this longitude (the user can keep the focus on a specific longitude). Again, the ability to organize the workspace rapidly allowed him or her to emphasize the animation feature.
8 TECHNOLOGICAL CONSIDERATIONS
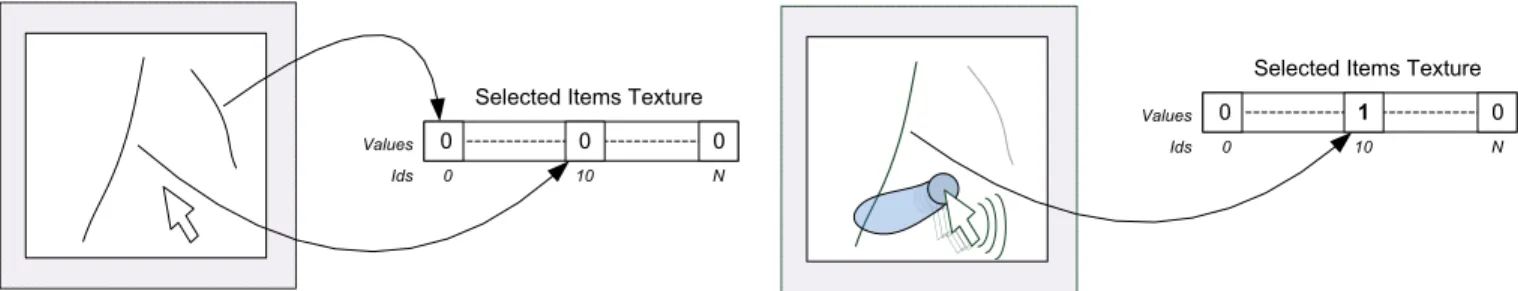
FromDaDy is built in C# with the .Net framework 3.0 for interface implementation and DirectX 10 for GPU programming. The brushing technique with 5 millions points is technologically challenging. Therefore we had to take full advantage of modern graphic card features. FromDaDy uses a fragment shader and the render-to-texture technique [10]. Each trajectory has a unique identifier. A texture (stored in the graphic card) contains the Boolean selection value of each trajectory, false by default. When the trajectory is brushed its value is set to true. The graphic card uses parallel rendering which prevents reading and writing in the same texture in a single pass. Therefore we used a two-step rendering process (Fig. 16) : firstly we test the intersection of the brushing shape and the point to be rendered to update the selected identifier texture, and, secondly, we draw all the points with their corresponding selected attribute (gray color if selected, visual configuration color otherwise) (Fig. 16). We also implemented the rendering of points and lines with geometry shaders.
Thanks to these techniques, FromDaDy can display up to 5 million points in real time (frame rates of over 20 FPS) with 2009 computer generation and a 2009 graphic card (8800GTX).
0 10 N
Selected Items Texture
0 0 0
Ids
Values 0 10
Selected Items Texture
0 1 0
Ids Values
N
Fig. 16. Brushing technique GPU implementation
9 CONCLUSION
FromDaDy is a multidimensional visualization tool making it possible to explore large sets of aircraft trajectories. FromDaDy uses a minimalist interface: a desktop with a matrix of cells, and a dimension-to-visual variables connection tool. Its interactions are also minimalist: brushing, picking, and dropping. Nevertheless the combination of these interactions permits numerous functions: the creation and destruction of working views, the initiation and refinement of selections, the filtering of sub-datasets, the application of Boolean operations, the creation of relevant steps during the exploration process, and the organization of the desktop layout to create a storyboard and visualize the query building procedure. Through two scenarios, we showed how FromDaDy supports iterative queries and the extraction of trajectories in a dataset that contains up to 5 million data points with errors and uncertainties. As such, FromDaDy, meets the need for a rapid, flexible and accurate exploration of numerous trajectories in the ATC field.
Our contribution is not a new interaction technique but rather a carefully reasoned justification of how existing techniques can be usefully combined to perform trajectory extraction. The cornerstone of FromDaDy is the trajectory spreading across views with a simple brush/pick/drop paradigm.
We plan to assess FromDaDy with practitioners in traffic analysis. This will enable us to provide longitudinal studies of other tasks. FromDaDy is not limited to displaying aircraft trajectories. It can use different types of data; we plan to perform further experiments with other datasets, such as GPS tracking.
10 ACKNOWLEDGEMENTS
The authors thank Stéphane Chatty, Jean-Luc Vinot, Jean-Daniel Fekete and Pierre Dragicevic for their invaluable discussions and suggestions. The authors add a special thank you to Jean-Paul Imbert, the very first user of FromDaDy.
11 REFERENCES
[1] Ahlberg, C. 1996. Spotfire: an information exploration environment.
SIGMOD Rec. 25, 4 (Dec. 1996), 25-29.
[2] Ahlberg, C., Williamson, C., and Shneiderman, B. 1992. Dynamic queries for information exploration: an implementation and evaluation. In Proceedings of the SIGCHI Conference on Human Factors in
Computing Systems (Monterey, California, United States, May 03 - 07,
1992). P. Bauersfeld, J. Bennett, and G. Lynch, Eds. CHI '92. ACM, New York, NY, 619-626.
[3] Baudel, T. 2004. Browsing through an information visualization design space. In CHI '04 Extended Abstracts on Human Factors in Computing
Systems (Vienna, Austria, April 24 - 29, 2004). CHI '04. ACM, New
York, NY, 765-766.
[4] Becker, R. A., Cleveland, W. S., Brushing scatterplots. Technometrics (1987) , Vol. 29, No. 2. (1987), pp. 127-142.
[5] Bertin, J., Graphics and Graphic Information Processing de Gruyter Press, Berlin, (1977).
[6] Card, S.K., Mackinlay, J.D., Shneiderman, B., Readings in Information Visualization: Using Vision to Think. San Francisco, California: Morgan-Kaufmann, (1999).
[7] Derthick, M., Kolojejchick, J., and Roth, S. F. 1997. An interactive visual query environment for exploring data. In Proceedings of the 10th
Annual ACM Symposium on User interface Software and Technology
(Banff, Alberta, Canada, October 14 - 17, 1997). UIST '97. ACM, New York, NY, 189-198.
[8] Elmqvist, N.; Dragicevic, P.; Fekete, J.-D., Rolling the Dice: Multidimensional Visual Exploration using Scatterplot Matrix Navigation Visualization, IEEE Transactions on Volume 14, Issue 6, Nov.-Dec. 2008 Page(s):1539 – 1148.
[9] Fekete, J. 2004. The InfoVis Toolkit. In Proceedings of the IEEE
Symposium on information Visualization (October 10 - 12, 2004).
INFOVIS. IEEE Computer Society, Washington, DC, 167-174. [10] Harris, M. 2005. Mapping computational concepts to GPUs. In ACM
SIGGRAPH 2005 Courses (Los Angeles, California, July 31 - August 04, 2005). J. Fujii, Ed. SIGGRAPH '05. ACM, New York, NY, 50. [11] Hochheiser, H. and Shneiderman, B. 2004. Dynamic query tools for
time series data sets: timebox widgets for interactive exploration. Information Visualization 3, 1 (Mar. 2004), 1-18.
[12] Livny, M., Ramakrishnan, R., Beyer, K., Chen, G., Donjerkovic, D., Lawande, S., Myllymaki, J., and Wenger, K. 1997. DEVise: integrated querying and visual exploration of large datasets. SIGMOD Rec. 26, 2 (Jun. 1997), 301-312.
[13] Martin, A. R. and Ward, M. O. 1995. High Dimensional Brushing for Interactive Exploration of Multivariate Data. In Proceedings of the 6th
Conference on Visualization '95 (October 29 - November 03, 1995).
IEEE Visualization. IEEE Computer Society, Washington, DC, 271. [14] Rekimoto, J. 1997. Pick-and-drop: a direct manipulation technique for
multiple computer environments. In Proceedings of the 10th Annual
ACM Symposium on User interface Software and Technology (Banff,
Alberta, Canada, October 14 - 17, 1997). UIST '97. ACM, New York, NY, 31-39.
[15] Shneiderman, B. 1987. Direct manipulation: A step beyond programming languages. In Human-Computer interaction: A Multidisciplinary Approach, R. M. Baecker, Ed. Morgan Kaufmann Publishers, San Francisco, CA, 461-467.
[16] Stolte, C. and Hanrahan, P. 2000. Polaris: A System for Query, Analysis and Visualization of Multi-Dimensional Relational Databases. In
Proceedings of the IEEE Symposium on information Vizualization 2000
(October 09 - 10, 2000). INFOVIS. IEEE Computer Society, Washington, DC, 5.
[17] Swayne, D. F., Lang, D. T., Buja, A., and Cook, D. 2003. GGobi: evolving from XGobi into an extensible framework for interactive data visualization. Comput. Stat. Data Anal. 43, 4 (Aug. 2003), 423-444. [18] Ward, M. O. 1994. XmdvTool: integrating multiple methods for
visualizing multivariate data. In Proceedings of the Conference on
Visualization '94 (Washington, D.C., October 17 - 21, 1994). D.
Bergeron and A. Kaufman, Eds. IEEE Visualization. IEEE Computer Society Press, Los Alamitos, CA, 326-333.
[19] Wilkinson, L., The grammar of Graphics. New York: Springer Verlag (1999).
[20] Young, D. and Shneiderman, B. 1993. A graphical filter/flow representation of Boolean queries: a prototype implementation and evaluation. J. Am. Soc. Inf. Sci. 44, 6 (Jul. 1993), 327-339.