HAL Id: hal-01201785
https://hal.inria.fr/hal-01201785
Submitted on 18 Sep 2015
HAL is a multi-disciplinary open access
archive for the deposit and dissemination of
sci-entific research documents, whether they are
pub-lished or not. The documents may come from
teaching and research institutions in France or
abroad, or from public or private research centers.
L’archive ouverte pluridisciplinaire HAL, est
destinée au dépôt et à la diffusion de documents
scientifiques de niveau recherche, publiés ou non,
émanant des établissements d’enseignement et de
recherche français ou étrangers, des laboratoires
publics ou privés.
A parsimonious computational model of visual target
position encoding in the superior colliculus
Wahiba Taouali, Laurent Goffart, Frédéric Alexandre, Nicolas Rougier
To cite this version:
Wahiba Taouali, Laurent Goffart, Frédéric Alexandre, Nicolas Rougier. A parsimonious computational
model of visual target position encoding in the superior colliculus. Biological Cybernetics (Modeling),
Springer Verlag, 2015, 109 (4-5), �10.1007/s00422-015-0660-8�. �hal-01201785�
Noname manuscript No. (will be inserted by the editor)
A parsimonious computational model of visual target
position encoding in the superior colliculus
Wahiba Taouali · Laurent Goffart · Frédéric Alexandre · Nicolas P. Rougier
Received: date / Accepted: date
Abstract. The superior colliculus (SC) is a brain-stem structure at the crossroad of multiple func-tional pathways. Several neurophysiological stud-ies suggest that the population of active neurons in the SC encodes the location of a visual target to foveate, pursue or attend to. Although extensive research has been carried out on computational modeling, most of the reported models are often based on complex mechanisms and explain a lim-ited number of experimental results. This suggests that a key aspect may have been overlooked in the design of previous computational models. Af-ter a careful study of the liAf-terature, we hypothe-sized that the representation of the whole retinal stimulus (not only its center) might play an impor-tant role in the dynamics of SC activity. To test
This work was supported by the Institut National de la Recherche en Informatique et Automatique (IN-RIA), the Centre National de la Recherche Scientifique (CNRS) and the Agence Nationale de la Recherche : grants MAPS (WT, NR, FA and LG) and VISAFIX (LG).
W. Taouali
Institut de Neurobiologie de la Méditerrantée, INSERM, UMR901, Aix-Marseille University, Marseille, France. Tel.: +33-66-2866453, Fax.: +33-49-1828101
E-mail: [email protected] L. Goffart
Institut de Neurosciences de la Timone, UMR 7289, CNRS, Aix-Marseille University, Marseille, France. F. Alexandre and N.P. Rougier
INRIA Bordeaux Sud-Ouest, Bordeaux, France. LaBRI, Université de Bordeaux, Bordeaux INP, Centre National de la Recherche Scientifique, UMR 5800, Tal-ence, France.
Institut des Maladies Neurodégénératives, Université de Bordeaux, Centre National de la Recherche Scientifique, UMR 5293, Bordeaux, France.
this hypothesis, we designed a model of the SC which is built upon three well accepted principles: the log-polar representation of the visual field onto the SC, the interplay between a center excitation and a surround inhibition and a simple neuronal dynamics, like the one proposed by the dynamic neural field theory. Results show that the retino-topic organization of the collicular activity conveys an implicit computation that deeply impacts the target selection process.
Keywords Computational neuroscience · Neural field · Visual target · Topology · Superior colliculus 1 Introduction
The superior colliculus (SC) has been extensively studied over the past decades through an im-pressive series of neurophysiological experiments that showed its critical role in the gaze orient-ing response (Anderson et al.,1998;Freedman and Sparks,1997;Hafed and Krauzlis,2008;Lee et al., 1988; Munoz and Wurtz, 1995; Robinson, 1972; Schiller and Stryker,1972;Sparks and Mays,1980; Sparks et al., 1976). In parallel to these studies, many models have been proposed to explain some aspects of its function (Arai et al., 1994; Badler and Keller,2002;Droulez and Berthoz,1991; Gan-carz and Grossberg,1999; Goossens and Van Op-stal,2006;Lefèvre et al.,1998;Marino et al.,2008; Nakahara et al., 2006; Short and Enderle, 2001; Trappenberg et al., 2001). Each model generally emphasized on a specific aspect (or property) of the SC and provided an explanation using a ded-icated mechanism. Therefore, a complete picture
of the contribution of the SC remains very diffi-cult to draw because these models were designed to address specific questions. In this paper, we pro-pose an alternative approach. Instead of adding a new model, we propose a computational model of the SC that gathers the common hypotheses on which most of the previous models were founded. These assumptions are the following: 1-The SC is described as a homogenous map of units with a on-center/off-surround lateral connectivity. 2-The dy-namics of SC activity follows the elementary rules of the neural field theory (Ottes et al., 1986). 3-The representation of the visual field locations in the collicular map is non-uniform.
However, in most models, a simplification is made concerning stimulus encoding on the SC map. From the position of the center of the stimu-lus onto the retina, the log-polar transformation is used to determine the position of the center of the stimulus onto SC and a shape (and size) is given to the stimulus by setting on that position a circle (Nakahara et al., 2006) or a gaussian ( Trappen-berg et al., 2001). Particularly, this means that the transformation of the stimulus shape by the log-polar function is not considered in the pro-jection from the retinal map to the SC map. In contrast, an important feature of our model is to consider the projection of the entire stimulus onto the collicular map and not only its center. For the ease of comparison with other models, we kept a simple gaussian shape for the stimulus on the retina. Then, we considered the transformation of this shape by the log polar function as the reti-nal input onto the SC map. We show, in this pa-per, that this assumption, combined with the com-monly used hypotheses, has powerful emerging ef-fects on the dynamics of the collicular activation.
We confronted the performance or our model against most well-known neurophysiological and behavioral observations and found that these prop-erties could be simply explained in terms of inner population dynamics that scale up to the macro-scopic level. In other words, most of the proper-ties of the superior colliculus, particularly those widely studied in target selection paradigms, are observed as emerging from these simple mecha-nisms. This draws two consequences. First, the proposed model constitutes a solid base for future studies that aim to model the visuo-motor loop. To further assess this proposal, as well as to com-plement those points that we neglected, sources of the model are made freely available online. Second,
this model clearly shows that most experiments are actually measuring the very same low-level proper-ties that differ only in their expression at different scales. Finally, the different simulation tasks re-veal that, without taking into account external or high-level inputs, the superior colliculus provides an intrinsic selection process which is dictated by its retinal topology and lateral connectivity. 2 Model description
We assume that, in the SC, the locus of activity encodes the position of the stimulus in the visual field. This activity is supposed to feed the oculomo-tor processes that bring and maintain the stimulus image onto the fovea. Thus, we propose a model composed of two topologically organized layers of neural units. The first layer corresponds to the rep-resentation of the visual field in the retina (R) and the second layer to its representation in the deep superior colliculus (SC). As explained before, the model is only built upon assumptions that are common to most SC models:
– The SC is considered as a homogeneous and uniform map of neural units. Its excitatory inputs from the layer R are transformed by a homogeneous pattern of lateral connectiv-ity characterized by a central excitation whose propagation is counterbalanced by a surround-ing inhibition (Arai et al., 1994; Droulez and Berthoz, 1991; Gancarz and Grossberg, 1999; Lefèvre and Galiana, 1992; Nakahara et al., 2006;Optican,1995; Short and Enderle,2001; Trappenberg et al.,2001). We assumed a short-range excitation and a constant inhibition at the whole population level (each unit receives the same amount of inhibition).
– The spatio-temporal evolution of the collicular activation is ruled by a dynamic neural field (DNF) formalism (Amari,1977) with symmet-ric connectivity kernels (Marino et al., 2012; Schneider and Erlhagen, 2002; Trappenberg et al., 2001). The activity of a single unit de-pends upon both the input received from layer R and the evolution of the population activity in layer SC .
– The projection from the input layer (R) to the output layer (SC) follows a mapping func-tion as described in (Ottes et al., 1986) where a logarithmic function transforms retinotopic coordinates into collicular coordinates, with-out explicitly modeling its biological substrate
(Cowey and Rolls, 1974; Daniel and Whit-teridge, 1961; Johnston, 1986) . Contrary to other models (Arai and Keller,2005;Goossens and Van Opstal, 2006;Marino et al., 2012), it is not the center but the whole stimulus which is initially projected onto the SC.
Afferent influences from the cerebral cortex, the basal ganglia, the reticular formation and the cerebellum on the collicular activity are not consid-ered here. Under such conditions, our simulation of SC activity is limited to those processes that par-ticipate in encoding the location of a visual target before a saccade is launched to bring a selected part of its image onto the fovea. Different locations in the visual field are encoded by different loci of activity in the SC (topographical code) (Schiller and Stryker,1972;Wurtz and Goldberg,1972) (cf. Fig. 1). Finally, we model one single colliculus and do not consider the interactions between the two colliculi.
2.1 Visual input
The space V [0 , 90 ] ⇥ [ 90 , 90 ] corresponding to the visual hemifield is mapped onto the space R [0, 1]⇥ [ 1, 1] corresponding to a half-retina such that any stimulus presented in V with polar coor-dinates (⇢, ) (in degrees) is mapped onto R with Cartesian coordinates (u, v) (in mm). We consid-ered round shaped stimuli with Gaussian distribu-tion of luminance such that the activity Ur(u, v)
at any point (u, v) of R in response to a stimulus is given by the following equation:
Ur(u, v) = C exp ✓ |u us|2+|v vs|2 2 2 c ◆ (1) where (us, vs)is the center of the stimulus
projec-tion onto the R map, c the angular size of the
stimulus and C is the maximum activation in R (corresponding to the maximum intensity of the stimulus). Unless stated otherwise, stimuli have an angular diameter (corresponding to the full band-width of its Gaussian luminosity at its half maxi-mum (FWHM)) of approximately 1 in the retina (bandwidth = 1.5/90 , c = bandwidth2p2 log 2 ). Gaussian
noise (N (0, 0.01)) correlated with retinal activa-tion is added to the retinal input to give account of natural noise and for each computation in the SC, Gaussian noise (N (0, 0.01)) correlated1 with
the SC activation is added to this activation.
1 i.e. activation = activation *(1+N (0, 0.01))
2.2 Projection of the input onto the SC
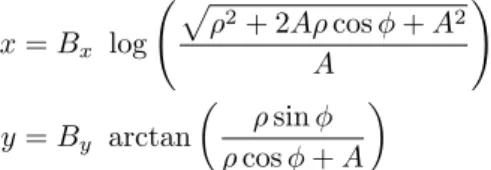
Following the description byRobinson(1972), the projection of R to the SC is approximated using a log-polar transformation, reducing the SC model to a two-dimensional map. A mathematical ap-proximation of this transformation in the monkey was proposed by Ottes et al. (1986) and repre-sents de facto the standard projection used in most computational models (Marino et al.,2008, 2012; Nakahara et al.,2006;Optican,1995;Trappenberg et al., 2001): x = Bx log p ⇢2+ 2A⇢ cos + A2 A ! y = By arctan ✓ ⇢ sin ⇢ cos + A ◆
where (x, y) represents the Cartesian coordinates of a neural unit in the SC, (⇢, ) the polar coordi-nates in R2. B
xand By are scaling constants
cor-responding to the size of the collicular map along the rostrocaudal and mediolateral axes, respec-tively. The value A is a constant which, together with the ratio Bx/By determines the shape of the
mapping. A stimulus at ⇢ = 90 and = 90 ac-tivates a unit at x = 4.8mm (corresponding to the length of one colliculus) and y = 2.76mm (corre-sponding to half its width) (Ottes et al.,1986). As previously explained, the log-polar transformation magnifies the representation of the foveal region (cf. Fig.1).
2.3 Dynamic Neural Field
The SC has been modeled using the DNF theory (Amari, 1977; Taylor, 1999; Wilson and Cowan, 1973) which considers a neuronal volume as a spa-tial continuum. Although this theory was primar-ily proposed for simulating activities in the cere-bral cortex, the neuronal density within the SC is assumed to be high enough to allow a trans-position of this theory to the SC (Marino et al., 2012;Schneider and Erlhagen,2002;Trappenberg et al., 2001). Thus, the DNF formalism describes the population of active units like a continuous field of activity. The neural units, as elements of the map, are considered as an array of homoge-neous processors operating in parallel on incoming
2 We do not consider the deformation of the projec-tion from the visual field to the retina since we suppose the transformation used accounts already for that, see Fig1 inOttes et al.(1986) . Polar coordinates in R are equivalent to polar coordinates in V,
Fig. 1 Projection from layer R to layer SC. a Retinotopic projection distorts the geometrical proper-ties of the image while keeping the neighborhood rela-tionship. b Conformal mapping from visual space to col-licular space makes foveal stimuli to project on a larger area into the superior colliculus compared to more pe-ripheral stimuli
signals. The dynamics of the field activity is gov-erned by an equation of the type:
⌧@
@t(z0, t) = (z0, t) + S(z0, t) +
Z
SCw(|z0 z|)f( (z, t)) dz (2)
where (z0, t) represents the activity (i.e. the
membrane potential) at position z0 = (x, y) in
SC map and time t, S(z0, t)represents the
synap-tic input, w is a weight kernel measuring the strength of connection between two positions, f is the firing rate function of a single neuron and ⌧ is the time scale factor. The firing rate func-tion is defined by the rectificafunc-tion funcfunc-tion f( ) = min(max(0, ), 1)since it is the simplest function that can provide stability for such a field ( Hahn-loser et al.,2003; Salinas and Abbott, 1996). The density of units in the SC is constant through-out the whole surface and the strength of lat-eral connections is a function of the distance
be-tween units.The lateral kernel of a given unit is thus isotropic (uniform in all directions), contrar-ily to Nakahara et al. (2006) where the connec-tion strength is asymmetric based on the visual distance between stimuli in the sensory space and not the spatial distance between neurons in the SC map. Even ifNakahara et al.(2006) mention that there is no clear evidence favoring any option, it is also clear that the asymmetric option is a more complex solution to implement and probably more difficult to implement in the underlying population and to justify in terms of biological plausibility. In contrast, the symmetric option, shared with many other models (of the SC and other neuronal struc-tures), underlies a more simple construction of the map. In our model, considering two units at sites z0 and z1 at a distance |z0 z1|, the strength of
connections is defined by: w(|z0 z1|) = E exp ✓ |z0 z1|2 2 e ◆ I (3) with E being the amplitude and e the
vari-ance of the excitation. For the sake of simplic-ity, the inhibitory influence is considered as con-stant throughout the map (see Discussion). The proposed model considers short-range excitatory connections like in several other studies (Arai et al., 1994; Badler and Keller, 2002; Droulez and Berthoz,1991;Gancarz and Grossberg,1999; Lefèvre and Galiana,1992; Nakahara et al.,2006; Optican,1995;Short and Enderle,2001; Trappen-berg et al.,2001). The effects of local inactivation in the SC were simulated numerically by resetting activity—for the duration of the simulation—in a uniform disc centered on the lesion site zl with a
radius rl corresponding to its extent (i.e. 8 z in
SC, 8 t, if |zl z| < rl then (z, t)=0)
2.4 Target encoding
As reviewed inGandhi and Katnani(2011), several ways of decoding the SC activity have been pro-posed. In the present simulations, the kinematics of saccades and their collicular correlates are not considered. In the proposed model, both the static vector averaging and static vector summation can be unified since the SC activity is stereotyped (see Discussion). Unless stated otherwise, the desired eye displacement E is decoded using a static vec-tor averaging procedure:
E = P
rzRz
Pr
where rz is the mean firing rate of a neural
unit at a position z and Rz is the preferred
vec-tor encoded by that unit taking into account the log-polar transformation. The mean firing rate is defined from equation (2) by:
rz= f ( (z, t))(1 +N (0, 0.01))
2.5 Parameters
The model experiments have been run in Python using the parameters values given in table 1. All sources are available from https://github.com/ taoualiw/Superior-Colliculus.
Table 1 Parameters of the simulations
Parameter Value Parameter Value
Retina size 4096⇥ 4096 Collicular size 128⇥ 128
E 1.30 I 0.65 e 0.1 A 3 C 1.5 Bx 1.4mm c 1.5/90 By 1.8mm ⌧ 100ms 3 Results 3.1 Population response
We first investigated the extent of the SC pop-ulation that is recruited by a stimulus presented at different locations in the visual field. Because of the logarithmic deformation of the visual field onto the SC map, a stimulus that appears in the central visual field initially activates a larger pop-ulation of units than a more peripheral stimulus (cf. Fig. 1-b). However, due to the pattern of lat-eral connectivity, the distribution of activity in the map changes over time. After around 250ms, a sta-ble state is reached and the active population has the same extent regardless of the stimulus location in the visual field, depending only on the ratio be-tween lateral inhibition and excitation in the SC map.
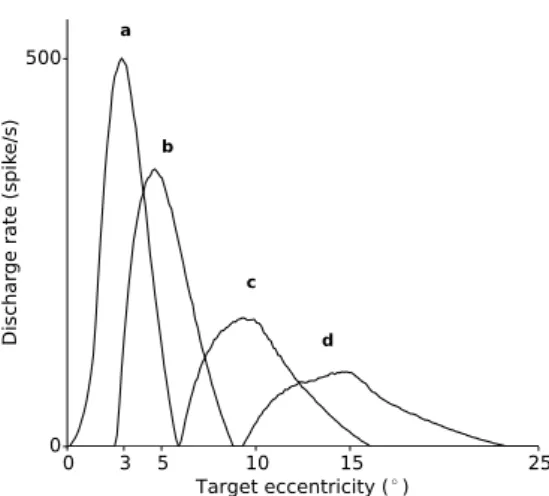
Then, we investigated the profile of the re-sponse fields, i.e. the range of target eccentricities that activate a particular location in the SC map. These response fields emerge from the collicular population dynamics combined with the log-polar nature of the input. Indeed, the tuning curves were obtained by recording each site activation level
Fig. 2 SC response fields. The tuning curves of SC neurons have been recontructed for sites of maximal ac-tivation situated at a(3 , 0 ), b(5 , 0 ), c(10 , 0 ) and d(15 , 0 ). The curves were obtained by record-ing each site activation level (given by the model after stabilization) for each of the 200 stimuli positioned uni-formly over [0 ,25 ]. The extent of the response fields decreases with the eccentricity of the stimulus relative to the fovea.
(given by the model after stabilization) for each of the 200 stimuli positioned uniformly over [0 ,25 ] and not only by applying the projection. The fig-ure 2 shows first that the response field is char-acterized by a firing rate that is maximal for a specific stimulus eccentricity and that gradually declines for eccentricities going off this preferred eccentricity. Interestingly, the size of the response field is larger and the maximum firing rate lower for units located in the caudal SC than for those located more rostrally.
3.2 Accuracy and effect of local inactivation The model encodes the location of a visual stimu-lus with an averaging decoding scheme (equation 4). The figure 3-a shows the actual locations of point stimuli (filled symbols) and the center of mass of their image on the SC (open symbols). In spite of the log-polar transformation and of the expanded response fields, the model exhibits fairly good accuracy (cf. Fig. 3-c,d). For a stim-ulus presented in the parafoveal visual field, the point image is slightly biased toward the caudal end of the SC, whereas the bias is toward the ros-tral end when the same stimulus is presented in the peripheral visual field. Small position mismatches are observed when the stimulus point image ap-proaches the rostral and lateral edges of the SC,
Fig. 3 SC lesions. On left part of the figure, the small open symbols illustrate the center of mass of the stabi-lized SC activity in response to a stimulus presented at different locations in the visual field (target coor-dinates are indicated by the small filled symbols). In the intact model (insets a, c & d), the relative er-ror in target encoding is less than 2.5% along both the rostro-caudal axis and the vertical axis with a stronger error in the foveal region 1.8% that decreases to 0.26% in caudal positions. However, the mean error is almost constant along the vertical axis (mean=0.88, standard deviation=0.07). After a localized inactivation centered at position (5 , 0 ) (insetsb, c & d), there is a dra-matic increase in encoding error in the vicinity of the lesioned site
i.e., collicular regions that encode targets located in the foveal field or along the vertical meridian. These are probably artificial distortions due to the fact that we do not take into account the interac-tions between the two colliculi, as discussed in the concluding part.
We tested the effects of inactivating a small part of the SC (cf section 2.3 for details on the pro-cedure). In the figure3-b, the inactivation is cen-tered on a site encoding the location (5 , 0 ) (polar coordinates). A SC activity evoked by a less eccen-tric stimulus (4 , 0 ) is shifted toward the rostral SC whereas an activity evoked by a more eccen-tric stimulus (6 , 0 ) is shifted toward the caudal end (cf. Fig. 3-c,d). Because of the inactivation, the symmetry of the population that is normally active is altered; it is re-established by a shift of SC activity away from the lesion. In comparison with
Fig. 4 Double target paradigm. Colored circles cor-respond to the position of SC activity center as a func-tion of the relative distance between two stimuli pre-sented at same eccentricity and opposite directions. a When the distance is small, the competition between the two stimuli results in an averaging activity in an in-termediate position. b A selection occurs onto one of the two stimuli beyond a relative distance of approximately 40 , 41 and 47 (vertical lines), corresponding respec-tively to stimuli at ⇢ = 15 in red, ⇢ = 10 in blue and ⇢ = 5 in green
the time that was required to reach stability before inactivation, the shifted locus of activity stabilizes approximately 50 ms later, corresponding to an added delay of 20%.
3.3 Stimuli interaction
The simultaneous presentation of two visual stim-uli activates initially two populations in the SC, which may correspond to an unstable state (Rougier and Vitay, 2006). Starting from an in-active population state, after some time, only one single population remains because the symmetry has been broken by the noise and this leads the system into a stable equilibrium where only one location is active.
The figure 4-a shows that when the angular distance between two stimuli of identical size pre-sented at same eccentricity and opposite directions is small, the population stabilizes at a site which is intermediate between the sites that encode the
location of each stimulus. For larger angular dis-tances, the population stabilizes at either one of the two sites (cf. Fig.4-b). Starting from an inac-tive state (null population activation), this selec-tion is made possible because white noise is added to the activity (see Methods) in order to break the symmetry in the numerical implementation. Inter-estingly enough, this selection is associated with an increase in the time taken to stabilize the ac-tivity at a single site on the collicular map. The figure4 shows that this limit is higher when stim-uli are more peripheral. Indeed, for these stimstim-uli their activation extent is higher and the cartesian distance between them is lower due to the loga-rithmic projection. The limit value is around 50 for low eccentricities (⇢ = 5 ) and around 40 for higher eccentricities (⇢ = 10 , 15 ) (cf. Fig.4).
As shown in figure6, the simultaneous presen-tation of two equivalent targets (same size, same intensity) at different eccentricities leads to a spa-tial bias towards the more foveal stimulus location due to the logarithmic magnification (cf. Fig.1). A selection of the most foveal stimulus occurs beyond a relative distance of approximately 31 , 37 and 43 (vertical lines), corresponding to the brighter stimulus at ⇢ = 15 in red, ⇢ = 10 and ⇢ = 5 , respectively.
This bias could be compensated by increasing the salience of the distal target (size, brightness..). The figure 7 shows the results of presenting two stimuli of same size but at different eccentricities (⇢ and 0.75 ⇥ ⇢) and different intensities (1.0 and 1.5) for three different values of ⇢ such that the brightness of the more caudal target is 50% higher than the other. We found that for some specific ec-centricity values (⇢ = 10 ) there exists an angular distance threshold (41 ) where we got a balanced selection between the two targets (see blue circles in figure7). However, we found that for the eccen-tricity values (⇢ = 5 ), there are three stages : an averaging stage, a balanced stage and a biased fi-nal stage (see red circles in figure7). The difference of brightness is not high enough to compensate for the bias of the caudal target. Finally, we found for the eccentricity value ⇢ = 15 , an averaging stage followed by a biased stage towards the more cau-dal target. The difference of brightness was so high that it inverted the bias.
4 Discussion
The proposed model, based upon a few simple assumptions which are shared by most
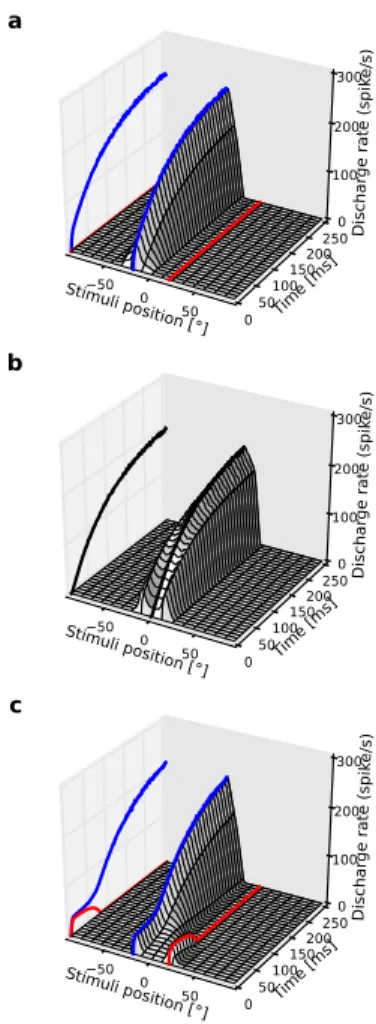
computa-Fig. 5 Double target paradigm I. a Temporal evo-lution of a slice of SC for a single stimulus presented at (5 ,+30 ). b Temporal evolution of a slice of SC for two stimuli presented at (5 ,+20 ) and (5 ,-20 ) show-ing the mergshow-ing of SC activity on the central position. c Temporal evolution of a slice of SC for two stimuli presented at (5 ,+30 ) and (5 ,-30 ) where the lower stimulus is selected
tional models, can predict a large range of ob-servations made in neurophysiological and behav-ioral studies. Three core principles characterize this model: the log-polar transformation of the en-tire retinal input (as opposed to the center of stim-uli only), the balance between the excitatory in-put from the Retina and the lateral interactions (short-term excitation and global constant inhibi-tion) and the dynamics of the population activity. Our study bears resemblance to the study by Nakahara et al.(2006) showing that an asymmet-ric kernel led to a spread of activity across the SC (see their figure 3). Indeed, they both share classi-cal hypotheses, particularly representations in
to-Fig. 6 Double target paradigm II (Eccentricity effect). Two stimuli with same sizes and brightness in-tensities presented at opposite directions ( and , respectively) and shifted eccentricities (0.75⇢ and ⇢, re-spectively). Colored circles correspond to the position of SC activity center as a function of the relative angular distance between two stimuli (= 2 ) for three different values of ⇢ ( 15 in red, 10 in blue and 5 in green). a When the distance is small, the competition between the two stimuli results in an averaging activity in an in-termediate position. b A selection occurs onto the most foveal stimulus beyond a relative distance of approxi-mately 28 , 31 and 39 (vertical lines), corresponding to the brighter stimulus at ⇢ = 15 in red, ⇢ = 10 and ⇢ = 5 , respectively.
pographical maps (hence similar figures), investi-gating the model predictions on classical issues (le-sioning studies and double target paradigms). Our results are consistent with the absence of spread when using symmetric kernels, however, we were not interested in testing asymmetric kernels in our model for several reasons. First, because it was absent in other studies (Kang and Lee, 2000; Moschovakis et al., 2001) or very moderate ( An-derson et al.,1998), it is possible that the spread of activity results from an experimental artefact. Second, to our knowledge, there is no anatomical data supporting asymmetric connection fields in the SC. Finally,Nakahara et al.(2006) recognized that “if the spread is caused by asymmetric intrin-sic connections, it may be just an epiphenomenon, with no contribution to movement control”.
Fig. 7 Double target paradigm III (salience ef-fect: intensity). Two stimuli having different bright-ness intensities (1.0 and 1.5, respectively) presented at opposite directions ( and , respectively) and shifted eccentricities (0.75⇢ and ⇢, respectively). Colored cir-cles correspond to the position of SC activity center as a function of the relative angular distance between two stimuli (= 2 ) for three different values of ⇢ ( 15 in red, 10 in blue and 5 in green). a When the distance is small, the competition between the two stimuli results in an averaging activity in an intermediate position. b A selection occurs onto one of the two stimuli beyond a relative distance of approximately 38 , 39 and 42 (vertical lines), corresponding to the brighter stimulus at ⇢ = 15 in red, ⇢ = 10 and ⇢ = 5 , respectively. The results show that the bias towards the more foveal stimuli locations could be compensated by increasing the salience of the peripheral target (brightness) (i.e., the competition results on the selection of the stimulus with higher eccentricity).
Moreover, a major difference between our model and theirs is the projection of the stim-uli. As mentioned in the introduction, Nakahara et al. (2006) used the common assumption of log-polar transformation to determine the position of the stimulus center in the SC, using the projection of the stimulus central coordinates in the retinal map, then, gave empirically a shape to the stimu-lus by setting on that position a circle. This means that the transformation of the shape of the stimu-lus by the log-polar function is not directly taken into account, which is a simplification shared with several models. Differently from Nakahara et al. (2006), we propose to project the entire retinal
stimulus onto the collicular map while keeping the symmetric commonly-used lateral kernels. We show in our experiments that after some cycles of computation, the balance between excitation and inhibition makes the initial distorted activ-ity—corresponding to the projection of the stimu-lus—become symmetric. Indeed, a major point of our study is to show that this resulting dynamic “transition" is enough to induce powerful emerging properties.
Stabilization onto a unique and stereotyped pop-ulation In his theoretical study of neural fields, Amari (1977) showed that the neural ensemble evoked by a constant input signal stabilizes onto a unique population of active units with a stereo-typed shape, regardless of the position, the size and the strength of the input. Our simulations replicate this phenomenon: the activity evoked by a retinal stimulus stabilizes on a unique and stereo-typed population in the SC, regardless of the stim-ulus size, luminance and position in the visual field. After the initial excitation from the retina, the lo-cal excitatory connectivity creates a positive feed-back loop, where units activate one another. Two processes contribute to hold this self-sustained ex-citation on a circumscribed population and to pre-vent it from growing and spreading further. First, its magnitude is limited by the saturation intro-duced by the non-linearity in the activation func-tion (implemented in the rectificafunc-tion funcfunc-tion). Second, its lateral spread is limited by the con-stant level of surround inhibition. Regardless of the size and distribution of the initial excitation, the combined effects of the positive feedback loop and the two limiting processes modify the activa-tion profile until the excitaactiva-tion and inhibiactiva-tion bal-ance each other to maintain a stereotyped profile of activation (equilibrium state). The SC has been reported to be the target of endogenous (Lee and Hall,2006;Meredith and Ramoa,1998;Munoz and Istvan,1998;Olivier et al.,1999) as well as exoge-nous inhibitory influences, e.g., from the substan-tia nigra pars reticulata (Chevalier et al., 1985; Hikosaka et al., 1983), the central mesencephalic reticular formation (Wang et al., 2010) and the contralateral SC (Olivier et al.,1998). It is worth-while to mention that, in our model, the ques-tion of the origin and distribuques-tion of the inhibi-tion is not critical, as the same outcome is ob-served, regardless of whether it is homogeneously distributed (isotropic) or follows a Gaussian dis-tribution within the SC. The most critical point is that its spatial extent is sufficient large to hold
the spread of excitation. Indeed, we assumed a con-stant inhibition at the whole population level since there is no clear data concerning extended lateral inhibition in the deep superior colliculus. This in-hibition could result from efferent influences from other structures such as the basal ganglia. How-ever, this question should be critical forNakahara et al. (2006) model, where local or global inhibi-tion requires a particular inhibitory connecinhibi-tions profile within the SC with no clear consensus for its existence. Finally, the observation that the ac-tive population has the same size regardless of the location of the stimulus in the visual field confirms the inferences that were made several decades ago by James McIlwain (McIlwain,1976). Indeed, this neurobiologist demonstrated that the population of SC neurons activated by a point visual stimulus ought to be constant, regardless of its eccentric-ity. This translation invariance was later corrobo-rated by recordings of saccade-related neurons in the monkey SC showing that the size of the ac-tive area is relaac-tively invariant with saccade size and direction (Anderson et al., 1998; Munoz and Wurtz,1995).
Changes in accuracy and latency after local inacti-vation The dynamics described in this study cor-responds to the evolution of the activation onto the SC map, from the initial excitation to its stabiliza-tion. The duration of the activation increases with the distance between both activation states. This distance depends primarily upon two parameters: the number and the size (spatial extent and magni-tude) of the discrete stimuli that feed the SC map. It is also impacted by changes in the activation profile induced by local inactivations. Our results are consistent with the changes in saccade accu-racy observed when a small amount of anesthetics (lidocaine) is injected locally in the SC. Indeed, as shown in Lee et al. (1988) study, figure 2, hy-pometria and hypermetria were observed after in-jecting lidocaine on one side (or the other) of the location corresponding to the target position. We show similar effects in figure Fig. 3-b; hypometria and hypermetria on the either side of the lesion site. Since our model was not designed to gener-ate saccades, our simulations indicgener-ate that this in-accuracy is due to an altered encoding of target location rather than an impaired execution of scades. It is explained by the dynamics of neural ac-tivation that elapses from the initial excitation to its stabilization. The equilibrium state is achieved by a gradual shift of the active population away from the inactivated site. Because the inactivation
alters the symmetry of activation that normally expands from the center of the initial excitation, the symmetry is re-established away from the le-sion, in a more lateral position leading to a change in the topographical encoding of the target loca-tion. Because it is aimed at re-establishing equi-librium between the expanding excitation and the surround inhibition, the shift has amplitude and duration that depend upon the overlap between the initial excitation and the lesion. Even though the size of the active population does not depend upon the stimulus size in normal conditions, after SC inactivation, a stimulus located at the same position in the visual field will be encoded at dif-ferent sites in the SC, depending upon the size of the stimulus. This model prediction, which is consistent with recent observations (Goffart et al., 2012; Hafed et al., 2008), simply results from the fact that different stimulus sizes lead to different initial excitations in the SC. A larger stimulus ini-tially excites a larger population and the overlap between this initial excitation and the inactivated site determines the trajectory of the SC activity, away from the inactivated neurons, in search for its stabilization. This delayed stabilization could also account for the increase of saccade latencies after SC inactivation (Goffart et al.,2012;Hikosaka and Wurtz,1985;Sparks et al.,1990).
The response fields of SC neurons The logarithmic projection explains why the response fields of more caudal neurons in the SC have larger width and become more asymmetrical. These properties fit well with the movement field properties described by electrophysiological studies (Munoz and Wurtz, 1995; Sparks et al., 1976). Indeed, the saccade-related neurons in the SC burst maximally prior to saccades having a particular direction and ampli-tude, regardless of the starting position of the eye in the orbit and their resulting tunings are very similar to those resulting from our model (e.g., compare our Fig. 2 with the figure 8 in (Munoz and Wurtz,1995)). The discharge then declines for other vectors (Schiller and Stryker, 1972; Sparks and Mays, 1980; Sparks et al., 1976; Wurtz and Goldberg, 1972). Interestingly, our model shows how the maximum firing rate declines with the rostro-caudal position of the neuron on the SC map (cf. Fig.2).
Target selection during image exploration Several studies described the path of saccades generated by subjects exploring various visual images ( Lévy-Schoen, 1974; Noton and Stark, 1971; Yarbus,
1967). They showed that the attractive value of an object strongly depends upon its distance relative to the previously fixated object. This attraction is greater for objects close to the fovea (small sac-cades are more frequent). Such scanpaths do not necessarily rely upon cognitive strategies since our model produces the same performance when its vi-sual input contains multiple identical objects. Be-cause of the log-polar transformation, two visual stimuli of similar size initially activate two popu-lations with sizes that depend on their eccentricity: larger populations are activated when the stim-ulus is projected near the central region than in more peripheral regions (cf. Fig.5). The more ros-tral population wins the competition because of its larger initial size (cf. Fig.6). The same mechanism can account for the so-called remote distractor ef-fect first reported by (Lévy-Schoen, 1969). When two identical stimuli are simultaneously presented at two different locations, human subjects (Walker et al.,1997) or monkeys (Dorris et al.,2007) favor the stimulus which is closer to the fovea and take a longer time to select this target. Our study shows that the selection simply results from the combined effect of pattern of activity (central excitation sur-rounded by inhibition) and from the geometrical representation of the visual field within a SC map (magnification of the foveal field).
Temporal dynamics during the competition Using a variety of testing conditions (different target lo-cations, different inter-stimulus intervals), several studies reported increases in saccade latency that were interpreted as resulting from a selection pro-cess (Findlay, 1983; Godijn and Theeuwes, 2002; Honda, 2005; Weber and Fischer,1994). We have discussed above the case where the stimuli were presented at different eccentricities. A more subtle case happens when the two stimuli have the same eccentricity but different elevations. Initially, they activate the same number of units (cf. Fig.5A,C). However, during a first phase that follows the stim-uli presentation, the two corresponding locations in the SC are eligible for selection. Then, the two populations ultimately stabilize onto one single population whose location depends upon the an-gular distance between the stimuli. If the stimuli are spatially close (cf. Fig. 5A), i.e., if the ini-tial excitations overlap, the two populations merge and stabilize at a site that encodes a location cor-responding to the center of mass of the stimuli. Note that this averaging process could also apply to multiple stimuli. Such a merging phenomenon could account for the so-called global effect
ob-served in saccades made in response to multiple stimuli and distractors (Coren and Hoenig, 1972; Deubel et al., 1984; Findlay, 1982; Ottes et al., 1984;Van der Stigchel et al.,2011). If the two stim-uli activate populations in the SC that are sepa-rated by a fringe of mutual inhibition (cf. Fig.5B), the bipolar state could theoretically last forever if the activities were perfectly noiseless and the population is initially inactive. However, the noise added at the level of the visual input introduces fluctuations that break the symmetry and lead to the selection of a single population.
Conclusion The work presented here demon-strates that many properties of the SC activity and the oculomotor behavior can result from the geometry of the retinotopy and the pattern of SC activation (excitation surrounded by inhibition). Our model represents a solid base for investigating further the influence of each afferent input to this brainstem region. It also relies on a small number of free parameters (see Table 1.) which, exception made of the time step of numerical simulations, have a clear biological meaning. This opens many perspectives easy to implement. Firstly, the free parameters can be adapted to fit with neurobiolog-ical observations such as the size of receptive fields, the dynamics of SC activation, etc. Secondly, they can also be adapted to fit with behavioral observa-tions or, for a given set of parameters (e.g., map-ping functions, levels of inhibition, expanded le-sion, visual stimuli of different sizes etc.), to make predictions on the behavioral performance in dif-ferent species or in patients with different kind of scotoma. These free parameters can be estimated from an optimization process, or be varied sys-tematically, through massive numerical tests. In conclusion, our work shows that behavioral per-formances that seem complex can result from very simple anatomo-functional principles. It also illus-trates the catalytic influence of noise and fluctua-tions in the irreversible determination of the equi-librium that will encode the location of a target to foveate (Goffart et al.,2012;Hafed et al.,2008;Lee et al., 1988) or to attend to (Zénon and Krauzlis, 2012).
References
Amari S (1977) Dynamics of pattern formation in lateral-inhibition type neural fields. Biological Cybernetics 27(2):77–87
Anderson RW, Keller EL, Gandhi NJ, Das S (1998) Two-dimensional saccade-related popu-lation activity in superior colliculus in monkey. Journal of Neurophysiology 80(2):798–817 Arai K, Keller EL (2005) A model of the
saccade-generating system that accounts for trajectory variations produced by competing visual stimuli. Biological Cybernetics 92(1):21–37
Arai K, Keller EL, Edelman JA (1994) Two-dimensional neural networks model of the pri-mate saccadis system. Neural Networks 7(6– 7):1115–1135
Badler JB, Keller EL (2002) Decoding of a mo-tor command vecmo-tor from distributed activ-ity in superior colliculus. Biological Cybernetics 86(3):179–189
Chevalier G, Vacher S, Deniau JM, Des-ban M (1985) Disinhibition as a basic pro-cess in the expression of striatal func-tions. i. the striato-nigral influence on tecto-spinal/tecto-diencephalic neurons. Brain Re-search 334(2):215–226
Coren S, Hoenig P (1972) Effect of non-target stimuli on the length of voluntary saccades. Per-ceptual and Motor Skills 34:499–508
Cowey A, Rolls ET (1974) Human cortical magni-fication factor and its relation to visual acuity. Experimental Brain Research 21(5):447–454 Daniel PM, Whitteridge D (1961) The
representa-tion of the visual field on the cerebral cortex in monkeys. The Journal of Physiology 159(2):203– 221
Deubel H, Wolf W, Hauske G (1984) The evalua-tion of the oculomotor error signal. In: Gale A, Johnson F (eds) Theoretical and applied aspects of eye movement research, Elsevier, pp 55–62 Dorris MC, Olivier E, Munoz DP (2007)
Compet-itive integration of visual and preparatory sig-nals in the superior colliculus during saccadic programming. Journal of Neuroscience 27:5053– 5062
Droulez J, Berthoz A (1991) A neural network model of sensoritopic maps with predictive short memory properties. Proceedings of the National Academy of Sciences 88(21):9653–9657
Findlay JM (1982) Global visual processing for saccadic eye movements. Vision Research Findlay JM (1983) Visual information for saccadic
eye movements. In: Hein A, Jeannerod M (eds) Spatially oriented behavior, Springer Verlag Freedman EG, Sparks DL (1997) Activity of cells
in the deeper layers of the superior colliculus of the rhesus monkey: evidence for a gaze
dis-placement command. Journal of Neurophysiol-ogy 78(3):1669–1690
Gancarz G, Grossberg S (1999) A neural model of saccadic eye movement control ex-plains task-specific adaptation. Vision Research 39(18):3123–3143
Gandhi NJ, Katnani HA (2011) Motor functions of the superior colliculus. Annual Review of Neu-roscience 34:205–231
Godijn R, Theeuwes J (2002) Programming of en-dogenous and exogenous saccades: Evidence for a competitive integration model. Journal of Ex-perimental Psychology 28(5):1038–1054
Goffart L, Hafed ZM, Krauzlis RJ (2012) Visual fixation as equilibrium: Evidence from superior colliculus inactivation. Journal of Neuroscience 32(31):10,627–10,636
Goossens HHLM, Van Opstal AJ (2006) Dynamic ensemble coding of saccades in the monkey su-perior colliculus. Journal of Neurophysiology 95(4):2326–2341
Hafed ZM, Krauzlis RJ (2008) Goal representa-tions dominate superior colliculus activity dur-ing extrafoveal trackdur-ing. Journal of Neuroscience 28(38):9426–9439
Hafed ZM, Goffart L, Krauzlis RJ (2008) Supe-rior colliculus inactivation causes stable offsets in eye position during tracking. Journal of Neu-roscience 28(32):8124–8137
Hahnloser RHR, Seung HS, Slotine JJ (2003) Permitted and forbidden sets in symmetric threshold-linear networks. Neural Computation 15(3):621–638
Hikosaka O, Wurtz RH (1985) Modification of saccadic eye movements by gaba-related sub-stances. i. effect of muscimol and bicuculline in monkey superior colliculus. Journal of Neuro-physiology 53(1):266–291
Hikosaka O, Wurtz RH, et al. (1983) Visual and oculomotor functions of monkey substantia gra pars reticulata. iv. relation of substantia ni-gra to superior colliculus. Journal of Neurophys-iology 49(5):1285–1301
Honda H (2005) The remote distractor effect of saccade latencies in fixation-offset and overlap conditions. Vision Research 45(21):2773—2779 Johnston A (1986) A spatial property of the
retino-cortical mapping. Spatial Vision 1(4):319–331 Kang I, Lee C (2000) Properties of saccade-related
neurons in the cat superior colliculus: patterns of movement fields and discharge timing. Exper-imental brain research 131(2):149–164
Lee C, Rohrer WH, Sparks DL (1988) Population coding of saccadic eye movements by neurons in the superior colliculus. Nature 332(6162):357– 360
Lee P, Hall WC (2006) An in vitro study of hor-izontal connections in the intermediate layer of the superior colliculus. Journal of Neuroscience 26:4763–4768
Lefèvre P, Galiana HL (1992) Dynamic feedback to the superior colliculus in a neural network model of the gaze control system. Neural Net-works 5:871–890
Lefèvre P, Quaia C, Optican LM (1998) Dis-tributed model of control of saccades by supe-rior colliculus and cerebellum. Neural Networks 11(7–8):1175–1190
Lévy-Schoen A (1969) Détermination et latence de la réponse oculo-motrice à deux stimulus simul-tanés ou successifs selon leur excentricité rela-tive. L’Année Psychologique 69(2):373–392 Lévy-Schoen A (1974) Le champ d’activité du
regard: données expérimentales. L’Année Psy-chologique 74:43–65
Marino RA, Rodgers CK, Levy R, Munoz DP (2008) Spatial relationships of visuomotor trans-formations in the superior colliculus map. Jour-nal of Neurophysiology 100(5):2564–2576 Marino RA, Trappenberg TP, Dorris M, Munoz
DP (2012) Spatial interactions in the superior colliculus predict saccade behavior in a neural field model. Journal of Cognitive Neuroscience 24(2):315–336
McIlwain JT (1976) Large receptive fields and spa-tial transformations in the visual system. Inter-national Review of Physiology 10:223–248 Meredith MA, Ramoa AS (1998) Intrinsic circuitry
of the superior colliculus: pharmacophysiolog-ical identification of horizontally oriented in-hibitory interneurons. Journal of Neurophysiol-ogy 79(3):1597–1602
Moschovakis A, Gregoriou G, Savaki H (2001) Functional imaging of the primate superior col-liculus during saccades to visual targets. Nature Neuroscience 4(10):1026–1031
Munoz DP, Istvan PJ (1998) Lateral inhibitory in-teractions in the intermediate layers of the mon-key superior colliculus. Journal of Neurophysiol-ogy 79:1193–1209
Munoz DP, Wurtz RH (1995) Saccade-related ac-tivity in monkey superior colliculus. i. charac-teristics of burst and buildup cells. Journal of Neurophysiology 73:2313–2333
Nakahara H, Morita K, Wurtz RH, Optican LM (2006) Saccade-related spread of activity across superior colliculus may arise from asymmetry of internal connections. Journal of Neurophysiol-ogy 96(2):765–777
Noton D, Stark L (1971) Scanpaths in eye movements during pattern perception. Science 171:308–311
Olivier E, Porter JD, May PJ (1998) Comparison of the distribution and somatodendritic mor-phology of tectotectal neurons in the cat and monkey. Visual Neuroscience 15(5):903–922 Olivier E, Dorris MC, Munoz DP (1999) Lateral
interactions in the superior colliculus, not an ex-tended fixation zone, can account for the remote distractor effect. Behavioral and Brain Sciences 22(4):694–695
Optican LM (1995) A field theory of saccade generation: Temporal-to-spatial transform in the superior colliculus. Vision Research 35(23– 24):3313–3320
Ottes FP, van Gisbergen JAM, Eggermont JJ (1984) Metrics of saccade responses to visual double stimuli: two different modes. Vision Re-search 24(10):1169–1179
Ottes FP, van Gisbergen JAM, Eggermont JJ (1986) Visuomotor fields of the superior col-liculus: a quantitative model. Vision Research 26(6):857–873
Robinson DA (1972) Eye movements evoked by collicular stimulation in the alert monkey. Vision Research 12(11):1795–1808
Rougier N, Vitay J (2006) Emergence of atten-tion within a neural populaatten-tion. Neural Net-works 19(5):573–581
Salinas E, Abbott LF (1996) A model of mul-tiplicative neural responses in parietal cortex. Proceedings of the National Academy of Sci-ences 93(21):11,956–11,961
Schiller PH, Stryker M (1972) Single-unit record-ing and stimulation in superior colliculus of the alert rhesus monkey. Journal of Neurophysiology 35(6):915–924
Schneider S, Erlhagen W (2002) A neural field model for saccade planning in the superior col-liculus: speed-accuracy tradeoff in the double-target paradigm. Neurocomputing 44–46:623– 628
Short SJ, Enderle JD (2001) A model of the inter-nal control system within the superior colliculus. Biomedical Sciences Instrumentation 37:349– 354
Sparks DL, Mays LE (1980) Movement fields of saccade-related burst neurons in the monkey su-perior colliculus. Brain Research 190:39–50 Sparks DL, Holland R, Guthrie BL (1976) Size and
distribution of movement fields in the monkey superior colliculus. Brain Research 113(1):21–34 Sparks DL, Lee C, Rohrer WH (1990) Population coding of the direction, amplitude, and velocity of saccadic eye movements by neurons in the su-perior colliculus. Cold Spring Harbor symposia on quantitative biology 55:805–811
Van der Stigchel S, de Vries JP, Bethlehem R, Theeuwes J (2011) A global effect of capture sac-cades. Experimental Brain Research 210(1):57– 65
Taylor JG (1999) Neural bubble dynamics in two dimensions: foundations. Biological Cybernetics 80:393–409
Trappenberg TP, Dorris MC, Munoz DP, Klein RM (2001) A model of saccade initiation based on the competitive integration of exogenous and endogenous signals in the superior colliculus. Journal of Cognitive Neuroscience 13(2):256– 271
Walker R, Deubel H, Schneider WX, Findlay J (1997) Effect of remote distractors on saccade programming: evidence for an extended fixation zone. Journal of Neurophysiology 78:1108–1119 Wang N, Warren S, May PJ (2010) The macaque midbrain reticular formation sends side-specific feedback to the superior colliculus. Experimen-tal Brain Research 201(4):701–717
Weber H, Fischer B (1994) Differential effects of non-target stimuli on the occurrence of express saccades in man. Vision Research 34(14) Wilson HR, Cowan JD (1973) A mathematical
the-ory of the functional dynamics of cortical and thalamic nervous tissue. Biological Cybernetics 13(2):55–80
Wurtz RH, Goldberg ME (1972) Activity of supe-rior colliculus in behaving monkey. iii. cells dis-charging before eye movements. Journal of Neu-rophysiology 35(4):575–586
Yarbus AL (1967) Eye movements and vision Zénon A, Krauzlis RJ (2012) Attention deficits
without cortical neuronal deficits. Nature 489(7416):434–437