Complex Lipids in Microbial Mats and Stromatolites of Hamelin
Pool, Shark Bay, Australia
by
Elise McKenna Myers
Submitted to the Department of Earth, Atmospheric, and Planetary Sciences in Partial Fulfillment of the Requirements for the Degree of
Bachelor of Science in Earth, Atmospheric, and Planetary Sciences at the
MASSACHUSETTS INSTITUTE OF TECHNOLOGY
May 2014
Elise M. Myers 2014. All rights reserved
The author hereby grants to MIT permission to reproduce and to distribute publicly paper and electronic copies of this thesis document in whole or in part
in any medium now known or hereafter created.
Signature of Author
(Signature redacted-. ..
Certified by ... ...
Department of Earth, Atmosp4 ric, and Planetary Sciences
May 19, 2014
Signature redacted
\13
...
Roger Summons
Professor of Geobiology
Signature redacted
ThesisSupervisor
Accepted by ... ...
ARCHIVES
MASS C USETTS INSTITUTEOF ECHNOLOGY
SEP 28 Z01
...
Richard P. Binzel
Chair, Committee on Undergraduate Program
Abstract
Stromatolites, columnar rock-like structures, are potentially some of the oldest, microbially mediated fossils visible in the rock record; if biogenesis is able to be confirmed for these ancient stromatolites, some being greater than 3 billion years old, these ancient stromatolites could be used to demonstrate the microbial community assemblages throughout ancient time. Hamelin Pool, Shark Bay, Australia is an ideal field site for this task, as stromtolites and modern microbial mats coexist and the microbial mats have been shown to contribute to the formation of the stromatolites. Comprehensive lipid biomarker profiles were determined in this study for non-lithified smooth, pustular, and colloform microbial mats, as well as for smooth and colloform stromatolites. Intact polar lipids, glycerol dialkyl glycerol tetraethers, and bacteriohopanepolyols were analyzed via liquid chromatography-mass spectrometry
(LC-MS) coupled to a Quadropole Time-of-Flight (QTOF) mass spectrometer, while the
previously studied fatty acids (Allen et al., 2010) were analyzed using gas chromatography-mass spectrometry (GC-MS) to prove consistent signatures. From the lipid profiles, sulfate-reducing bacteria and anoxygenic phototrophic bacteria and archaea could be inferred. The presence of the rare 3-methylhopanoids was discovered in a significant portion of the samples, which could add to the characterization of this molecule, which has only been concretely linked to oxygenic conditions for formation. In accordance with Allen et al. in 2010, 2-methyhopanoids were detected, as well as limited signals from higher (vascular) plants. While the lipid profiles for all sediment types were similar, there were some differences that are likely attributable to morphological differences. However, the overall similarities suggest microbial communities can be similar between non-lithified microbial mats and stromatolites.
Acknowledgements
I would like to thank the members of the Summons Lab who have been
immensely helpful during this research project. My thanks are particularly compound specific: to Florence Schubotz for her help on IPLs and GDGTs, to Emily Matys and Julio Sepulveda for their help on BHPs, and to Roger Summons for his help on FAMEs. I am very grateful to Roger Summons for this opportunity to work in his lab and also to become a part of the Geology-Geochemistry-Geobiology groups. I would also like to thank both Lesly Adkins-Shellie and Carolyn Colonero who helped to get me whatever I needed, from specific software to my lab keys. I would like to give a special thank you to Florence Schubotz for her help in editing even while being in a different time zone and also for her patience in lab when much of what I said was a question beginning with "hey Flo..."
I would also like to thank all of my friends and family who have been supportive
throughout the past year of this research and the past four years at MIT; there are way too many people to name, but I am so grateful to have you all in my life. Particularly,
I'd like to thank my grandmothers Edna and Miss Marilyn for your unending love and
support throughout my 4 years here, Reisterstown United Methodist Church for its perfectly timed care packages, and to my best friends Margo, Helen, and Jamal who have always been by my side. Very special thanks go to Coach Valerie Handy who convinced me to come to MIT in the first place, to my mother/best friend whose love and support have been able to keep me here, and to my grandfather who never knew that our conundrums over breakfast and other puzzles would lead me to a career in science.
Contents
Abstract Acknowledgements ii List of Figures v List of Tables vi 1 Introduction 11.1 Microbial Mats and Stromatolites 1
1.2 Membrane Lipid Analysis 2
1.2.a Intact Polar Lipids (IPLs) 2
1.2.b Glycerol Dialkyl Glycerol Tetraethers (GDGTs) 3
1.2.c Bacteriohopanepolyols (BHPs) 4
1.2.d Fatty Acid Methyl Esters (FAMEs) 7 1.3 Combining Characteristic Lipid Profiles 7
2 Materials and Methods 9
2.1 Sample Description 9
2.2 Total Lipid Extraction and Preparation of Lipid Fractions 10
2.2.a Extraction and Basic Preparation of Lipid Fractions 10
2.2.b Derivatization 12
2.3 IPLs Preparation and HPLC-MS Analysis 12
2.4 FAMEs and Hydrocarbon GC-MS Analysis 13
2.5 GDGTs Preparation and HPLC-QTOF-MS Analysis 14
2.6 BHP HPLC-QTOF-APCI Analysis 15
3 Results and Discussion 17
3.1 Quantifying Results 17
3.1.b Quantification of Data 17
3.2 Intact Polar Lipids 19
3.2.a Results 19
3.2.b Data Validation Efforts 22
3.3 Fatty Acid Methyl Esters 22
3.4 Glycerol Dialkyl Glycerols and Glyco-Glycerol Dialkyl Glycerols 25
3.4.a Initial Run - Relative Abundance Only 25
3.4.b Secondary Run - Relative Abundance 27
3.4.c Secondary Run - Quantitative Results 30
3.4.d Interpreting the Combined Results 31
3.5 Bacteriohopanepolyols 35
3.5.a Quantifying Data and Validating the Instrument 35
3.5.b Major BHP Signals 37
3.5.c Other BHP Signals 40
4 Conclusions 41
4.1 Overall Significance of These Characteristic Lipid Profiles 41
4.2 Future Work 42
Bibliography 44
Appendices 51
Appendix A - Additional Data 51
List of Figures
1.1 Bacteriohopanepolyol Characteristic Fragmentation... ... 6
1.1 FAMEs Characteristic Fragmentation ... ... 7
2.1 Diagram of Extraction and Analysis Procedures... ... 12
3.1 H eat M ap of Intact Polar Lipids ... ... 19-20 3.2 FA M E Chrom atogram s... ... 23
3.3 All GDGTs Relative Abundance (1st Round)... ... 26
3.4 All GDGTs Relative Abundance (2nd Round)... ... 27-28 3.5 GDGT Relative Abundance of Layered Sections (Both Rounds)...29
3.6 All GDGTs Normalized Abundances... ... 31
3.7 Quantifying BHPs with Extracted Ion Chromatograms... ... 36
3.8 Normalized BHP Abundance By Weight... ... 38
Hydrogen and Ammonium Adducts of Core and Glyco- GDGTs ... 4 Characteristic Masses (m/z) of Various Bacteriohopanepolyols ... 6
List of Tables
1.1
Chapter 1
Introduction
1.1 Microbial Mats and Stromatolites of Hamelin Pool
The Shark Bay World Heritage Site is a 1220 km2 bay located on the westernmost point of Australia, about 800 kilometers north of Perth, Australia. This "U" shaped bay features sheltered waters of about 9 meters depth that tend toward hypersalinity partially due to the high evaporation rates and the lack of substantial contact with fresh water run-off, rainfall, or lower salinity ocean water. Hamelin Pool, the location of the samples studied in this report, is one of the most saline parts of Shark Bay.These areas of hypersalinity are home to characteristic, rock-like structures called stromatolites which, in conjunction with microbial mats, comprise some of the best modern analogs to ancient stromatolite microbial communities, some of the earliest forms of life detectable in the rock record. Hypersalinity prevents the survival of many predators and competitors, which allows for microbes to create these stromatolite structures, which had been the only macroscopic evidence of life until about 500 million years ago. Stromatolites more than 3 billion years old have been found both in Western Australia and South Africa, which offers a glimpse of these ancient life forms; however, the information preserved in these fossils is limited (Lowe, 1980; Byerly et al., 1986). These formations are often defined as microbial organo-sedimentary deposits with planar to sub-planar laminated internal macro-fabrics of benthic origin (Jahnert & Collins, 2012; Kalkowsky 1908).
Microbial mats are the other highly studied microbial feature of Hamelin Pool, which, like stromatolites, have highly distinct morphologies (smooth, colloform, pustular, and tufted) and varying microbial communities. Grown on moist or submerged surfaces, microbial mats are held together by microbially excreted slimy substances or by tangled filaments, depending on the mat type.
microorganisms, the community variation in microbial mats is sometimes compartmentalized. The bacteria and archaea of these mats, while being generally related, occupy different regions of the multiple centimeters thick mat, which are different chemical environments.
Both stromatolites and microbial mats in Hamelin Pool have been intensely studied in the hopes of better understanding their different microbial communities and overall formation. Many arguments have been made linking these microbialites, including one where the coccoid cyanobacteria Enotphysalis major was described as responsible for both brown, gelatinous, pustular mats and columnar structures, like stromatolites, by causing vertical excretion of cells (Golubic 2000). By definition, biotic stromatolites are considered to have been formed through calcium carbonate precipitation of microbial mats, so the two general groups can be likened to one another when comparing the microbial compositions and other potential chemical features, such as membrane lipids.
1.2 Membrane Lipid Analysis
Within stromatolites in Hamelin Pool, degradation products of certain lipids are preserved, and, because of the growing acceptance of the production of the oldest stromatolites of Western Australia being biogenic (Allwood et al. 2006), these lipids can be used as biomarkers. These ancient lipids can then be correlated with lipids forming in modern microbial systems, such as the various membrane lipids examined in this study. The structure of the membranes varies among different microbes in order to protect the internal environment of the microorgansims from external environmental factors, such as pH or temperature. This need to protect the inner cell has driven high diversity in the lipid structures of biological membranes, as the membrane structure must be adaptable and flexible, depending on the external circumstances (Dowhan and Bogdanov 2002). Because of this ability to adapt, membrane lipids are particularly interesting to study to see how organisms can adapt to different environments over time. Examining direct analogues to ancient life forms also provides a look at the potential structure of ancient membrane lipids, as well as a look at current membrane lipids.
1.2.a Intact Polar Lipids (IPLs)
Lipids and their relative distributions in microbial communities can serve as valuable characteristic fingerprints of microbiological diversity. Lipids, such as phospholipid fatty acids, have been used previously to elucidate the composition and quantity of
viable biomass in modern microbial ecosystems (White et al., 1997), as well as to indicate the presence of their respective source organisms. Yet, this interpretation is limited because these lipids, including membrane phospholipid fatty acids, quickly degrade as a result of post-mortem processes. In particular, intact polar lipids (IPLs), diacylglycerophospho- or glycolipids that have a polar head group with various structural moieties, like carboxylic acid, trimethylamine, or saccharides, quickly lose their polar head group within hours or days of cell death (White et al. 1979; Moodley et al., 2000), thus making these lipids useful for the detection of living microbes.
1.2.b Glycerol Dialkyl Glycerol Tetraethers (GDGTs)
Degradation products from some of the lipids that lose their polar head groups, particularly core Glycerol Dialkyl Glycerol Tetraethers (GDGTs), can be used as more recalcitrant biomarker lipids, being preserved in immature sediments for <140 Ma (Schouten et al., 2013). Distributions of these overall more persistent lipids can be used as proxies for dynamic environmental parameters, such as soil pH (Weijers et al., 2007) or input of soil organic matter to marine environments (Hopmans et al., 2004). The presence of some of these lipids is also partially indicative of their microbial origin, such as isoprenoid GDGT-0, which is the most commonly occurring GDGT in cultivated archaea (Macalady et al., 2004). Generally speaking, the most abundant archaeol lipids are these membrane-spanning GDGTs with monoglycosyl (1G), diglycosyl (2G), or triglycosyl (3G), while trace amounts of tetraglycosyl (4G) are insignificant to the overall composition, so are often disregarded in analysis, as in this study (see Appendix B-1 and B-2 for structures). However, the original view that GDGTs were mainly synthesized by archaea was challenged through environmental samples that show the structural diversity and the diversity of sources are significant (Schouten et al., 2013). Despite the benefit of the Core GDGTs being preserved more extensively than its intact form
(G-GDGT), some information is lost by not having the polar head groups, which, with their
specific structural elements, can be correlated to specific organisms.
Distinct GDGTs are identified using compound separation by High Performance Liquid Chromatography (HPLC) coupled to a quadrupole time of flight mass spectrometer (Agilent Technologies) that scans for compounds in a particular mass range and then performs MS/MS scans. Previously determined diagnostic fragments, such as those described in Sturt et al. 2004, are then used in conjunction with the retention times and accurate masses of the GDGT molecules. GDGTs can form different adducts during
ionization, such as hydrogen or ammonium adducts, influencing the exact mass that need to be extracted for quantification.
Table 1.1: Hydrogen and Ammonium Adducts of Core and Glyco- GDGTs
Core-GDGT H+ion NH4+ ion G-GDGT H+ ion NH4+
ion
GDGT-0 1302 1319 G-GDGT-0 1481.40 1643 3227 3492 4549 GDGT-1 1300 1317 G-GDGT-1 1479 1641 3070 3336 3864 4392 GDGT-2 1298 1315 G-GDGT-2 1477 1621 2914 3179 3707 3897 GDGT-3 1296 1313 G-GDGT-3 1475 1637 2757 3023 3551 4079 Crenarchaeol 1292 1309 G-Crenarchaeol 1471 1615 2444 2710 3238 3428
The masses for specific core GDGTs and G-GDGTs are displayed in this table. Data analyzing software was used to isolate each lipid by this molecular mass and then integrate the extracted ion chromatogram created for the compounds at that given mass.
1.2.c Bacteriohopanepolyols (BHPs)
Similarly recalcitrant to core GDGTs are bacteriohopanepolyols (BHPs), a class of complex lipids that is one of the primary lipids synthesized by cyanobacteria (Jahnke et
al. 2004). BHPs are recalcitrant due to their carbon skeleton's resistance to abiotic thermal or pressure degradation (Brocks et al. 2005). As discussed in Ricci et al. 2013, the diagenetic remains of hopanoids and steroids, hopanes and steranes, are valuable biomarkers, since they can be interpreted as the remains of the membrane polycyclic triterpenoids of modern organisms (Rohmer et al., 1984; Ourisson et al. 1987).
BHPs have not been definitively linked to a particular function and not all of them are specific to certain organisms, yet some interpretations can be made, based on previous studies. It has been suggested that BHPs may have functions relating to structural membrane integrity (e.g. Poralla et al. 1984; Horbarch et al., 1991), or even play a role in preventing cell dessication and overall loss of water (Poralla et al. 2000) or in serving as a barrier to oxygen for nitrogen-fixing bacteria (Berry et al., 1993), yet all of these theories have been challenged by subsequent studies (Seipke & Loria, 2009). One still prevailing theory is that hopanoids may reduce membrane permeability to protons, thereby protecting the organisms from extreme pH conditions (Welander et al., 2009). As evidenced by these varying proposed roles, it is important to further study BHPs to gain
a better sense of their ecological and physiological significance due to their ubiquitous presence in soil and sedimentary environments.
Despite the incongruent theories of the functional role of hopanoids, some connections to bacterial communities can be made by utilizing the highly specific chemical structure of BHPs (see Appendix B-3 and B-4) that have been well elucidated (Sessions et al., 2013). For example, BHPs have been correlated to different bacterial communities, like marine and non-marine cyanobacteria that produce C35 hopanoids methylated at C-2 in the pentacyclic ring system (Allen et al., 2010; Summons et al., 1999), despite this biosynthetic capability possibly being more widespread (Welander et al., 2010). Within cyanobacterial structures, there have been 25 distinct BHP side-chain structures detected, with certain ones being found exclusively in a particular cyanobacteria, like 35-O-P-3,5-anhydro-galacturonopyranosyl BHP and its 2-methyl homologue in Prochlorothrix hollandica (Talbot et al. 2008).
Previously, 2-methylhopanoids were considered to be biomarkers of cyanobacteria (Summons et al., 1999); however, it was demonstrated that cyanobacteria are not the only group of bacteria that are able to produce significant amounts of 2-methylhopanoids (Rashby et al., 2007). With this discovery, it became imperative that more data be collected about the modem day function and distribution of 2-Methyl BHPs in order to better understand what organisms and what environmental conditions would have
resulted in their production in ancient sediments. Shark Bay stromatolites and microbial mats are particularly useful in this task, as the ancient sediments with 2Me-BHP signatures were likely similar to stromatolites: existing in shallow water and supporting growing, abundant bacterial communities.
In previous studies, it was determined that the majority of 2-Me BHPs produced in smooth and pustular microbial mats in Hamelin Pool, Shark Bay originate from cyanobacteria, with the other 2-Me BHP producing microorganism constituting a much smaller portion of the bacterial communities (Garby et al., 2012). Despite recent research into 2-Me BHPs in Shark Bay, overall, the vast majority of cyanobacteria screened for hopanoid production are associated with freshwater environments, which makes studies to characterize BHPs found in marine environments highly important. Extracting and analyzing the BHPs found in the microbes that comprise the microbial mats and stromatolites of Hamelin Pool, as done in this study, is then an important exercise in exploring the diversity of BHPs in marine cyanobacteria and other marine organisms.
Determination of particular BHPs was accomplished through scanning for the exact masses of specific BHP molecules among other compounds. The most abundant peaks corresponding to the molecules selected at specific masses were then subjected to additional fragmentation in order to determine the mass spectra for the compounds. Examining the resultant mass spectra could confirm a BHP if it demonstrates the characteristic fragmentations, m/z 191 or m/z 205 for the methylated version, which correspond to the breaking of the C ring (Figure 1.1).
E
R1
R2
R2
D
Via pathway [i] -0A
B
-R3
R31,
Figure 1.1 Bacteriohopanepolyol Characteristic Fragmentation
To the left is a bacteriohopanepolyol (BHP) molecule, showing the characteristic fragmentation site. The resultant fragment is on the right. For the fragmentation:
If R2 = R3 = H, then the fragment is m/z 191 If R2 or R3 = CH3, then the fragment is m/z 205
Two different pathways offragmentation are noted because, if broken off via pathway [i], the positive charge will stay on ring B. Analysis of BHPs relies on a positive ion
fragment
to quantify that fragment.Table 1.2 Characteristic Masses (m/z) of Various Bacteriohopanepolyols
Adenosylhopane BHT BHT-II 2-Me BHT 3-Me BHT Unsat. Amintriol
611.47 655.49 655 669.51 669.51 712
BHPentol Unsaturated Aminotetrol Aminopentol 3-Me Cyclitol
Aminotetrol
I Aminopentol 1713 746 722.54 830.54 844.56 1002.62
The characteristic masses of different BHPs are isolated for analysis through a programmed method for a High Performance-Liquid Chromatography (HPLC) Instrument. The integrated extracted ion chromatogram from this mass is then used to determine the amount of each specific hopanoid.
1.2.d Fatty Acid Methyl Esters (FAMEs)
To relate the results of this study to previous studies on microbialites in Hamelin Pool
(e.g. Allen et al., 2010), fatty acid methyl esters (FAMEs) were also isolated and analyzed.
The original fatty acids of different microorganisms are able to be treated with methylated HCl to convert them into Fatty Acid Methyl Esters (FAMEs), compounds that are more stable and easier to analyze via GC-MS. Analysis of individual FAMEs and their characteristic distribution within samples can be utilized as biomarkers for different groups of organisms in environmental samples. These lipids have been extensively studied, particularly in Hamelin Pool which has dominated FAME profiles of 16:0, 16:1o7 and 18:1o9 (Allen et al. 2010). These signatures correlate well with FAME profiles of cultured cyanobacteria (Kenyon, 1972; Cohen et al., 1995), which suggests a dominance of cyanobacteria in the samples, a theory that is supported by microcscopic observation (Allen et al. 2010). Also noted in previous studies of these samples was the possible presence of signature lipids 10Me16:0 and il7:o7 that indicate sulfate reducing bacteria (Orphan et al. 2001; Londry et al. 2004).
FAMEs are best identified by the characteristic 74 Da McLafferty rearrangement ion that is one of the most readily occurring fragmentations. Other characteristic fragments for FAMEs were also used, including m/z 55, 87, and 101, among others; another defining characteristic is an m/z 21 loss from the molecular ion, which corresponds to the loss of a methoxyl group, thus confirming the compound as a methyl ester.
CH
3
00C
RO
m/z= 74
Figure 1.1 FAMEs Characteristic Fragmentation
The McLafferty rearrangement ion readily occurs as a molecular fragment of FAMEs.
1.3 Combining Characteristic Lipid Profiles
Within this study, I extracted, prepared, and analyzed each of the aforementioned lipids in order to create the most complete picture of microbial communities and their
corresponding lipids for the microbial mats and stromatolites of Hamelin Pool, Shark Bay. Analyzing this suite of lipids will also provide evidence of the distribution of different types of lipids in this hypersaline environment, which could potentially be used for identifying the presence of these types of marine microbes in other environments. As evidenced in the discussion of these lipid types, there is much uncertainty about the definitive correlations of particular lipid structures to certain types of microbes, environments, or functions, so correlations of the lipids determined through this study could be used in enhancing the characterization of lipids, particularly the relatively unknown BHPs.
Analysis of these lipids is also complementary, in terms of understanding currently living organisms, as well as those that lived millions of years ago. With the more transient lipids, IPLs, characterization of the organisms living within the microbial mats and stromatolites sampled is possible, which strengthens our understanding of the microbial communities and their overall growth in this location. For this study, a more complete view of the current biological diversity was pursued by examining the IPLs in conjunction with GDGTs. Supplementing the analysis of these lipids with analysis of more recalcitrant lipids then allows for comparison of beyond the current microbial communities. Recalcitrant lipids from these samples, like the BHPs studied here, allow for comparison to the recalcitrant lipid profiles of other samples, such as some ancient stromatolites that have not been determined as biotic or abiotic. This could then result in either evidence to support or contradict the biogenic origins of some of these ancient stromatolites.
Chapter 2
Materials and Methods
2.1 Sample Description
Samples of various microbial mats and stromatolites from Hamelin Pool in Western Australia were collected during summer field season with a vertical interval of about 5cm from June 14th, 15th, and 17th of 2011. The samples collected were from distinct
morphological communities: pustular, smooth, and colloform. For three multiples of different smooth microbial mat samples, two distinct layers were isolated, the lower one being more silica rich and the upper constituting the microbes directly exposed to sunlight. These samples were named in the field, but names have been converted for consistency in publications (Appendix A-1).
On June 14t, 2 smooth mat samples and 2 colloform mat samples were collected for lipids. On June 15th, a colloform sample was taken at the beach; a smooth sample was taken at South Carbla Point; a smooth, pustular, and tufted mat were taken from the southern area of Carbla Point. Additionally, that day the upper layer of a colloform mat was isolated in three replicates (A, B, and C), lower layer of a colloform mat was isolated in two replicates (A and B), and colloform composite samples were isolated in three replicates (A, B, and C). Each of these samples were taken and then separated into the top 5cm and the lower layer (-5cm). Later that same day, smooth mats covered in 50 cm of water south of the Carbla Beach fence line were sampled in three replicates (A, B, and
C) and later sectioned into the top 5mm and the bottom 15 mm in the lab. The top layer
in this area was characterized by a pink top and green area below, in addition to some black beneath that, all adding up to be 5 mm. The bottom layer in this area instead was mostly black gelatinous material, with some of an older layer clearly visible in the 1 cm
thick sample. On June 17th, the pustular mats samples were collected from Carbla Point with the same vertical interval of 5 cm.
Samples were collected and handled with sterile instruments throughout the time of study. In the field, samples were removed from the main microbial mat covered regions and then stored in sterile jar with fired aluminum foil coverings. The samples were then cooled to -20 C within hours of collection before being shipped frozen to MIT, where they were then transferred to dark freezer maintained at -20 C.
2.2Total Lipid Extraction and Preparation of Lipid Fractions
2.2.a Extraction and Basic Preparation of Lipid Fractions
From the jars of lypholized microbial mats, aliquots were removed and ground to a fine powder using a mortar and pestle that was pre-cleaned first in a muffle oven and then with organic solvents, hexane, dichloromethane, and methanol (geocleaned). Lipids were extracted via modified Bligh and Dyer method (Bligh & Dyer, 1959), in which the dried, crushed biomass (200-500 mg) was placed in a solvent-cleaned 50 mL Teflon centrifuge tube. To account for sample loss during subsequent sample work-up, 20 Vg from a solution diluted to 100 ng/VL of C16 PAF, was added as the extraction standard.
For the first step of extraction, every gram of sediment was extracted with 4 mL of Bligh
& Dyer Mixture 1, which is comprised of 0.8 mL 50mM Phosphate buffer (aq), 1 mL
dichloromethane (DCM), and 2 mL methanol (MeOH). The tubes were subsequently shaken vigorously to fully mix solvent and sample, sonicated for 10 minutes, and then centrifuged for 10 minutes at 3000 rpm in an Eppendorf 5804 centrifuge. The supernatant from each step was then decanted into a pre-combusted and geocleaned separatory funnel. Geocleaned materials were rinsed three times with each of the following solvents: hexane, dichloromethane, and methanol. The full process of extracting with Mixture 1 was repeated another time and then followed by the same proportions of Bligh & Dyer Mixture 2, comprised of 0.8 mL 50mM trichloroacetic (TCA) buffer (aq), 1 mL DCM, and 2 mL MeOH. To prepare the aforementioned phosphate buffer, 8.7 grams of K2HPO4 was dissolved in 1 L MilliQ water and add an HCl solution until the final pH is 7.4. For the TCA buffer, 50 grams of trichloroacetic acid was dissolved in 1 L MilliQ water and add 20 grams of KOH pellets to result in a pH of 2.
In order to ensure that all non-polar "free" lipids are extracted, the same proportion of 4 mL of solvent to 1 gram of sediment was used for a mixture that was 3:1 by volume
DCM:MeOH. DCM and 5 times DCM cleaned water were added in a 1:1 ratio to the combined supernatant from the former extraction steps in the separator funnel. The volume of DCM used should equal the total amount of DCM used throughout the previous steps. The separatory funnel was vigorously shaken and allowed to sit while the layers separated.
After the layers had been separated clearly, the organic phase was drawn off the bottom and collected in an Erlemeyer flask. The remaining aqueous fraction was extracted 3 times with DCM, with the organic phase being combined after each step. After this, the remaining aqueous fraction was discarded and the organic phase was returned to the separatory funnel to be extracted with DCM cleaned water 3 further times. The remaining organic fraction was transferred to a pre-combusted 60 mL vial to be blown down under a stream of N2 in the TurboVap evaporator at 37 C. The total lipid extract (TLE) was then transferred to a 4 mL vial to be weighed for further calculations.
To prepare for five-fraction chromatography, an aliquot of about 1 mg of TLE was transmethylated with 2.5% methanolic HCl in order to yield fatty acid methyl esters (FAMEs), alcohols, and ether lipids. For this the vial of TLE was heated at 70 C for 30 minutes. After being gently blown down to dryness with N2, the remaining extract was taken up and transferred to a column using 3 washes of hexane and 1 wash of DCM. A
10 cm column of silica gel in a Pasteur pipette was used to separate the hydrolyzed lipid
extract using solvents of increasing polarity: saturated and unsaturated hydrocarbons (F) by 3/8 dead volume of hexane; aromatics (F2) by 2 dead volumes of 8:2 Hexane:DCM; ketones (F3) by 2 dead volumes of DCM; alcohols (F4 - including tetraethers) by 2 dead volumes of 1:1 DCM:Ethyl acetate (EtOAc); and acids and diols
(F5 - polars) by 2 dead volumes of 7:3 DCM:MeOH. Each fraction was collected in
combusted glassware and transferred using 3 washes of hexane and 1 was of DCM to 2mL vials. The fractions F1 and F3 were transferred directly into 2 mL vials pre-filled with 1 Vg of 3-methyl heneicosane, an anteiso C22 (ai-22) standard for quantifying the saturated and polar lipids. After transfer, these fractions were evaporated under a stream of N2 again and then re-dissolved in 200 VL hexane for running on the GC-MS (described in detail later). The F4 fraction was re-dissolved in hexane and transferred in equal amounts to two 2mL vials with inserts. Division of this fraction had been to subject the portions to different derivatization protocols, in order to analyze with different methods. One half of the F4 fraction was stored, while the other half was derivatized. Those vials not being used immediately were evaporated under a stream of
Dry BiamSaS
1. Add Intem-1 Unadw
M.oblg & DyWr EXtrwciom
wetTet ,aamn0.5yamd
sti Sample
I. Mild Acid MethiaoIvus '
. LiqWd Chrmmgrphy A. LC-G--.AAnsU RP-EV.3Z AmUa.n,
LC-.a-. an SiO: lit fimtio 1 I Bewwpm -+ n qTOF
.4'witu inA .qpc, ( .Utaa a v v ch'uvfl LA, b"&h$4W88a
Saliin_)b b~m nDCI PMi LA Rw
S~ WH otsuw Arm H*l U*aain fw
~A
%oat NA' AIKA&&AFigure 2.1 Diagram of Extraction and Analysis Procedures
2.2.b Derivatization
For the polar compound analysis, 100 VL pyridine and 100 aL of N,O-bis(trimethylsilyl) trifluoro-acetamide (BSTFA) were added to half of F4 and all of F5. The 2mL vials were then capped and incubated at 70 C for 30 minutes. The lipid fractions were subsequently blown to dryness under N2 while warm. For analysis via GC-MS (described in detail later), the F4 and F5 fractions were dissolved in hexane.
2.3IPLs Preparation and HPLC-MS Analysis
The untreated, total lipid extract was analyzed directly by HPLC-MS in accordance with the methods of W6mer et al., 2013 and Schubotz et al. 2013. By HPLC-MS, lipids were separated on a Waters Acquity UPLC BEH Amide column (125 mm x 2 mm, 5 Vm) with a linear solvent gradient through an Agilent 1200 series HPLC systems that is coupled to an Agilent 6520 Accurate-Mass Quadrupole Time-of-Flight (QTOF) mass spectrometer equipped with an electrospray ionization interface (ESI). The mass spectrometer was set to a scan range from m/z 400 to 2000 and performed MS/MS experiments in positive ion mode. Compounds were identified via exact masses, comparison of retention times with commercially available standards and published MS/MS fragmentation patters
(Sturt et al., 2004; Schubotz et al., 2013).
In order to analyze all IPLs, heat maps are created that plot the relative abundance of a compounds according to a specific mass that is recorded. Using an electrospray ionization interface (ESI), molecules are able to be isolated for quantification, assuming the mass falls within the given mass scanning range of the instrument being used. Plotted on the main axes are retention time in minutes and mass to charge (m/z), the latter which most often correlate directly to the mass of the compound, since the charge is typically +1. These values vary, particularly depending on the side chains of the molecule, which result in visible shifts of the elution time and mass-to-charge ratio. Marked by the intensity of color are the abundances of the different lipids. Groups of lipids can be identified based on this signature and, by tracing the intensities in a given region, the fragmentation of the particular lipid can be identified.
2.4 FAMEs and Hydrocarbon GC-MS Analysis
An Agilent 7890 gas chromatograph was used to identify the individual fatty acid methyl esters and alcohols, following the specifics of GC-MS analysis provided in Schubotz et al. 2013. This gas chromatograph, with a programmable temperature vaporizing (PTV) injector operated in splitless mode and equipped with a Varian
CP-Sil-5 fused silica capillary column (60-m length, 0.32 mm inner diameter, and 0.2CP-Sil-5-pm film
thickness) was coupled to an Agilent 5975C mass-selective detector.
Fractions F1 and F3 were run with a fatty acids method, while derivatized fractions F4 and F5 were run with a polars method. Data collected on the F1, F4, and F5 were stored for use in a later paper further detailing the lipid profiles of these samples.
To identify the individual lipids, the overall mass spectra and retention times were compared with authentic standards and/or samples where these compounds previously had been characterized. By extracting ion chromatograms of characteristic fragments within the given lipid, common types of lipid could be identified. Then, by identifying and comparing the molecular ion of each compound, it could be easily determined whether or not a compound had an unsaturation (shown by a loss of 2 mass units, 1 for each Hydrogen).
2.5GDGTs Preparation and HPLC-QTOF-MS Analysis
Core and intact glycerol dialkyl glycerol tetraethers (GDGTs) were analyzed using a relatively new method (Zhu et al., 2013) that uses a reversed phase liquid chromatography-electrospray ionization-mass spectrometry (RP-ESI-MS) protocol to analyze these compounds and others directly from crude total lipid extracts (TLE). This protocol was run in the positive ion mode on the same instrument, as described above, an Agilent 1200 series HPLC system coupled with an Agilent 6520 Accurate-Mass Quadrupole Time-of-Flight (QTOF) mass spectrometer that was equipped with an electrospray ionization source. Aliquots of TLE were dissolved in a known amount of methanol in a 2mL insert vial and then run on the HPLC-QTOF-MS.
The scan range of the mass spectrometer was set to m/z 100 to 2000 in positive ion mode and MS/MS experiments were also performed in a scan range from m/z 100-2000. Maintaining and monitoring mass accuracy was achieved by a tuning mixture solution and a lock mass (m/z 922.0098) that was infused throughout the entire course of the run
To be able to quantify the observed GDGTs, 5 ng of a lng/4L C46 standard was added as an injection standard to the TLE aliquot prior to injection. However, due to an overall lack of reference standards for every class of IPLs, particularly those novel intact branched GDGTs, the relative concentrations of GDGTs determined with these samples is semi-quantitative, similar to the findings of Liu in 2010.
Lipids in these samples were identified via retention time, accurate masses, and diagnostic fragments (e.g. Liu et al., 2010). To quantify particular GDGTs, methods were run on the data processing software Agilent Technologies MassHunter Qualitative Analysis that extracted ion chromatograms of the compounds of interest with molecular weights corresponding to particular core GDGTs and Glyco-GDGT (G-GDGTs).
Within the expected elution range (retention time of 50-80 minutes) of the compounds of interest, if a major peak corresponding to the particular GDGT/G-GDGTs was defined, it was manually integrated to determine the abundance of that particular lipid. When no peak could be located for a given sample, it was recorded that the abundance of the lipid in question was 0.
Preparation of the samples varied depending on initially obtained results. Samples of TLE were dissolved in a known amount of hexane in a 2mL insert vial and then run on
the QTOF. If peaks were found to be unclear and the signal to noise ratio was low (3:1 is the minimum), the samples were re-concentrated (dissolved in less methanol) and run once more. Re-concentration allowed for clarification if previous non-detect values were actually low concentrations and also improved the resolution of initial peaks.
2.6 BHP HPLC-QTOF-APCI Analysis
An aliquot of about 0.5Vg TLE was derivatized with 25 VL pyridine and 25 VL acetyl anhydride. Samples were left at room temperature for 24 hours to ensure acetylation of the BHPs. In order to quantify bacteriohopanepolyols (BHPs) present in these samples,
100 ng of 3a,12a dihydroxy-5p3-pregnon-20one, 3,12-diacetate (Pdia) was added to the
derivatized total lipid extract Later, the amount of a given BHP compound can be compared in relative abundance to Pdia (via integrated extracted ion chromatograms) in order to determine their absolute abundance.
Following the procedure used by Welander et al. (2012), a HPLC-MS system was used to detect the BHPs. The particular LC-MS system contains an Agilent Technologies 1200 Series HPLC that is equipped with an autosampler and a binary pump that links to an Agilent Technologies QTOF 6520 mass spectrometer via an Agilent Technologies atmospheric pressure chemical ionization (APCI) interface that was operated in positive ion mode. BHP compounds were eluted on a Poroshell 120 EC-C18 column (2.1 x 150 mm, 2.7 Vm, Agilent Technologies), set at a column temperature of 30 QC, first with MeOH:water (95:5, v:v) at a flow rate of 0.15 mL min-1 for 2 minutes. Subsequently, a linear gradient was followed until reaching 20% (v) of isopropyl alcohol (IPA) over 18 minutes at a flow rate of 0.19 mL min-1 and then maintained at 20% (v) for 10 minutes. The linear gradient was modified to then increase to 30% (v) of IPA at 0.19 mL min-1 for over 10 minutes and then 30% (v) was maintained for 5 minutes. Then the column was then eluted using a linear gradient up to 80% IPA (v) over 1 minute at a flow rate of 0.15 mL min-1 and then held for 14 minutes. Finally, the gradient was held for 5 minutes with MeOH/water (95:5, v:v) at 0.15 mL min-1.
The APCI parameters were set similarly to Welander et al. (2012): gas temperatures 325
'C, drying gas (N2) flow rate of 61 min-1, nebulizer (N2) flow rate 301 min-1, capillary
voltage 1200 V, corona needle 4 VA, and fragmentor 150 V. Data scans were recorded by scanning from m/z 100 to 1600. To identify BHPs found in these samples, exact masses were used as well as comparison of the retention time and mass spectra from published data (Talbot et al., 2003, 2007).
Various characteristics were used to identify the bacteriohopanepolyols, including fragmentation patterns in the MS-MS, accurate mass measurements of protonated molecular ions, and a comparison of the resultant relative retention times and mass spectra with previously reported data. To initially identify the different BHPs, a method created in Agilent Technologies MassHunter Qualitative Analysis software was run on the data files that created extracted ion chromatograms (EICs) of the compounds of interests, sorting them via specific masses. When the characteristic fraction of BHPs, m/z 191 or m/z 205 for the methylated version (Figure 1.1), were found to correlate with the
compound specific mass, an EIC was derived from the peak at that compound specific mass. This peak was then integrated in order to determine the relative abundance of this BHP.
Chapter 3
Results and Discussion
3.1 Quantifying Results
3.1.a Total Lipid Extract (TLE) Portions
The TLE of the various mat samples ranged from .09% to .24% of the dry weight of the samples (full data in Appendix A-1), which is a significantly lower range than 0.26% to 0.43% determined by Allen in 2010. Allen extracted a pustular mat to yield .43% TLE, while the pustular mat in this study yielded only .17% TLE, both by dry weight. For her smooth mats, she had a yield of 0.26% TLE, while this study averaged .10% of the dry weight, and she had a yield of 0.38% TLE for a stromatolite, while the stromatolites (colloform and smooth) included in this study yielded 0.13% of the dry weight as TLE.
A possible explanation for the lower yields of TLE for this study could be seasonality,
since the samples studied here were collected during June, which is winter in Australia, while Allen's samples were collected in December, the peak of the Australian summer. It would be very reasonable to have higher yields of organic material from samples collected during a time of high productivity. The factor is likely not the time between sample collection and lipid extraction, as some of Allen's samples were stored for 2-3 years before processing, like the delay in extraction from June 2011 to November 2013 in this study. Samples were preserved in a similar manner: freeze-dried and at -20
C.
3.1.b Quantification of Data
In order to offer as robust a data set as possible, semi-quantitative analysis of the abundances of particular lipid classes was conducted from the collected lipid profiles of
this study. In order to best determine these values, a combination of a comparison to an internal standard and basic mass tracking of the portion of samples being tested was utilized. Because some samples were run multiple times on different instruments, it was important to track the dynamic mass of total lipid extract (TLE) represented in each lipid profile. The amount of TLE was then directly linked to the overall mass of the microbial mat or stromatolite to provide a fairly quantitative representation of particular lipid abundances in different types of mats. A set of Master Tables detailing the quantified abundances is provided in the Appendices (A-3).
While exact quantification of results is close to impossible, partially due to the lack of authentic standards for comparison with some compounds and experimental error, much can be said about relative abundances for compounds. This type of relative analysis was used initially for analysis of GDGTs and BHPs by comparing the integrated areas of the Extracted Ion Chromatograms (EICs) of specific molecules of interest and for analyzing the Total Ion Chromatograms created through the MSD of the different lipid fractions.
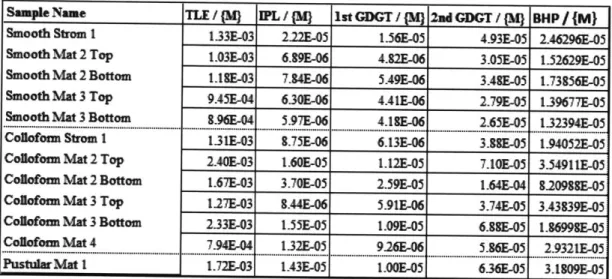
Table 3.1 Lipid Composition as Fraction of Total Mass
Sample Name TLE / PL /M ist GDGT 1 2nd GDGT /{3) BHP / M}
Smooth Strom I 133E-03 2.22-05 156E-5 4.93E-05 2.46296E-05 Smooth Mat 2 Top 1.03E-03 6.9E-06 4.82E-06 3.05E-05 1-52629E-05 Smooth Mat 2 Bottom L.SE-03 7.4E-06 5.49E-06 3AE-05 1.73856E05
Smooth Mat 3 Top 9A5E-04 6.30E-06 4AE-06 2.79E-05 1.39677E-05
Smooth Mat 3 Bottom t.96E-04 5.97E-06 4.1SE-06 2.65&05 132394E-05
Coilofoam Strom I 131E-03
8.75E-06
6.13E-06 3.2&05 1.94052E-05Colafomm Mat 2 Top 2.40E-03 1.60E-05 1.12E-05 7.OE-05 3.54911E-05
Collofom Mat 2 Bottom 1.67E-03 3.70E-05 2.59E-05 1.64E-04 t.20988E-05 Collofoam Mat 3 Top 1.27E-03 .44E-06 5.91E-06 3.74E05 3.43S39E-05 Colbfoan Mat 3 Bottom 233E-03 155E-05 1.09E-05 6.886-05 1.869986-05 Collofos Mat 4 794E-04 132E-05 9.26-06 5.86&05 2.9321-05
PustulIrMat I 1.72E-03 1.43-05 1.006-05 636&05 3.1809E-05
(MJ here is defined as the mass of the initial sample of microbial mat or stromatolite. These masses ranged from 3.6 grams to 15.85 grams, depending on the amount removed for extraction and subsequent lipid analysis. The fractional amount, subsequently referred to as
f,
shows how much of the total sample is accounted for by the lipid quantity reported. Multiplying the quantified compound specific abundances that are determined in each analysis step by 1/f allows for quantification of each lipid in the overall microbial mat or stromatolite sample.3.2 Intact Polar Lipids
3.2.a Results
Relative abundance and diversity of the microbial community of the different mats was obtained through use of a density map (a.k.a. heat map), which allows for a 3-d view of the chromatographic separation of different molecules (Figure 3; other heat maps can be found in the Appendices (A-4)). The signatures represented can be used as a lipid fingerprint of the respective sample, thereby facilitating a high level comparison between the different samples.
Different sections of the plot, corresponding to distinct elution times and mass-to-charge values, were correlated to specific types of lipids based on known values. The distinct steps shown within the density map correlate to different fatty acid side chains for the different molecules. On the heat maps featured in this section, the different areas and their corresponding lipid classes have been annotated to aid in understanding this analysis.
Smooth Mat 2 Top -Intact Polar Lipid Heat Map Iwo
DGTS dimet -law -1405 OL dimets 1300 i2oo
(
1100 -OL
119 - DGTS\~ 41 a 8 1 7 1 18 I 20 22 24 26SmoothMat 2 Bottom -Intact Polar LUpod Heat Map EIGI
'M4:iAp-~~~1
2M0 -1800 :'1700 '500 11400 6.10 r$00 4100 -70 2--- 10 12 14 ThWM(*w 16 is-- ---Figure 3.1 Heat Map of Intact Polar Lipids
The plots above are two examples of density/heat maps created from the samples Smooth Mat 2 Top (upper plot) and Smooth Mat 2 Bottom (lower plot). Distinct regions of mass-to-charge and retention time correlate to different types of lipids.
Overall, the most consistently dominant signatures were from Diacylglyceryl hydroxymethyltrimethyl-p-alanine (DGTA), Diacylglyceryltrimethylhomoserine
(DGTS), Trimethyl ornithine lipids (TM-OL), and Ornithine lipids (OL), with the most
consistently dominant lipid, even between the different layers, was Phosphatidylcholine
(PC). PC is a methylated derivative of Phosphatidylethanolamines (PE), which compose
about 25% of all phospholipids in all living cells. This particular compound can be traced to the exoplasmic, outer portion of a cell membrane and has a unique soap-like structure that maintains membrane fluidity while minimizing membrane permeability. In such a hypersaline environment like Hamelin Pool, this membrane lipid could be extremely important for the survival of some microorganisms. PC is found in a lower proportion of bacterial membranes, about 10% of species, so the inclusion of such a strong signal could be from a consistent bacterial presence. Additional support for this theory is that PC is not commonly found in cyanobacteria (Barton 2005), so its source could be different bacteria that thrive in all layers of the samples.
v F 0 922== -4 Am
The presence of both TM-OL and OL in the samples analyzed suggests a strong presence of a microbial community that has an anaerobic autotrophic metabolism. TM-OL, often attributed to planctomycetes, has been found in brackish, marine, and fresh water in association with anaerobic autotrophic metabolism (Moore et al. 2002). Ornithine lipids are found in many different source organisms, yet there have been some links made between their presence and sulfate-reducing bacteria (Makula and Finnerty, 1975; Schubotz et al., 2009). However, if the presence of TM-OL suggests anaerobic autotrophic metabolism, the ornithine lipids could be attributed to photosynthetic bacteria, as they have been previously related (e.g. Zhang 2009).
Both DGTS and DGTA are betaine lipids and suggest a microbial community with a strong presence of different lower (non-vascular) plants. In particular, many soil, bacteria, algae, and non-vascular plants synthesize the phosphorus-free DGTS, especially in response to phosphorus deprivation (e.g. Riekhof, et al. 2014; Geske et al. 2012). Betaine lipids like these are also found widely within ferns, bryophytes, lichens, and some fungi and protzoans. For these samples from Hamelin Pool, the DGTS and
DGTA lipids could be a signal of the phototrophic microbes in the microbial mats or
they could be from any soil being brought into the bay, likely being eolian. It is hard to tell any distinction between the heat maps of upper and lower layers of the smooth mats, although the signatures appear to be stronger in the bottom samples, which would then negate the aforementioned reasoning for the origination of DGTS and DGTA. However, without quantitative data, it is not possible to make any concrete deliberations about the lipid yields, let alone the corresponding microbial community.
Archaeal intact polar lipid signatures were surprisingly weak for all of the samples that were analyzed in this way. Archaeal lipids would be represented in the heat maps in the upper left hand corner, with a low elution time and high mass. The lack of a strong signal for archaeal lipids is interesting, especially since previous studies have isolated different archaea, like the Halobacteria from the Euryarchaeota, and confirmed that they most likely originate from the stromatolites and microbial mats, as opposed to the surrounding water (Goh et al., 2009).
Differentiating the already weak archaeal intact polar lipid signal allows for some limited comparison of community distributions for the upper and lower mat. Typically, the lower layers of microbial mats in Hamelin Pool have been found to have an abundance of sub-surface archaea, as well as sulfate-reducing bacteria (Goh et al., 2009). It would then be sensible to see an increase in the IPL signature of archaea when progressing from the upper layers of a microbial mat to the lower layers, as occurs in the
samples analyzed in this study. However, the intensity of this signal change is rather low, so it would be difficult to base any claims on the archaeal community present in the samples without quantifying the data, a process not attempted in this study, since the intact polar membrane lipid, G-GDGT, was quantified and analyzed, in addition to the core GDGT.
3.2.b Data Validation Efforts
In relation to the dimers, which form during high analyte concentrations, they were identified and then accounted in the overall lipid distribution for whenever detected. As noted by Schubotz et al. 2013, it is possible that high molecular weight compounds, such as intact GDGTs and N-acetyleglucosamine (NAcG)-DAGs, were outside the analytical window of 500 - 2000 m/z. This could then result in an underrepresentation of these compounds. Regardless of representation in the samples, accounting for differences in the response factors for the different lipid classes remains incomplete, due to a lack of authentic standards.
3.3 Fatty Acid Methyl Esters
Initial identification of individual compounds was conducted via mass chromatograms that show the FAME characteristic 74 Da McLafferty rearrangement ion. In addition to the multiple metrics for initial identification based on the extracted ion chromatograms (EICs), more specific confirmation of the lipids was attained by comparing mass spectra and retention times with authentic standards, when possible.
Analysis of the FAME total ion chromatograms showed relatively standard distributions. For the majority of the samples analyzed, the dominant peaks were the ubiquitous, among bacteria and eukaryotes, C1 6 and C18, with the former being stronger. Overall, branched
FAMEs were identified only in the range of C14 to C18, while the saturated, straight chain
(normal) FAMEs were found throughout the range observed (C14 to C26). The abundance
of short-chain odd carbon numbered, branched fatty acids can be attributed to bacteria (Kaneda, 1991), which offers a general characterization of the microbial mats studied here. The method used a shorter holding period, so very long carbon chain FAMEs that take longer to elute, were not observed. The long carbon chains (i.e. >C20) that were
Smooth Mat 3 Top - Fatty Acid Methyl Esters
100 I51 2M@-1CI
lei n-C16 15:1 As br-15 9= K15 C = l-Ci A a r.CIS FGH = bi-I7 Ian-Cl7 no-Cl 1W:2 S cD A 2500 low 4000 4600 C22 C24 C26 saw 55 60sw TWm OVNiSmooth Mat 2 Top -Fatty Acid Methyl Esters
100 n-C16 15:1 11 151 n-C14 Cis 1W2 S C17 C20 ias mm lb.. ann C22 C24 Maie K"
Figure 3.2 FAME Chromatograms
These chromatograms are labelled with the different FAMEs detected, ranging from 14 carbon chains to 24 carbon chains. The injection standard can be clearly seen, which allows for quantification of this data.
The fewer long-chain FAMEs that were able to be identified represent those long-chain fatty acids, C24 to C30, that are not very common in Bacteria, but that likely come from detrital plant material. Previous studies have determined that these long-chain signatures originate from the breakdown products of the local vegetation (Rezanka et al., 1989) that could have been washed in (or blown in for the arid Australian climate). The prominence of the even-over-odd carbon numbers for these long-chain fatty acids
.5 V
I
.5 F S 3500 OWhas been often attributed to an origin from vascular plants (Eglinton & Hamilton, 1967). Both vascular plants have this signature throughout their leaf waxes, while sediments with significant terrigenous plant inputs also have demonstrated the same signature (Eglinton & Hamilton, 1967; kezanka et al., 1989). If isotopic analysis were conducted on these FAMEs, it would be possible to determine if the source of long-chain FAMEs was consistent or if there were distinct sources; the latter option could then suggest other sources, like some eukaryotes that have been correlated strongly with long-chain fatty acids (R'ezanka et al., 1989; I'ezanka & Sigler, 2009).
Although the exact FAMEs have not been identified, there are strong n-C16 signatures
that appear to be the 10-Me C16:0 fatty acid, which is highly diagnostic of sulfate-reducing species. The fatty acid was found to be prevalent in multiple environmental samples that have prominent sulfate-reducing bacteria (e.g. Hinrichs et al., 2000; Labrenz et al. 2000). The C16 fatty acid was highly distinct between the layers of Smooth Mat 3, with the C16 relative abundance being almost two times greater in the lower layer than in the top, an observation that is consistent with a lower layer dominated by sulfate-reducing bacteria. Also, suggesting sulfate reduction are the distinctive C12 to C19 fatty acids that, in combination with their branched fatty acids from the bacterial phospholipids, have been shown to correlate to sulfate-reducing bacteria (Taylor & Parkes, 1983). These signatures are some of the most dominant represented in the FAMEs, which suggests a strong presence of sulfate-reducing bacteria in the microbial mats and stromatolites in Hamelin Pool.
Notable signature of different unsaturated FAMEs, particularly C16:1 and C18:1, with the latter sometimes occurring in multiple forms within one sample, are particularly interesting. In multiple samples, like Smooth Mat 3 Top, the C16:1 peak actually surpassed the C16:o in terms of relative abundance, while the C8:1 peak(s) regularly surpassed the C8:0 peaks. This high yield of unsaturated C6 and C8 fatty acids has been observed before in Geobacter metallireducens, a sulfate-reducing species (Lovely et al.,
1993), which, based on this correlation, could be abundant in the microbialites of
Hamelin Pool.
Trends in FAMEs for this study closely resemble those of ooids in both Hamelin Pool and Cat and Andros island in the Bahamas (Summons et al., 2013), which suggests a similar microbial community. In previous studies, data has suggested the inhabitance of ooids by specific microbiota, but proof of microbial biofilms being this source is limited (Summons et al., 2013). However, now adding the FAME signatures from this study to others of stromatolites and thrombolites undergoing active lithification in association
with a photosynthetic biofilm, there is more evidence suggesting similar microbial origins for microbial mats and ooids, especially in Hamelin Pool and the Bahamas. For both community assemblages, the molecular evidence for combinations of primary producing cyanobacteria and sulfate-reducing bacteria indicates sources for both organic matter an alkalinity, which have been found to drive active carbonate precipitation, especially for lithifying organosedimentary biofilms (Dupraz & Visscher,
2005; Dupraz et al., 2009), like in the microbialites studied here.
3.4 Glycerol Dialkyl Glycerols (GDGTs) and Glyco-GDGTs
3.4.a Initial Run
-
Relative Abundance Only
The initial runs for both GDGTs and G-GDGTs were at a lower concentration of the total TLE (Table 3.1), which resulted in data that had a signal to noise ratio that was below the acceptable 3:1 ratio, which allows for better distinction of the data peaks. This initial run, as previously mentioned, was completed to determine the ideal concentration for future quantification of core and intact GDGTs. Despite the lower quality of the data, certain distributions of the different GDGTs and G-GDGTs were robust enough to yield patterns among the 5/12 different samples that successfully ran and were stored for study on the Agilent Qualitative Analysis software.
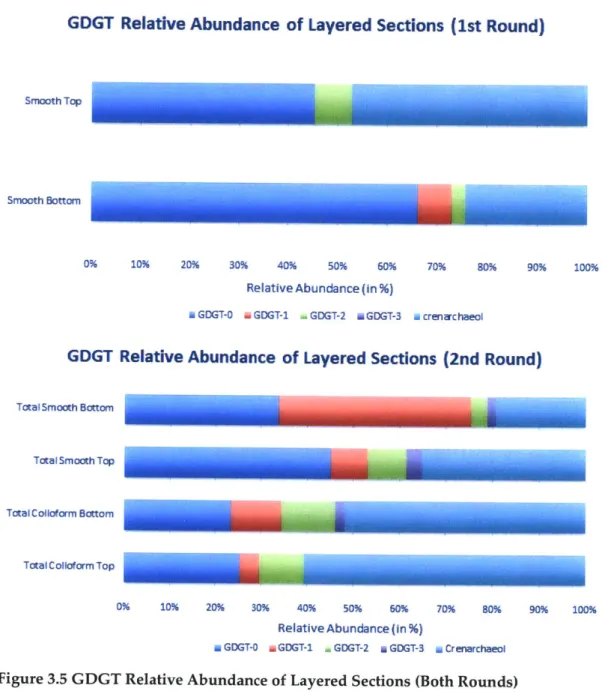
Overall, within the smooth mat samples, the relative abundances were highly dominated by GDGT-0 (67%), with the subsequent most dominant GDGT being Crenarchaeol (20%), while the remainder was split among the remaining GDGT molecules identified in this study (GDGT-1, GDGT-2, GDGT-3). A noticeable shift in the
GDGT composition occurred when 4/5 of the smooth mat samples were divided to show
the upper level samples (denoted as "Top") and lower level samples (denoted as "Bottom"). For Smooth Mat Top samples, Crenarchaeol GDGTs dominated at 47% relative abundance, followed closely by GDGT-0 at 45% relative abundance, with the remainder being comprised of GDGT-2. Conversely, with the Smooth Mat Bottom samples, there was a much lower relative abundance of Crenarchaeol GDGTs (24% relative abundance), as the majority of the sample was determined to be GDGT-0 (66% relative abundance). GDGT-2 was also present in the Smooth Mat Bottom samples at 3% relative abundance, while the remaining 7% was attributed to GDGT-1, a compound not observed in these initial runs on Smooth Mat Top samples.
GDGT Relative Abundance of Layered Sections (1st Round)
Total Smooth
7tflCoadorm-0% 10% 20% 30% 40% 50% 60%
Relative Abundance (in %)
70% 80% 90% 100%
U GDGT-0 a GDGT-1 . GDGT-2 M GDGT-3 a crenarchaeal
G-GDGT Relative Abundance (1st Round)
Total Smoorh
TotalCo~lafarm
20% 40% 60%
Relative Abundance (in %)
M G- GDGT-0 M G-GDGT-1 - G-GDGT-2 M G-GDGT-3
80%
ia G-cr enarchaeol
Figure 3.3 GDGT Relative Abundance (1s Round)
The different GDGTs and G-GDGTs were subjected to a ratio comparison to determine any significant trends in relative abundance.
No other trends could be determined because of the quality of data in the run for determining the best concentration for clear results and the limited number of samples