Conceptual Design of an In-Situ Sequential Anaerobic/Aerobic
Bioremediation Scheme for Chlorinated Solvents in the
Landfill-1 Plume at the Massachusetts Military Reservation
by
Farnaz Saboori Haghseta
B.S. Chemical Engineering
Massachusetts Institute of Technology, 1996
Submitted to the Department of Civil and Environmental Engineering in Partial
Fulfillment of the Requirements for the Degree of
MASTER OF ENGINEERING
IN CIVIL AND ENVIRONMENTAL ENGINEERING
at the
MASSACHUSETTS INSTITUTE OF TECHNOLOGY
JUNE 1997
copyright 0 1997 Farnaz Saboori Haghseta. All rights reserved.
The author hereby grants MIT permission to reproduce and to distribute publicly paper and electronic copies of this thesis document in whole and in part.
Signature of Author
--0
Farnaz Sabuoori HaghsetaDepartment of Civil and Environmental Engineering
May 9, 1997
Certified by
Fernando Miralles-Wilhelm
Lecturer, Department o Civil and Environmental Engineering
Accepted by
JUN
2
41997
I v I
V V Joseph SSussman
Chairman, Departmental Committee on Graduate Studies
OF 'C•H-••'LY r
- -~--~
Conceptual Design of an In-Situ Sequential Anaerobic/Aerobic
Bioremediation Scheme for Chlorinated Solvents in the Landfill-1 Plume at
the Massachusetts Military Reservation
by
Farnaz Saboori Haghseta
Submitted to the Department of Civil and Environmental Engineering on May 9, 1997 in Partial Fulfillment of the Requirements for the Degree of Master of Engineering in Civil and Environmental Engineering
ABSTRACT
Chlorinated compounds represent the most prevalent organic groundwater contaminants in the country. Until recently, bioremediation had not been considered a viable option for the treatment of chlorinated solvents. There is now sufficient theoretical and experimental information to suggest that in-situ bioremediation can be utilized to effectively degrade chlorinated compounds.
A conceptual design is proposed for the in-situ bioremediation of tetrachloroethylene (PCE) and trichloroethylene (TCE). These contaminants have been detected in LF-1, a plume
emanating from the Main Base Landfill at the Massachusetts Military Reservation in Cape Cod, Massachusetts. The conceptual design relies on the establishment of sequential anaerobic and aerobic biozones to reduce the local maximum PCE and TCE concentrations. These biozones are created by the injection of essential components of bioremediation, which include nutrients, growth substrates, and oxygen. The delivery of these agents to the areas of highest measured
PCE and TCE concentration is necessary for the successful biodegradation of these contaminants
in the LF-1 plume. Design parameters include the placement of injection wells to establish the aerobic and anaerobic biozones, the radii of influence of the wells, selected substrates and nutrients, and the concentrations and flow rates for the injected nutrients, oxygen, and substrates.
In order to induce the biodegradation processes, the design requires the following to be injected at key locations in the plume: ammonium and phosphate as nutrients for the microorganisms, methane substrate for the aerobic microorganisms, methanol substrate for the anaerobic microorganisms, and oxygen for the stimulation of microorganisms in the aerobic biozones. The estimated total time for bioremediation of TCE and PCE to 5 pg/L (the Maximum
Contaminant Level for TCE and PCE) ranges from five to fourteen years, depending upon the extent of contamination and the background conditions at the particular location in the plume.
The bioremediation of chlorinated solvents is a promising treatment technology. However, the lack of full-scale implementation to date leaves many questions to be answered, particularly regarding the cost-effectiveness of the process. This conceptual design serves as a basis for the development of pilot tests which can more accurately assess the effectiveness and feasibility of this technology.
Thesis Supervisor: Fernando Miralles-Wilhelm
ACKNOWLEDGEMENTS
My deepest and warmest gratitude goes to my family and friends for their love and support, especially during the past five years at MIT. I would like to thank Professor Fernando Miralles- Wilhelm, whose kindness, direction, and valuable input was
instrumental in the completion of my thesis. I would like to thank Professor David Marks and Shawn Morrisey for their constant support and encouragement, and for their
invaluable advice and guidance during the hectic job search process. I am also grateful to my fellow LF-1 team members, Mia Lindsey, Roberto Le6n, Becky Kostek, and
Mandeera Wagle, who made the experience of writing a thesis as enjoyable as it could possibly be.
TABLE OF CONTENTS 1. INTRODUCTION ... 7 1.1 PROBLEM STATEMENT ... 1.2 OBJECTIVE...7 1.3 SCOPE OF THESIS...8 2. SITE DESCRIPTION ... 9
2.1 LOCATION AND HISTORY...9
2.2 GEOLOGY . ... 10
2.3 HYDROGEOLOGY... 11
2.4 ENVIRmONMENTAL POLLUTION AT MMR ... 12
2.5 CHARACTERISTICS OF THE MAIN BASE LANDFILL... ... 12
2.5.1 Landfilled Materials ... 14
2.5.2 Current Status of the Landfill... 15
2.5.3 Contaminant Plume Resulting from the Landfill... ... 15
2.5.3.1 Current Status of LF-I ... 17
3. BIOREMEDIATION ... 18
3.1 DEFINITION ... 18
3.2 MICROORGANISMS ... 18
3.3 ENVIR ONsMENTAL REQUIREMENTS ... 19
3.3.1 N utrients ... ... 20
3.3.2 Electron Acceptor ... 21
3.3.3 Substrate... ... 22
3.3.4 Other Environmental Conditions...24
3.3.4.1 Tem perature...24
3.3.4.2 pH ... ... . ... 25
3.3.4.3 Concentration Range of Contaminant ... 25
3.4 IN- SITU BIOREMEDIATION... 26
3.4.1 Advantages over Remedial Alternatives ... 26
4. CHARACTERIZATION OF THE LF-1 PLUME ... ... 28
4.1 PLUME CHARACTERIZATION ... 28
4.2 SPATIAL DISTRIBUTION OF CONTAMINATION ... 28
4.3 SPATIAL DISTRIBUTION OF NUTRIENTS ... 32
4.4 SPATIAL DISTRIBUTION OF OXYGEN ... 34
4.5 SPATIAL DISTRIBUTION OF SUBSTRATES...36
4.6 SPATIAL DISTRIBUTION OF MICROORGANISMS... 36
4.7 SPATIAL DISTRIBUTION OF TEMPERATURE AND PH... ... ... 36
5. SEQUENTIAL ANAEROBIC/AEROBIC DEGRADATION OF CHLORINATED SOLVENTS .37 5.1 BIODEGRADATION OF ORGANIC COMPOUNDS ... 37
5.2 TCE: AEROBIC COMETABOLIC DEGRADATION ... 40
5.3 PCE: ANAEROBIC COMETABOLIC DEGRADATION...44
5.4 COMBINATION OF ANAEROBIC AND AEROBIC PROCESSES... ... 47
6. DEVELOPMENT OF CONCEPTUAL DESIGN ... 48
6.1 BASIS FOR CONCEPTUAL DESIGN ... 48
6.2 SUBSTRA-TE REQUIREMENT ... 48
6.3 OXYGEN REQUIREMENT ... 49
6.4 BACTERIA ... 50
6.5 NUTRIENT REQUIREMENTS... ... 51
6.6 ANALYTICAL M ODELS ... 51
6. 6. 1 Injection W ells...51
6. 6.2 Biodegradation... ... 55
7. C O N C EPTU A L D ESIG N ... ... 57
7.1 PLACEMENT OF INJECTION W ELLS ... ... 57
7.2 INJECTION PARAM ETERS ... ... 60
7.2.1 Injection Contents... ... ... 60
7.2.2 Injection Flowrates and Concentrations ... ... ... 61
7.3 ESTIMATION OF BIOREMEDIATION TIME ... ... 66
8. C O N C LU SIO N ... ... 68
8.1 SUM M ARY OF CONCEPTUAL D ESIGN ... ... 68
8.2 POTENTIAL PROBLEM S ... ... 69
8.2.1 Clogging... ... 69
8.2.2 Interm ediate Toxicity... 70
8.2.3 Competitive Inhibition... 70
8.3 RECOMM ENDATIONS FOR FUTURE W ORK ... ... 71
8.4 SUM M ARY ... ... 73
9. R EFER EN CES ... ... 74
10. A PPEND IC ES... ... 78
10.1 APPENDIX A: DISSOLVED OXYGEN CONCENTRATION DATA FOR LF-1 (OPTECH, 1996b) ... 79
10.2 APPENDIX B: EXPLANATION FOR EQUATIONS 7-1 AND 7-2 ... 83
LIST OF FIGURES
FIGURE 2-1 LOCATION OF M M R... ... 9
FIGURE 2-2 GEOLOGY OF UPPER CAPE COD ... 10
FIGURE 2-3 LOCATION OF LANDFILL CELLS (CDM FEDERAL PROGRAMS, 1995)... 13
FIGURE 2-4 MAP OF LF-1 PLUME IN UPPER CAPE COD... 16
FIGURE 3-1 UTILIZATION OF THE ORGANIC CONTAMINANT FOR ENERGY AND CELL PRODUCTION (NATIONAL RESEARCH COUNCIL, 1993) ... 21
FIGURE 3-2 ENZYME REACTIONS AS "LOCK AND KEY" (NYER, 1992)... ... 23
FIGURE 3-3 TEMPERATURE RANGES FOR THREE CLASSES OF BACTERIA (NYER, 1992) ... 24
FIGURE 3-4 TYPICAL BIOREMEDIATION SCHEME IN THE SATURATED ZONE (KERR, 1994)...26
FIGURE 4-1 PCE ISOCONCENTRATION CONTOUR MAP (CDM FEDERAL PROGRAMS CORPORATION, 1995)..30
FIGURE 4-2 TCE ISOCONCENTRATION CONTOUR MAP (CDM FEDERAL PROGRAMS CORPORATION, 1995).31 FIGURE 4-3 SPATIAL DISTRIBUTION OF DISSOLVED OXYGEN AND OTHER PARAMETERS (OPTECH, 1996a)35 FIGURE 5-1 IMPORTANT ELECTRON ACCEPTORS IN PRIMARY BIOTRANSFORMATIONS (KERR, 1995)...38
FIGURE 5-2 PATHWAY FOR THE METHANOTROPHIC UTILIZATION OF METHANE (SEMPRINI ET AL, 1991 a)...41
FIGURE 5-3 EPOXIDATION OF TCE IN COMETABOLIC DEGRADATION (UNIVERSITY OF MINNESOTA BIOCATALYSIS/BIODEGRADATION DATABASE, 1997) ... 42
FIGURE 5-4 ABIOTIC HYDROLYSIS OF THETCE EPOXIDE IN COMETABOLIC DEGRADATION (UNIVERSITY OF MINNESOTA BIOCATALYSIS/BIODEGRADATION DATABASE, 1997)... ... 43
FIGURE 5-5 HETEROTROPHIC DEGRADATION OF INTERMEDIATE AS THE FINAL STEP IN COMETABOLIC DEGRADATION (UNIVERSITY OF MINNESOTA BIOCATALYSIS/BIODEGRADATION DATABASE, 1997)...43
FIGURE 5-6 RELATIONSHIP BETWEEN DEGREE OF CHLORINATION AND AEROBIC AND ANAEROBIC DEGRADATION RATES (KERR, 1994) ... 45
FIGURE 5-7 IDEAL SCHEMATIC FOR SEQUENTIAL ANAEROBIC/ AEROBIC DEGRADATION OF PCE AND TCE.47 FIGURE 6-1 INJECTION WELL SCHEMATIC USING PARAMETERS IN WELTY-GELHAR SOLUTION...53
FIGURE 6-2 DIMENSIONLESS BREAKTHROUGH CURVE FOR CONTINUOUS INJECTION AND CONSTANT DISPERSIVITY (WELTY AND GELHAR, 1994)... 54
FIGURE 7-1 INJECTION W ELL PLACEMENT...58
FIGURE 7-2 CONCEPTUAL DESIGN OF INJECTION WELLS ... ... 59
FIGURE 8-1 BIOREMEDIATION WITH SEQUENTIAL ANAEROBIC/ AEROBIC BIOZONES ... 68
LIST OF TABLES TABLE 2-1 LANDFILLED MATERIALS (CDM FEDERAL PROGRAMS, 1995) ... 14
TABLE 3-1 MICROORGANISM POPULATION DISTRIBUTION IN SOIL AND GROUNDWATER (NYER, 1992)... 19
TABLE 3-2 MOLECULAR COMPOSITION OF A BACTERIAL CELL (NYER, 1992)...20
TABLE 4-1 CONTAMINANT MAXIMUM CONCENTRATIONS AND MCLS (CDM FEDERAL PROGRAMS CORPORATION, 1995)... ... 28
TABLE 4-2 NITRATE VALUES FOR LF-1 (OPTECH, 1996a) ... ... 33
TABLE 5-1 POTENTIAL FOR CHLORINATED ALIPHATIC HYDROCARBON BIODEGRADATION AS A PRIMARY SUBSTRATE OR THROUGH COMETABOLISM (KERR, 1994) ... 39
TABLE 6-1 DEGRADATION RATE ESTIMATES FOR PCE AND TCE ... 55
TABLE 7-1 SUMMARY OF INJECTION CONTENTS, CONCENTRATIONS, AND FLOWRATES... 66
1.
INTRODUCTION
1.1
Problem Statement
The main base landfill at the Massachusetts Military Reservation (MMR) on Cape Cod, Massachusetts has served as MMR's primary solid waste disposal facility since 1941. Unregulated hazardous material disposal activities from 1941 to 1984 resulted in a groundwater contaminant plume migrating from the landfill, containing chlorinated solvents, such as tetrachloroethylene (PCE) and trichloroethylene (TCE), at levels above statutory primary drinking water standards. Remediation of the contaminant plume to concentrations below the Maximum Contaminant Levels (MCLs) is necessary in order to prevent potential adverse effects of the contaminants to human health and the environment.
1.2 Objective
The objective of this thesis is to develop a conceptual design for the in-situ bioremediation of chlorinated solvents in the LF-1 plume. The design will rely on the sequential anaerobic/aerobic degradation of PCE and TCE. Design parameters will include the placement of wells to establish the aerobic and anaerobic biozones, the radii of influence of the wells, selected substrates and nutrients, as well as recommended concentrations and flow rates for the injected nutrients, oxygen, and substrates. The total time for remediation of the plume to the MCLs will also be estimated.
1.3
Scope of Thesis
This thesis describes a conceptual design for the in-situ bioremediation of chlorinated solvents in the LF-1 plume at the Massachusetts Military Reservation, located in Upper Cape Cod. Chapter 2 provides an overview of the geology and hydrogeology of Upper Cape Cod. It also includes a description of the location, history, and pollution issues of the MMR, as well as an introduction to the main base landfill at MMR. Chapter 3 provides an overview of bioremediation, including basic definitions, the necessary components for successful bioremediation, and the advantages of in-situ bioremediation over common cleanup techniques such as pump-and-treat and air stripping. Chapter 4 is a detailed examination of the subsurface conditions at LF-1. The distribution of essential bioremediation components throughout the LF-1 plume is described. This chapter will provide the basis for the conceptual design. Chapter 5 explains the processes of aerobic and anaerobic degradation, and the utilization of these processes in concert to effectively degrade trichloroethylene (TCE) and tetrachloroethylene (PCE). Chapter 6 discusses the data gathered from various literature sources which are used to develop the conceptual design. Furthermore, the chapter describes the analytical equations utilized in the conceptual design. Chapter 7 provides the resulting conceptual design, including injection well placement, injection contents, injection flowrates and concentrations, and total bioremediation time. Finally, Chapter 8 will summarize the results of the conceptual design. Potential problems with the design are also discussed, along with recommendations for future work which could improve the feasibility and cost-effectiveness of the design.
2. SITE DESCRIPTION
2.1
Location and History
The Massachusetts Military Reservation (MMR) is located in the upper Western portion of Cape Cod, Massachusetts, as shown in Figure 2-1. The MMR occupies approximately 22,000 acres within the towns of Bourne, Sandwich, Mashpee, and Falmouth in Barnstable County.
Figure 2-1 Location of MMR
Military activity began at the base in 1911, but the bulk of the activity has occurred since
1935, with operations by the U.S. Army, U.S. Navy, U.S. Coast Guard, U.S. Air Force,
Massachusetts Army National Guard, and U.S. Air National Guard. The heaviest activity
at MMR occurred from the 1940s, when U.S. Army activities intensified due to World War II, to the 1960s and 1970s, when the U.S. Air Force maintained heightened aircraft operations. (CDM Federal Programs Corporation, 1995)
2.2 Geology
Three types of major geologic formations make up the stratigraphy of the Upper Cape: the Mashpee Pitted Plain (MPP), the Buzzard's Bay Moraine (BBM), and the Sandwich Moraine (SM), shown in Figure 2-2.
Figure 2-2 Geology of Upper Cape Cod
The BBM and SM units have not been characterized in detail, and are reliably known only to consist of poorly sorted sand and gravel with localized deposits of silt and clay. (Masterson et al., 1994, 1996) To the northwest of the BBM lies the Buzzard's Bay Outwash (BBO). The BBO is thought to simply be a continuation of the MPP, with
IULLzII Outwa! Buzzard's E Moraine C3...:.. Ll...:.. n.. .r 1 - -..
similar soil layers and properties. (Masterson et al., 1996) The MPP, which lies between the BBM and SM, consists of fine to coarse- grained sands that form a broad outwash plain. The bedrock in Upper Cape Cod lies approximately 300 feet below ground surface. (CDM Federal Programs Corporation, 1995)
2.3 Hydrogeology
Upper Cape Cod, including MMR, has a single groundwater system which is an unconfmed aquifer. The aquifer, which ranges from 50 to 175 feet in thickness, is recharged by infiltration from precipitation. It is bounded by the Atlantic Ocean on three sides, with groundwater discharging into Cape Cod Bay on the north, Buzzards Bay on the west, and Nantucket Sound on the south. The water table, which resembles a mound, has its high point beneath the northern portion of MMR, near the site of the FS-12 plume. The hydraulic gradient across the MMR ranges from 0.0014 to 0.0018 ft/ft. (CDM Federal Programs Corporation, 1995)
The hydraulic conductivity of the MPP outwash soils are as high as 380 ft/day. The hydraulic conductivity of the fine-grained sediments underlying the outwash are only 2 to 10% of that value. Most of the regional groundwater flow occurs in the upper, coarse sand and gravel layer. Horizontal flow velocities range from 1 to 3.4 ft/day. (CDM Federal Programs Corporation, 1995)
2.4
Environmental Pollution at MMR
In 1982, the Department of Defense developed the Installation Restoration Program, whose purpose was to investigate and clean up environmental pollution at MMR facilities. The MMR was placed on the United States Environmental Protection Agency (USEPA) National Priorities List (NPL) in November 1989, indicating that the contamination at the reservation posed a serious threat to human health and the environment.
Since May 1996, the Installation Restoration Program has been managed by the Air Force Center for Environmental Excellence (AFCEE). A series of remedial studies and activities are currently being conducted under the Program in accordance with the guidelines and procedures of the USEPA Superfund Program and the National Contingency Plan (NCP). To date, the Installation Restoration Program has spent over
$130 million on investigation and cleanup at the reservation. Currently, 78 separate sites
at the MMR are identified as environmental contamination sources, including fuel and chemical spill areas, landfills, coal yards, storm drains, and firefighter training areas, and
10 major groundwater contaminant plumes, including the main base landfill plume,
known as LF-1. (Massachusetts Department of Environmental Protection, 1996)
2.5
Characteristics of the Main Base Landfill
The main base landfill covers approximately 100 acres in the southwestern section of the Massachusetts Military Reservation. It was used by the Army, Air Force, other military branches, and the towns of Bourne, Falmouth, and Sandwich as a place of
disposal from 1940-1984. Unregulated and unmonitored disposal to the landfill was a common occurrence. (Kostek, 1997)
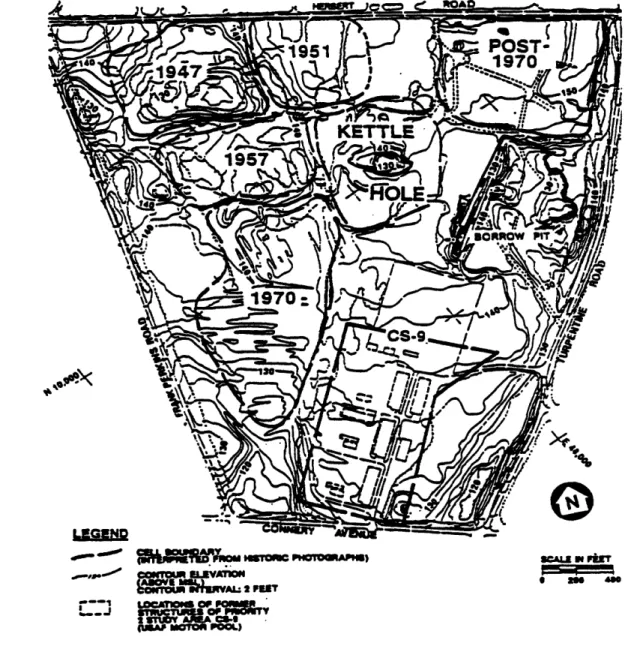
The landfill can be broken up into 6 distinct cells: 1947, 1951, 1957, 1970, post-1970, and Kettle Hole, as seen in Figure 2-3.
- ~WWlROM rT.C PHOMInAP")
ccw~lm roavxncm
RAbMA- 2 PISET2
LOCEFICIS
(UGA.eMUOL
SAL wei
0 1ffl m ,0
Figure 2-3 Location of Landfill Cells (CDM Federal Programs, 1995)
The cells are named for the date in which they were last used. The post-1970 cell ceased to be used in June 1989. The Kettle Hole is a naturally occurring formation which was used for dumping waste for many years. The highest activity at the base occurred from 1940-1946, when it was under Army control and from 1955-1970, when it was under Air Force control. It is believed that these times of highest activity coincided with the highest rate of waste generation and disposal. All of the information about the landfill was obtained from interviews of base employees during the preliminary records search (Hazwrap, 1987). This is the only source of information about the landfill since no written records were kept about waste disposal methods.
2.5.1 Landfilled Materials
Many of the base activities generated wastes. The main wastes that were produced and believed to have been disposed of in the landfill are listed in Table 2-1.
Table 2-1 Landfilled Materials (CDM Federal Programs, 1995)
Wastes
General refuse Herbicides Transformer oils Blank small arms ammunition
Paint thinners DDT powder Municipal sewage sludge
Fuel tank sludge Solvents
Fire extinguisher fluids Paints
Batteries Hospital wastes
Coal fly ash Possible live ordnance
These wastes are believed to have been disposed of by the trench method for landfilling, as indicated by recent waste disposal practices and the surface topography at the older cells. The waste was buried in linear trenches and covered daily with the soil that was excavated from the trench. (CDM Federal Programs, 1995)
2.5.2 Current Status of the Landfill
Since 1989, when waste disposal in the post-1970 cell was ceased, all MMR waste has been sent to the SEMASS incinerator in Rochester, MA for disposal. Small quantities of demolition debris are still disposed of in the Kettle Hole. (CDM Federal Programs, 1995) Currently, the landfill is mostly covered with vegetation native to the area.
The 1970, post-1970, and Kettle Hole cells have been capped to prevent any further contamination from migrating from the landfill. An alternate closure has been recommended for the 1947, 1951, and 1957 cells. Alternate closure involves leaving the waste in the cells intact beneath a vegetative cover and providing groundwater monitoring and landfill surface maintenance for thirty years. Post- closure management plans are being developed for these cells. (Leon, 1997)
2.5.3 Contaminant Plume Resulting from the Landfill
The landfill was identified as a potential contaminant source in 1979 when sampling at a drinking water well downgradient of the landfill demonstrated volatile organic carbon (VOC) concentrations exceeding drinking water standards (Metcalf &
Eddy, 1983). This discovery led to further sampling for the assessment of the nature and
extent of the contamination due to the landfill. Some sampling wells were placed within the boundaries of the landfill, but not directly within any of the cells, due to the possible presence of buried live ordnance in the landfill. The sampling determined that there is a
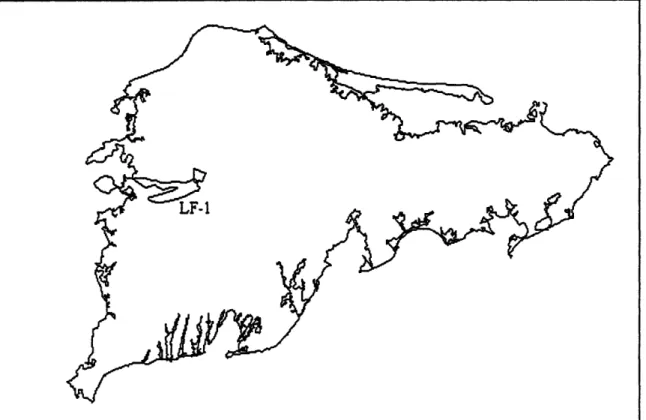
VOC plume that extends to the southwest of the landfill, beyond the MMR boundaries, as
shown in Figure 2-4.
Figure 2-4 Map of LF-1 Plume in Upper Cape Cod
The plume begins at a depth of 40 feet below the landfill. In October 1995 the LF-1 plume was measured to be approximately 16,500 feet long in the southwest direction,
6000 feet wide, and over 90 feet thick. By this same time over 22 billion gallons of
groundwater had been contaminated by the plume. The velocity of the LF-1 plume is estimated to be 544 feet/year. The main VOCs of concern in the plume are
trichloroethylene (TCE) and tetrachloroethylene (PCE). Carbon tetrachloride (CC14) has also been found in many of the wells, but not on a consistent basis. The VOC plume exceeds the Maximum Contaminant Levels (MCLs) of 5 parts per billion (ppb) for groundwater.
2.5.3.1 Current Status of LF-1
A groundwater extraction, treatment and reinjection (ETR) system was at 60% design for the LF-1 plume in January 1996, but was put on hold due to unacceptable groundwater pumping rates. The ETR pilot test system had been proposed by AFCEE for the southern lobe of LF-1, with a scheduled construction startup in June 1997 and system startup in March 1998. This project has now been indefinitely delayed. A recirculating well pilot test system was proposed by AFCEE for the northern lobe of LF-1. It was scheduled for construction startup in December 1996 and system startup in May 1997, but this project has also been indefinitely delayed. (Massachusetts Department of Environmental Protection, 1996)
Currently, no remedial actions are being implemented for the LF-1 plume. The nature and extent of the contamination require that a remediation system be installed as quickly as possible, to prevent further spreading of the plume. This thesis examines an in-situ bioremediation design scheme as an alternative to ETR and recirculating wells for the remediation of LF-1.
3. BIOREMEDIATION
3.1 Definition
Bioremediation involves the use of microorganisms to convert contaminants to less harmful species in order to remediate contaminated sites. Microorganisms usually degrade organic compounds to obtain energy that is conserved in the carbon-carbon bonds of the compounds, and to use the organic carbon as building blocks for new microbial cells.
3.2 Microorganisms
Bacteria, viruses, fungi, algae, protozoa, and metazoa are among the microorganisms that exist on earth. Microorganisms can be classified into two general categories of cell structure: eucaryotic or procaryotic. Eucaryotic microorganisms, which have a relatively complex cell structure, include fungi, algae, and protozoa. With a more simple cell structure, prokaryotic microorganisms include bacteria.
Protozoa and metazoa do not have important degradative roles, and are not usually considered for bioremediation applications. (Nyer, 1992) Fungi comprise a diverse group of organisms, such as molds, mildews, and mushrooms, but are predominately located in soil or dead plant material.
Bacteria have been on earth for 3 billion years. They are the most prevalent and diverse microorganisms on earth. Approximately 85% of bacterial existence to date
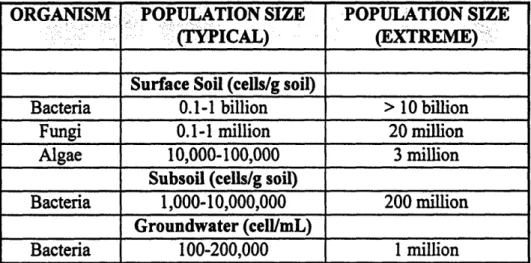
occurred before the continental plates began to separate, thereby providing the organisms with a long time to evolve, adapt, and disperse. (National Research Council, 1993) Bacteria have excellent adaptation and survival capabilities, which make them an ideal candidate for bioremediation, since the contaminated sites often have less than optimal conditions. These characteristics help to explain why bacteria usually outnumber the other organisms found in soil and groundwater, as shown in Table 3-1.
Table 3-1 Microorganism Population Distribution in Soil and Groundwater (Nyer, 1992)
ORGANISM POPULATION SIZE POPULATION SIZE
_
:_
_(TYPICAL)(EXTREME)
Surface Soil (cells/g soil)
Bacteria 0.1-1 billion > 10 billion
Fungi 0.1-1 million 20 million
Algae 10,000-100,000 3 million
Subsoil (cells/g soil)
Bacteria 1,000-10,000,000 200 million
Groundwater (cell/mL)
Bacteria 100-200,000 1 million
3.3 Environmental Requirements
In order for biodegradative processes to occur, the microorganisms require the presence of certain nutrients, electron acceptors, and substrates. Several other environmental conditions also affect the effectiveness of the microorganisms' degradative capabilities.
3.3.1 Nutrients
The molecular composition of the bacterial cell is an indicator of the bacteria's requirements for growth. Approximately 80-90% (by weight) of the cell is composed of water, which is therefore the main nutrient for the cells. Table 3-2 shows that the solid portion of the cell is composed mostly of carbon, oxygen, nitrogen, hydrogen, and phosphorus.
Table 3-2 Molecular Composition of a Bacterial Cell (Nyer, 1992)
Element Percentage of Dry Weight
Carbon 50 Oxygen 20 Nitrogen 14 Hydrogen 8 Phosphorus 3 Sulfur 1 Potassium 1 Sodium 1 Calcium 0.5 Magnesium 0.5
Chlorine
0.5
Iron 0.2 Others -~ 0.3The microbes derive carbon from the organic compounds they destroy. Oxygen and hydrogen are provided by the groundwater. The other major nutrients required by the microorganisms for growth and energy are nitrogen and phosphorus. The most common sources of nitrogen are ammonia and nitrates. Ammonia can be directly utilized for amino acid synthesis, while nitrates are reduced to ammonia and then assimilated into the synthesis. Phosphorus, mostly in the form of phosphates, is used by bacteria to synthesize
phospholipids and nucleic acids, as well as for the energy transfer reactions of adenosine triphosphate (ATP). An adequate supply of these nutrients must be available to the microorganisms for the bioremediation process to be effective.
3.3.2 Electron Acceptor
In order for microorganisms to transform nutrients to forms that are useful for incorporation into cells and synthesis of cellular material, microorganisms need a source of energy. Microbes derive much of their energy from oxidation- reduction reactions, where a transfer of electrons from an electron donor to an electron acceptor occurs, thereby resulting in the release of energy. Figure 3-1 demonstrates the common utilization of organic contaminants as the electron donor.
Organic
Contaminant
Figure 3-1 Utilization of the Organic Contaminant for Energy and Cell Production (National Research Council, 1993)
There are a number of different compounds that can act as electron acceptors, including oxygen (O2), nitrate (NO'), iron oxide (Fe(OH)3), sulfate (SO4"2), and carbon dioxide
(CO2). Aerobic bacteria can only utilize oxygen as an electron acceptor, while anaerobic
bacteria use the other compounds as electron acceptors. Oxygen is the optimal electron acceptor because microorganisms can derive the most energy from oxidation-reduction reactions with oxygen. Sulfate and carbon dioxide provide the least amount of energy to the microbes. Figure 5-1 illustrates the difference in electron acceptors.
3.3.3 Substrate
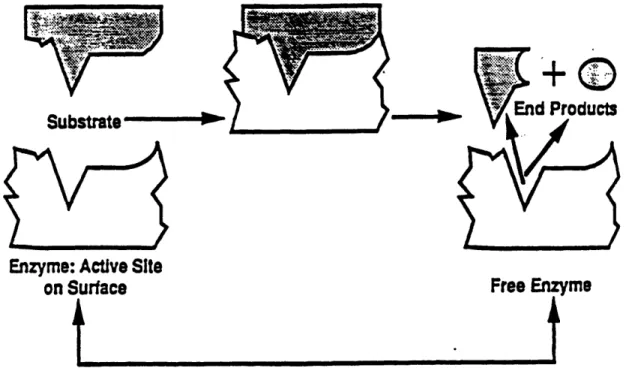
Electron donors which participate in microbe-catalyzed oxidation-reduction reactions are also called substrates. Reactions are catalyzed when the substrate collides and binds to the active site of an enzyme. Enzymes are proteins, produced by the bacteria, which perform highly specific reactions. A bacterial cell contains approximately 1000 enzymes. (Nyer,1992) Substrate activation allows for the enzyme to react and produce products and restore the enzyme. Enzyme reactions can be understood with the lock and key representation.
Substrate
Enzyme: Active Site
on Surface
Free Enzyme
Figure 3-2 Enzyme Reactions as "Lock and Key" (Nyer, 1992)
Figure 3-2 shows how only an enzyme with the right shape can function as a key for the oxidation-reduction reactions. Although it is not shown on Figure 3-2, the fit between the enzyme and substrate must be three-dimensional and precise.
When microorganisms consume a compound to satisfy its energy and cell growth needs, the compound is considered a primary substrate. This is the usual process for organic decomposition in nature. However, in the environment, the microorganisms will not directly utilize organic compounds that do not provide them with significant energy for growth. However, some of these organic compounds can be biotransformed by microorganisms as secondary substrates through a process known as cometabolic transformation, which is explained in sections 5.2 and 5.3.
3.3.4 Other Environmental Conditions
There are other factors which will affect the biodegradation process, including temperature, pH, and the concentration range of the contaminant.
3.3.4.1 Temperature
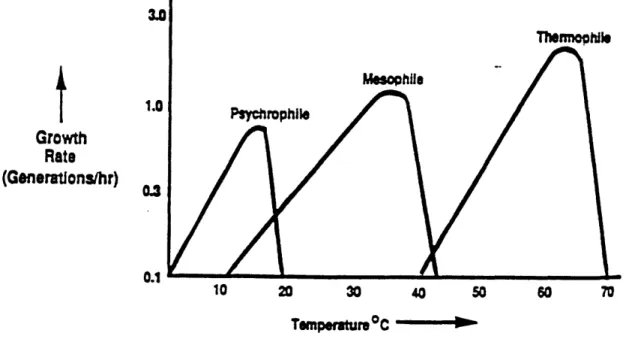
Temperature is an important microorganism growth factor. Every microorganism has a minimum temperature below which growth does not occur, a maximum temperature above which the proteins and cellular components of the microbes will become inactivated, and an optimum temperature at which growth is the most rapid. There are three categories of bacteria, thermophiles, mesophiles, and psychrophiles, which thrive at different temperatures, as shown in Figure 3-3. Microorganisms that are cultivated in aquatic environments are mostly mesophiles, which grow in a range of 10"C to 45TC.
3.0
4
1.0
GrowthRate
(Generations/hr) 0.3 .0. 10 20 30 40 50 60 70 Temp•rmtureocWhen designing a bioremediation scheme, it should be noted that since these microbes can grow at a wide range of temperatures, large temperature fluctuations pose a greater threat to biological activity than the maintenance of a particular temperature.
3.3.4.2 pH
The optimal pH for microbial growth is dependent on the specific microorganisms and their biological pathways. Many enzymes can only be produced by microbes in the proper pH range. Aerobic microorganisms are usually able to tolerate a wider pH range, whereas many anaerobic bacteria grow efficiently in a very narrow pH range. The optimal pH for bacteria in groundwater is between 6.5 and 7.5, values which are close to their intracellular pH. (Nyer, 1992)
3.3.4.3
Concentration Range of Contaminant
When contaminants in the groundwater are secondary substrates, whereby the contaminant and the primary substrate are degraded by the same enzyme, the contaminant and primary substrate can compete for the enzyme's active sites. This process, known as competitive inhibition, will occur if the contaminant concentration is too high. The maximum allowable concentration for no inhibition depends on the specific compound, but ranges between 10 mg/L and 100 mg/L for chlorinated compounds. (Kerr, 1994) High primary substrate concentrations have also been found to significantly inhibit the degradation of contaminants, as explained in section 8.2.3.
3.4 In- Situ Bioremediation
In-situ bioremediation of contaminants in groundwater allows for the on- site destruction of contaminants. The in-situ system, depicted in Figure 3-4, typically consists of extraction wells, where the extracted groundwater is treated with substrate. electron acceptor, and nutrients, and injection wells which are used to reinject the treated water.
ScOur= Nutrients Gound.WaLer Gradt 'W GWW --GrCmd-Waft Tratment
-i
M Ionng WellNknimoing Well
Iw m m mrýW Soil ContammationW
Recovery WellFigure 3-4 Typical Bioremediation Scheme in the Saturated Zone (Kerr, 1994)
3.4.1 Advantages over Remedial Alternatives
In-situ bioremediation has the potential to provide a more effective and inexpensive alternative to traditional remediation methods. It can completely destroy the contaminant rather than transfer it to another medium, which is common in re=ediation
r
I r
technologies like air stripping. It typically requires less treatment time than pump-and-treat remediation. It also offers the opportunity to use the subsurface as a bioreactor, whereby the necessary bioenhancers are injected into the contaminated groundwater and the remediation occurs in the aquifer, which eliminates the need to pump large quantities of water to the surface.
4. CHARACTERIZATION OF THE LF-1 PLUME
4.1 Plume Characterization
In order for bioremediation of the contaminants to occur, microorganisms require the presence of certain substances and conditions. Examination of the characteristics of the LF-1 plume will determine what additional substances and conditions are needed to stimulate or enhance bioremediation.
4.2 Spatial Distribution of Contamination
The two main contaminants of concern at LF-1 are tetrachloroethylene (PCE) and trichloroethylene (TCE). As Table 4-1 shows, both contaminants are present at levels which significantly exceed Maximum Contaminant Levels (MCLs).
Table 4-1 Contaminant Maximum Concentrations and MCLs (CDM Federal Programs Corporation, 1995)
COMPOUND
MAXIMUM DETECTED (pg/L)
MCL
_1_gfL)
PCE 65 5
TCE 64 5
The TCE and PCE isoconcentration contour maps (Figures 4-1 and 4-2) provide the spatial distribution of the contaminants in the LF-1 Plume. The PCE plume contains three areas of highest measured concentration, located at monitoring wells GB22, MW35, and MW103, with average concentrations of 30 jg/L, 48 pLg/L and 65 pg/L, respectively. The TCE plume contains three areas of highest measured concentration, located at
monitoring wells MW37A, MW38, and MW31, with average concentrations of 19 lag/L. 26 ýtg/L, and 64 ipg/L, respectively.
4p brr nnrsurm
* FI~ mpr y fiu - w ra0mr
Figiurc 4-1 II'CE Isoconlccntrationl Contour Malp (CI)M Fcdcrnl Progrlams Corporation, 1995)
30
~LY
NOTES: S4LC1TD CItOA#4ALtD rr~ gIjM ~~itLxDw KEY OVERHEAD ELECTRIC POWER LINES I' alawnm pe -, inmcoeen s* e
Figure 4-2 TCE Isoconcentration Contour Map (CDM Federal Programs Corporation, 1995)
4.3 Spatial Distribution of
Nutrients
The only available nutrient data demonstrates the distribution of nitrate throughout the plume. Since no phosphate data is available, it will be assumed that the plume is depleted of phosphorus, for design purposes. Further design modifications would require a detailed analysis of background phosphorus concentrations in the plume. Most of the plume has a sufficient supply of nutrients in the form of nitrate, with only ten, out of seventy four, monitoring wells measuring non-detectable levels. The detectable concentration of nitrate is shown in Table 4-2 to range between 0.07 mg/L (at MW-22) and 1.20 mg/L (at MW-35). This conceptual design assumes that the background concentration of nitrate remains constant, so that a nitrogen source is only added to locations where the background levels are below the requirements of the bacteria, which are indicated in section 6.5.
Table 4-2 Nitrate Values for LF-1 (OPTECH, 1996a)
Nitrated
Well Nttrite
Site Nwnber (mOtI)
Up'grdient f Fence I LF.I MW.707 Wel Fence I LF-I MW-17A LF-I MW.17B LF-I MW-19 0.09 Well Fence 1.1 I..I LE-1 IE-I LF-I LFI.1 CS-9 CS-Ia CS-la LF I LF-I LF. MW-9 MW-20A MW.208B MW-O0C MW-20Z : MW-I MW-35 MW.36 MW-61 MW.-71 MW-705 ND 0.27 0.10 0.60 0.22 0.85 0.09 0.23 ND ND 0389 Well Fence 1.2 CS-10 MW-48 L.lI MW.701A Well Fenc 2 LI.1 MW.22A LF-I MW-23 .LF-I MW-24A LF.I MW-24B LF-I MW-32 LF-I MW-33 LF-I MW-34 0.25 0.25 0.07 0.77 ND ND 0.60 0.48 0.78 Nitram/ Well Nltrite Site Nmnber (m•nl)
Well Fence 2 (co•.)
LF1- WT-25 CS-10 MW-42A CS-10 MW-42B CS-10 MW42C LF-I MW.103A LF.I MW-103B LF-I MW-t03Z LF-1 MW.104A LF.I MW-104B
Between Fences 2 & 3
LF-I MW-25 LF-I MW-25A LF-I MW-26 LF-. MW-28Z LF-I MW-29 LF-I MW.31A LF-I MW.31B LF-I MW.31C LF.I MW-601A LF-I MW-601B LF. MW.601C LF-I MW-602B LF.I MW-602C Well Fence .F-I MW.35 LF-I MW-36B LF-I MW-37A LF-I MW-43 LF.I 0G-22 LFl.I WT-26 0.46 ND 0.42 033 0.46 0.23 0.14 0.60 0.54 0.J8 0.96 0.32 030 0.13 0.23 0.03 0.08 0.70 0.47 0.59 1.10 0.67 0.19 1.20 0.92 030 0.80 0.21 ND se Well itrtt
Site Nmiber (mi,)
Well Fence 4 LF*I GB-20 LF-I MW-38 LF-I MW-38A LF-I MW-38Z LF-I MW.39A LF-I MW-40 LF-1 MW-40A LF-I MW-l4 LF-I MW-.4 LF-I MW-S5 LF-I MW.47 0.36 ND 0.72 0.18 0.29 0.23 0.75 029 032 0.71 0.47 Between Fences 4 & 5
LF.I MW-6 0.62 LF-I MW-46A 0.13 Well Fence 5 LE-I LE-I LF-I LF-I LF-l LF-I MW-50A MW-50B MW-51 MW-52 MW-53 MW.54 0.62 0.40 0.62 059 0.37 037 Other Wells LF-I LF-I WT-28 WT.29 _ __ II I- , ,I I i r
4.4 Spatial Distribution of Oxygen
The plume overall is fairly aerobic, with values ranging from non-detectable to approximately 10 mg/L. For design purposes, the wells which do not have measured dissolved oxygen levels will be considered anaerobic, however a more detailed design will require the assessment of oxygen levels at those locations. The spatial distribution of dissolved oxygen is illustrated in Figure 4-3; additional dissolved oxygen data from monitoring wells is shown in Appendix A.
Figure 4-3 Spatial Distribution of Dissolved Oxygen and Other Parameters (OPTECH, 1996a)
4.5 Spatial Distribution of Substrates
The only primary growth substrate that has been detected in the plume is toluene, which was present in low concentrations (0.15 pg/L to 7.1 gg/L) at a few wells. (CDM Federal Programs Corporation, 1995) Other substrates, including phenol, were not detected. Based on this information, the design will be developed with the assumption that there is no primary substrate present in the plume.
4.6
Spatial Distribution of
Microorganisms
In this bioremediation design of the LF-1 plume, it is assumed that there is a viable microbial population in the groundwater, and the bacteria are the main source of microorganisms in the aquifer. The assumption of viability is valid, given that historically less than 1% of sites have been found to lack a viable microorganism community capable of biodegrading a wide range of hydrocarbons. (Kerr, 1994)
4.7 Spatial Distribution of Temperature and pH
The temperature in the plume ranges between 10*C and 20*C, which is within the temperature range recommended for optimal bioremediation. (See Section 3.3.4.1) The pH of the plume ranges between 5.5 and 7, which is in the optimal range for the microorganisms to perform the biodegradation processes. (See Section 3.3.4.2) Figure 4-3 illustrates the spatial distribution of temperature and pH in the LF-1 plume.
5. SEQUENTIAL ANAEROBIC/ AEROBIC DEGRADATION
OF CHLORINATED SOLVENTS
5.1
Biodegradation of Organic Compounds
Organic compounds can be biotransformed by microorganisms through two main processes: (1) primary substrate utilization or (2) cometabolism. When the organic compound is used as a primary substrate, the microorganism consumes the compound because it derives food, in the form of organic carbon, and energy, in the form of reduction-oxidation reactions, from the process. The microorganisms convert the compound into harmless products, primarily CO,, cell mass, inorganic salts, and water. The microorganisms are driven to degrade the organic compounds due to their need for utilizing reduced forms of nutrients for nutrient incorporation into cells and for the synthesis of cell polymers. The reduction of nutrients requires energy and electrons, which the microorganisms acquire from the degradation of organic compounds. When the organic compound is utilized as a primary substrate, it becomes the electron donor in a reduction-oxidation reaction involving a terminal electron acceptor, which can differ depending on whether or not the conditions are aerobic or anaerobic, as demonstrated by Figure 5-1.
1.0 -Aerobic
(Oxygen
as
(
0o,+4H+
+
4.- -
2H
2
ctionn Acceptor) 2NO; + 12H+ +10e -+ N2 + 6H20>
0.5 -
MnO
2
(s)
+ HCO,
+
3H
+
2e
-I<
-
IMnCO
3(s)
+2H
20
E
=
So +0
-
FeOOH(s) + HC +
2H
2H+
'
-+
FeCO3(s) + 2H20 - SO' + 9H+ + 8e HS' + 4H 0CCO.
+8H+ + 8es -+
CH4 + 2H2 C 0 C= C 0 C C= ilTypicalPrinmary
Substrates
2C02
+ 8H +
8e-
-
CH
3
COOH
+ 2H
2
0
(Elecron onors) 2H* + 290 -+ H2
Figure 5-1 Important Electron Acceptors in Primary Biotransformations (Kerr, 1995) This transfer of electrons provides energy for the reduction of nutrients and the resulting synthesis of cellular material or incorporation into cells. The following is an example of an organic compound, benzene, being used as a primary substrate for growth by microorganisms, which was illustrated in Figure 3-1:
C6H6 +
7.5 0
26
CO
2+
3
H20In the above example, 02 is the terminal electron acceptor and CsH702N is the
synthesized cellular material. A portion of the organic contaminant is used as a primary energy source that is converted to end products, and another portion is used to synthesize the cellular material.
Few chlorinated aliphatic hydrocarbons are utilized by microorganisms as a primary growth substrate. Table 5-1 illustrates that dichloromethane (CH2CI2), 1-2
dichloroethane (CH2C1CH2C1), chloroethane (CH3CHC1), and vinyl chloride
(CH2=CHCI) are the few exceptions which have been shown to be available as primary
growth substrates.
Table 5-1 Potential for Chlorinated Aliphatic Hydrocarbon Biodegradation as a Primary Substrate or Through Cometabolism (Kerr, 1994)
Primary Substrate Cometabolism
Compound Name Chemical Aerobic Anaerobic Aerobic Anaerobic
Formula Potential Potential Potential Potential
Carbon Tetrachloride CCI4 0 XXXX
Chloroform CHCl3 X XX
Dichloromethane CH2Cl2 Yes Yes XXX
Trichloroethane CH3CCl3 X XXXX
1,1 Dichloroethane CH3CHCI2 X XX
1,2 Dichloroethane CH2CICH2CI Yes X X
Chloroethane CH3CH2CI Yes XX
Tetrachloroethylene CC12=CC12 0 XXX
Trichloroethylene CHCI=CC12 XXX XX
Dichloroethylene CHCI=CHCI XXX XX
1,1 Dichloroethylene CH2=CCI2 X XX
Vinyl Chloride CH2=CHCI Yes XXXX X
These findings suggest that only the less chlorinated compounds are used by microorganisms for energy and growth. The majority of chlorinated aliphatic hydrocarbons are biodegraded by the second process, known as cometabolic degradation.
5.2 TCE: Aerobic Cometabolic Degradation
Cometabolic degradation occurs when a compound is inadvertently degraded by an enzyme that is produced by the microorganism for other purposes. It is a fortuitous process since the microorganisms derive no direct benefit from the degradation, and it might even be harmful to them. Many common chlorinated contaminants in the groundwater can be cometabolically biodegraded.
Even though trichloroethylene (TCE, CCI,=CHCI) can not serve as a primary growth substrate, it can be cometabolically transformed by methanotrophic bacteria, microorganisms that oxidize methane for energy and growth. The reaction occurs in an aerobic environment, where TCE is the electron donor and 02 is the terminal electron acceptor. When the primary growth substrate methane is available to the bacteria, the bacteria will produce an enzyme called methane monooxygenase (MMO) which catalyzes the initial oxidation of methane to methanol, as shown in Figure 5-2. Energy is derived from that reaction and new enzymes are formed to drive the oxidation process to continue, whereby formaldehyde, formate, and ultimately carbon dioxide is produced.
CELL CONSTITUENTS
£1 t2 E EA
CH4 CH 7 N 1HCHO " N HC00Hn CO: * H20
NADH NAD X XH NAD NADH NAD NA NADHH
El - METHANE MONOOXYGENASE (E : METHANOL DEHYOROGENASE OR
ALCOHOL OxiDASE
Et : FORMALDEHYDE DEHYDROGENASE
4 : FORMATE DEHYOROGENASE
x x A PROTON AND ELECTRON CARRIER
Figure 5-2 Pathway for the Methanotrophic Utilization of Methane (Semprini et al, 1991a) The MMO enzyme has a low substrate specificity and is therefore capable of initiating the oxidation of many halogenated compounds, including TCE. MMO is a dinuclear iron enzyme which catalyses the conversion of TCE into an epoxide by breaking its own oxygen-oxygen bond and inserting one oxygen molecule into a carbon-hydrogen bond. Figure 5-3 demonstrates the epoxidation process of TCE by MMO.
'YFe, OH
IYFe-'10
IVFeOH0
IIIFe, OH IIIFe' C•I j HCI IIIFe, C III'Fe H IIIF e'O Fe CH I •poxidation OH iIiFe•' CI CI HFigure 5-3 Epoxidation of TCE in Cometabolic Degradation (University of Minnesota Biocatalysis/Biodegradation Database, 1997)
The epoxidation of TCE by MMO is followed by the abiotic hydrolysis of the highly unstable epoxide into nonvolatile compounds, as shown in Figure 5-4.
0 T C E epode
T CE eposide
methane monooxygenase 2 H2 O0 2 M11 Cl 0 CI O 5% Dichloroacetate CO 53% 35% Formate + 0 0 5%Glyoxylate
Figure 5-4 Abiotic Hydrolysis of the TCE epoxide in Cometabolic Degradation (University of
Minnesota Biocatalysis/Biodegradation Database, 1997)
Finally, the compounds are biotically degraded to CO2
,
chloride, and water. In otherwords, microorganisms derive energy from these intermediates by forming specific
enzymes to degrade them. Figure 5-5 demonstrates the pathway of one of the
intermediates. The ability of the bacteria to obtain energy from these compounds indicates that they might serve as substitutes for methane to drive the cometabolism of
TCE. o formate dehydrogenase
CO2
Formate NAD+ NADHFigure 5-5 Heterotrophic Degradation of Intermediate as the Final Step in Cometabolic Degradation (University of Minnesota Biocatalysis/Biodegradation Database, 1997)
Most of the work seen in literature and experiments to date has been devoted to the cometabolism of TCE using methanotrophs. However, in addition to methane-oxidizing bacteria and the intermediates described above, there are numerous other types of substrates that have been found to catalyze the cometabolic degradation of TCE and other chlorinated compounds, including phenol, propane, ethylene, toluene, cresol, ammonia, isoprene, and vinyl chloride. (Kerr, 1994)
Several recent research projects have determined that phenol-utilizing bacteria are more effective than methanotrophic bacteria for the cometabolic transformation of TCE. (Kobus, 1996) In a similar manner to methane, phenol (hydroxybenzene) is oxidized to dihydroxybenzene, which is transformed to products used for cell synthesis and energy and, ultimately, to CO2
.
For cometabolism to occur, an active population of microorganisms having the cometabolizing enzymes must be present. Therefore it is important to have the proper growth substrate available to the microorganisms in order for the enzymes to be produced.
5.3 PCE: Anaerobic Cometabolic Degradation
Aerobic cometabolic degradation is not effective on saturated chlorinated aliphatic hydrocarbons like tetrachloroethylene (PCE, CC12=CC12), where the organic
compound is completely chlorinated. The oxygenase enzyme produced for cometabolism reacts with unsaturated chlorinated compounds like TCE by adding oxygen to a C-H bond to form an epoxide, a highly unstable intermediate that further degrades to harmless
products. With a saturated compound like PCE, the oxygenase will add the oxygen to the
C-Cl bond, and substitute a chlorine group with a hydroxyl group, resulting in the
formation of trichloroethanol, a chemically stable and toxic compound (CCIlCCIOH). In general, the less chlorinated the compound is, the more susceptible it is to aerobic degradation. Conversely, as Figure 5-6 shows, the more chlorinated compounds such as PCE are effectively degraded with another cometabolic process, known as reductive dechlorination. o 6. -0U o o Degree of Chlorination Monochlorinated -- Polychlorinated ca--sa 0.25 -4
Figure 5-6 Relationship between Degree of Chlorination and Aerobic and Anaerobic Degradation
Rates (Kerr, 1994)
In an anaerobic environment, highly chlorinated aliphatic hydrocarbons, such as
PCE, are degraded to less chlorinated compounds by reductive dechlorination. Reductive dechlorination occurs when anaerobic bacteria produce an enzyme to react with a primary
growth substrate, which then fortuitously catalyzes the reductive dechlorination of PCE. In the reaction, PCE acts as the electron acceptor, whereby a chlorine atom is replaced with a hydrogen atom, and the primary substrate acts as the electron donor. Many different electron donors have been shown to be effective in reducing PCE, including lactate, methanol, hydrogen, formate, acetate, and glucose. (Kerr, 1994)
One microbial system (DiStefano et al, 1991) which showed complete transformation of PCE to ethene (C2H4) involves the use of methanol as the primary
electron donor and ammonium and phosphate as nutrients for the bacteria. The stoichiometric relationships for this system are as follows:
C2C14 (PCE) + 1.33CH3OH (methanol) + 1.33H,O - C2H4 (ethene) + 4HCI + 1.33CO,
3CH OH + 2.25HCO0' a 2.25CH3COO (acetate) + 0.75CO, + 3.75H20
2.25CH3C0 + 0.056NH4+ + 2.02H20 + 0.083CO2 -- 0.056C5H,7 N (biomass) + 2.1 1CH4
+2.19HCO3-Although the phosphorus requirement is not shown in the above equations, phosphorus, in the amount of approximately one-sixth of the nitrogen requirement, was added to the system. This system produced high rates of PCE degradation to ethene, up to 275 jimol/(L*day). Further microbiological studies are necessary to better understand this system. Unlike the methanotrophic bacteria which help to degrade TCE, the bacteria and the enzyme chemistry which contribute to the reductive dechlorination of PCE have yet to be identified.
5.4 Combination of Anaerobic and Aerobic Processes
Anaerobic microorganisms are effective in reducing highly chlorinated compounds to less chlorinated compounds. However, as the number of chlorine atoms on a compound decreases, reductive dechlorination reactions become more limiting, and aerobic oxidation reactions become more favorable. Reductive dechlorination alone would result in the accumulation of monochlorinated, dichlorinated, and other hydrocarbon compounds.
The complementary capabilities of aerobic and anaerobic bacteria can be utilized to effectively degrade PCE and TCE to harmless products. As demonstrated in Figure
5-7, a design of sequential anaerobic and aerobic biozones would allow the plume
contaminated with TCE and PCE to first travel through the anaerobic biozone, where the PCE is degraded to less chlorinated compounds, followed by the aerobic zone, where the products of the incomplete dechlorination and TCE are oxidized to CO2, H,O, and Cl'. In order for cometabolism to occur, the proper growth substrates, nutrients, and electron acceptors/donors must be present in each biozone.
PCE
PCETCE
CO,
ANAEROBIC BIOZONE TCEAEROBIC BIOZONE
TCE Other Less H,O
Chlorinated Cl'
Compounds
6. DEVELOPMENT OF CONCEPTUAL DESIGN
6.1 Basis for Conceptual Design
Since bioremediation is still a new technology, there are very few standard requisites for the design of a bioremediation system. Therefore the conceptual design for the bioremediation of chlorinated solvents in the LF-1 plume will be constructed on the basis of results from different laboratory and field experiments which also apply to the conditions at LF-1. Once the conceptual design is completed, pilot tests based on the design can be implemented, and the results of the pilot tests will help to develop a more detailed bioremediation design.
6.2 Substrate Requirement
There have been many experiments performed to determine the substrate concentration necessary for the degradation of contaminants. For the utilization of methane as a primary growth substrate, one study determined that approximately 2 mg/L of methane is required to treat 10 pjg/L of TCE, while 6.5 mg/L of methane is required to degrade 100 gg/L of TCE. (Chang and Alvarez-Cohen, 1995) This estimation will be used to specify the necessary injection concentration of methane at the wells. Since this concentration range is safely below the solubility of methane in water (22 mg/L at 200C),
the injection of methane solution is feasible for this design.
Methanol is a substrate that has been demonstrated to successfully biotransform PCE with one of the highest reported reductive dechlorination rates. (DiStefano, 1991)
According to the stoichiometry of the microbial system (section 5.3), 4.3 moles of methanol is required to degrade 1 mole of PCE completely to ethene. This molar requirement takes into account the whole microbial system referred to in section 5.3. A portion of the methanol requirement therefore corresponds to the methanol required by the bacteria to form cell material (biomass). This estimation will be used to specify the necessary injection concentration of methanol at the wells. Since methanol is completely soluble in water at 20*C, the injection of methanol is feasible for this design.
6.3 Oxygen Requirement
A steady supply of oxygen is necessary to maintain the aerobic biozones in the
conceptual design. In bioremediation systems for petroleum hydrocarbons, first approximations of oxygen requirements are typically based on a 3:1 weight ratio of oxygen to organic carbon, or approximately a 1:1 molar ratio. (Kerr, 1994) The sources of organic carbon include PCE, TCE, and the injected methane. Since TCE is present at concentrations significantly lower than the injected methane (see Table 7-1 for the injection concentrations of methane), the oxygen required to degrade TCE is negligible compared to the amount of oxygen needed to degrade methane. As a result, methane is considered to be the limiting organic carbon which will determine the oxygen requirement in this design:
Even though the stoichiometry requires a 2:1 molar ratio of oxygen to methane, a 3:1 molar ratio of oxygen to organic carbon will be utilized in this conceptual design because experience with bioremediation has shown that some of the oxygen can be consumed by other reactions or is lost by inefficient distribution, which results in a required ratio that is usually higher than the stoichiometric requirement. (Kerr, 1994)
Sources of oxygen that may be used include air, which is approximately 20% oxygen, pure oxygen, which is industrially produced oxygen with a typical purity of 90% or greater, and hydrogen peroxide, which is dissociated into oxygen and water. By aerating water, a dissolved oxygen concentration of approximately 8 mg/L can be achieved. Sparging pure oxygen into water can deliver approximately 40 mg/L of dissolved oxygen. Hydrogen peroxide can provide as much as 47 mg/L of dissolved oxygen. (National Research Council, 1993)
6.4 Bacteria
The conceptual design will assume that the concentration of bacteria is not a limiting factor in the bioremediation. Since bacteria typically produce 10-20 pounds of bacteria per 100 pounds of organic carbon consumed, it is acceptable to assume that the source of bacteria for degradation will not be depleted as long as methane and methanol are injected into the plume. (Nyer, 1992)
6.5 Nutrient Requirements
For the aerobic biozones, nutrient requirements are calculated on the basis of all the methane being converted to cell material, which is approximated by a weight ratio of carbon to nitrogen to phosphorus of 100:10:1. (Kerr, 1994) This is typically a conservatively high estimate for the nutrient requirements since some of the methane might be directly converted to carbon dioxide and water.
For the anaerobic biozones, nutrient requirements will be calculated with the stoichiometry provided in the microbial system (Section 5.3). The weight ratio of methanol carbon to nitrogen to phosphorus is 1046:6:1. It is important to note that these nutrient requirements are specific to the microbial system discussed in Section 5.3, and might not be applicable to other anaerobic systems, especially since the type of microorganism(s) involved in these reactions are unknown.
6.6 Analytical Models
Analytical equations were used to develop the design for the injection wells and determine the total time of bioremediation. It was decided that analytical equations are sufficient to create a preliminary, conceptual bioremediation design, which is the aim of this project.
6.6.1 Injection Wells
Analytical equations derived by Welty and Gelhar (1994) quantify the behavior of a solute which is injected at a recharge well. Although the intent of these diverging flow
equations was to evaluate longitudinal dispersivity from tracer tests, they are also useful in determining other unknown parameters, given a known longitudinal dispersivity. The equation assumes that the injected solute is conservative, and that the dispersivity, aquifer thickness, and injection rate are all constant. It also assumes that there is radial flow away
from the well. The equation for solute concentration in diverging flow is expressed as:
S-
erfc
,(6-1)
r2
where = CR / Ciet ,
CR
=
the concentration of the injected solute at a radial distance R from the
injection well,
Cm,•
=
the injection concentration at the well,
t=t/tm, t = time, tm= R2 / (2*A), A= Q / (2*x*rl*b), Q = injection flowrate, l = aquifer porosity , b = aquifer thickness,c = longitudinal dispersivity of aquifer.
This equation will give the relationship between the desired radius for a biozone, R, the time it will take for that biozone to be established, t, the injection rate needed to establish and maintain that biozone, Q, and the injection concentration required (Ci.j) to attain a minimum concentration at the edge of the biozone, CR. The spreadsheet calculations of these variables are in Appendix C and the results of these calculations are in Table 7-2.