Economics of Adaptation to Climate Change
E C O N O M I C S O F A DA P TAT I O N TO C L I M AT E C H A N G E
ii
EACC Publications and Reports
1. Economics of Adaptation to Climate Change: Synthesis Report 2. Economics of Adaptation to Climate Change: Social Synthesis Report
3. The Cost to Developing Countries of Adapting to Climate Change: New Methods and Estimates
Country Case Studies:
1. Bangladesh: Economics of Adaptation to Climate Change
2. Bolivia: Adaptation to Climate Change: Vulnerability Assessment and Economic Aspects 3. Ethiopia : Economics of Adaptation to Climate Change
4. Ghana: Economics of Adaptation to Climate Change 5. Mozambique: Economics of Adaptation to Climate Change 6. Samoa: Economics of Adaptation to Climate Change 7. Vietnam: Economics of Adaptation to Climate Change Discussion Papers:
1. Economics of Adaptation to Extreme Weather Events in Developing Countries 2. The Costs of Adapting to Climate Change for Infrastructure
3. Adaptation of Forests to Climate Change
4. Costs of Agriculture Adaptation to Climate Change 5. Cost of Adapting Fisheries to Climate Change
6. Costs of Adaptation Related to Industrial and Municipal Water Supply and Riverine Flood Protection
7. Economics of Adaptation to Climate Change-Ecosystem Services
8. Modeling the Impact of Climate Change on Global Hydrology and Water Availability 9. Climate Change Scenarios and Climate Data
10. Economics of Coastal Zone Adaptation to Climate Change
11. Costs of Adapting to Climate Change for Human Health in Developing Countries 12. Social Dimensions of Adaptation to Climate Change in Bangladesh
13. Social Dimensions of Adaptation to Climate Change in Bolivia 14. Social Dimensions of Adaptation to Climate Change in Ethiopia 15. Social Dimensions of Adaptation to Climate Change in Ghana 16. Social Dimensions of Adaptation to Climate Change in Mozambique 17. Social Dimensions of Adaptation to Climate Change in Vietnam
18. Participatory Scenario Development Approaches for Identifying Pro-Poor Adaptation Options 19. Participatory Scenario Development Approaches for Pro-Poor Adaptation: Capacity
Economics of Adaptation
to Climate Change
VIETNAM
Ministry of Foreign Affairs Government of the Netherlands
E C O N O M I C S O F A DA P TAT I O N TO C L I M AT E C H A N G E
ii
© 2010 The World Bank Group 1818 H Street, NW
Washington, DC 20433 Telephone: 202-473-1000 Internet: www.worldbank.org E-mail: feedback@worldbank.org All rights reserved.
This volume is a product of the World Bank Group. The World Bank Group does not guarantee the accuracy of the data included in this work. The boundaries, colors, denominations, and other information shown on any map in this work do not imply any judgment on the part of the World Bank Group concerning the legal status of any territory or the endorsement or acceptance of such boundaries.
RIGHTS AND PERMISSIONS
The material in this publication is copyrighted. Copying and/or transmitting portions or all of this work without permission may be a violation of applicable law. The World Bank Group encourages dissemination of its work and will normally grant permission to reproduce portions of the work promptly.
For permission to photocopy or reprint any part of this work, please send a request with complete information to the Copyright Clearance Center Inc., 222 Rosewood Drive, Danvers, MA 01923, USA; telephone 978-750-8400; fax 978-750-4470; Internet: www.copyright.com.
All images © The World Bank Photo Library, except Pages 28, 40, 72, and inside back cover © Shutterstock
Acronyms vii
Acknowledgments ix
Executive Summary
xi
1 Introduction
1
2 Projections of Climate Change and Sea Level Rise
5
Regional Projections 5
National Projections 6
Climate Scenarios 9
3 Agriculture
11
The Impact of Climate Change on Crop Production 15
The Macroeconomic Consequences of Climate Change 19
Adaptation to Climate Change 22
Macroeconomic Effects of Adaptation 26
4 Aquaculture
29
The Growth of Aquaculture in Vietnam 29
The Impact of Climate Change on Aquaculture 32
Economic Analysis of Adaptation 37
5 Forestry
43
The Impact of Climate Change on Forests 44
Adaptation Measures in the Forestry Sector 51
6 Adaptation at the Local Level: Social Analysis
55
Social Vulnerability to Climate Change 55
Adaptation to Climate Change at the Local Level: A Social Analysis 66
Contents
E C O N O M I C S O F A DA P TAT I O N TO C L I M AT E C H A N G E
iv
7 Coastal Ports
73
Coastal Ports and Sea Level Rise 73
Adaptation Costs and Options 75
8 Lessons Learned
77
References
80
Annexes
(available on line at www.worldbank.org/eacc)
Tables
ES-1. Regional Vulnerability to Climate Change xii
ES-2. Change in Crop Production in 2050 due to Climate Change with No Adaptation xiv ES-3. Macroeconomic Effects of Climate Change Without/with Adaptation in 2050 xv 1. Projected Climate Change for Southeast Asia, 2080–99 against 1980–99 5 2. Projected Increases in Annual Average Temperatures relative to 1980–99 7 3. Projected Changes in Annual Rainfall relative to 1980–99 7
4. Projected Sea Level Rise in Vietnam 7
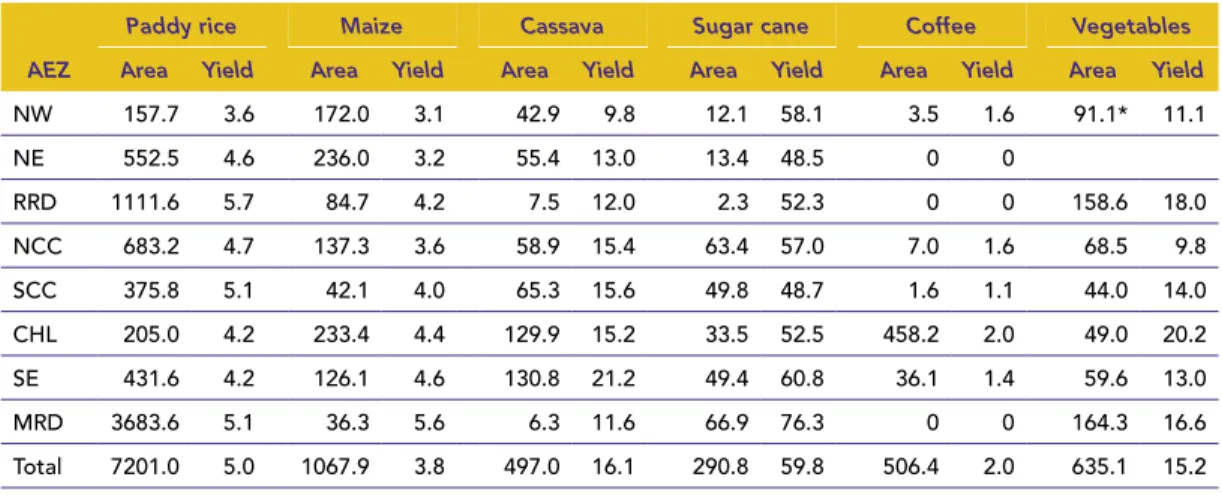
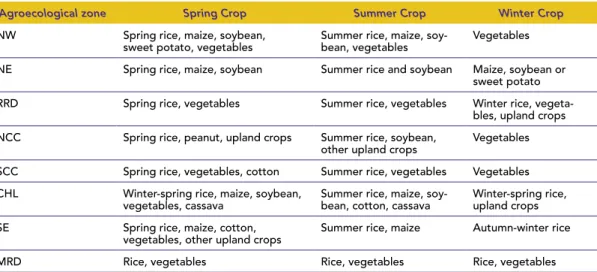
5. Increases in Annual Average Temperatures by Climate Scenario and Zone 8 6. Increases in Annual Precipitation by Climate Scenario and Zone 8 7. Possible Impacts of Climate Change on Agriculture 11 8. Exposure to Hydro-climatic Risks by Agroecological Zone 12 9. Harvested Areas and Crop Yields by Agroecological Zones, 2007 13 10. Percentage Shares of Crop Production by Agroecological Zone, 2007 13 11. Typical Seasonal Crop Rotations by Agroecological Zone 14 12. Potential Impacts of Climate Change on Crop Yields 17 13. Impact of Yield Changes on Production by Scenario in 2030 and 2050 18 14. Total Impact of Climate Change on Production by Scenario in 2050 18 15. Population, GDP and Employment Projections, 2005–50 20 16. Changes in Baseline GDP and Aggregate Consumption due to Climate Change 21 17. Changes in Value-Added by Sector due to Climate Change 21 18. Changes in Household Consumption by Income Group due to Climate Change 22
19. Expansion in Crop Irrigation by 2050 25
20. Changes in Real GDP and Aggregate Consumption Without/with Adaptation 25 21. Present Values of Changes in Aggregate Consumption 27 22. Adaptation Results by Sector and Region, 2050 27 23. Changes in Household Consumption by Income Group Without/with Adaptation 27
24. Aquaculture Development Targets up to 2020 32 25. Main Salinity and Temperature Requirements for Catfish and Shrimp 34 26. Estimates of Catfish Pond Area (ha) that will be Subjected to Increments 36 of Maximum Flooding Depths in the Rainy Season under 50-cm SLR Scenario 37 27. Land Use Types that will be Subjected to > 4 ppt Maximum Salinity Intrusion 43
in the Dry Season under 50-cm SLR Scenario
28. Forest Area and Cover by Region, 2006 44
29. Classification of Forest Types by Location and Climate Characteristics 48 30. Impact of Climate Change on Stand Volumes of 7-year Acacia mangium 48 31. Estimated Areas Climatically Suited to some Forest Types 49 32. Dependency on Different Income Streams by Region 58 33. Regional Distribution of Minority Populations 59
34. Statistics on Female Status by Region 60
35. Literacy and Education Rates, 2001 63
36. Household Access to Water, 2005 64
37. Drivers and Impacts of Climate Change on Coastal Ports 75
Figures
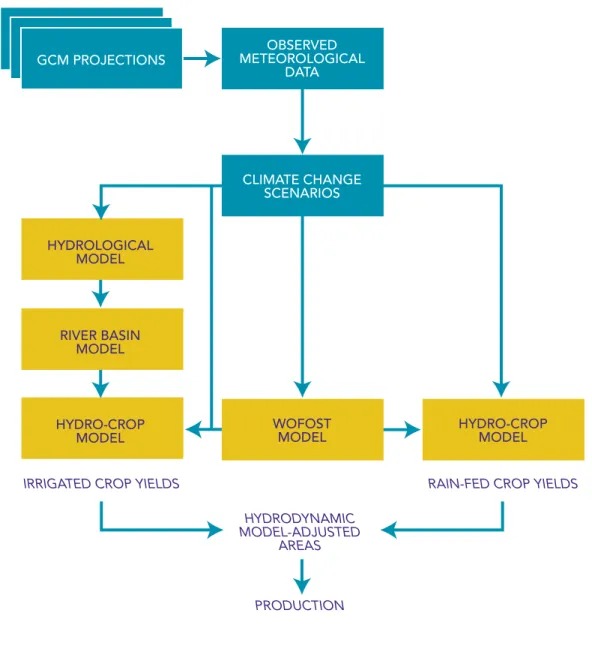
1. Framework for Analysis of the Impacts of Climate Change 15 2. Flood Inundation with 30 cm Sea Level Rise in the Mekong Delta 16 3. Value of Production from Capture Fisheries and Aquaculture 29 4. Aquaculture Area and Production in Vietnam’s Southern Provinces, 2009 30 5. Value of (a) Brackish Water and (b) Catfish Produced in the Mekong River Delta 31 6. Global Warming and Fisheries/Aquaculture: Potential Impacts 33 7. Areas in An Giang, Dong Thap and Can Tho Provinces Subjected to Increments 35
of Maximum Flooding Depths for 50-cm SLR Scenario
8. Areas Subjected to Increments of Maximum Water Salinity for 50-cm SLR scenario 36
9. Steps in the Economic Analysis 38
10. Reduction in Net Income from Catfish Farming due to Climate Change 39 without Adaptation
11. Reduction in Net Income from Shrimp Farming due to Climate Change 39 without Adaptation
12. Poverty Map of Vietnam at District Level 57
13. Survey Location 67
14. Most Important Seaports 74
15. Volume and Distribution of Cargo Throughput 74
Boxes
E C O N O M I C S O F A DA P TAT I O N TO C L I M AT E C H A N G E
ADB Asian Development Bank
AEZ Agroecological Zone
CGE Computable general equilibrium
CMI Climate moisture index
CSIRO Commonwealth Scientific and Industrial Research Organisation
DFID Department for International Development (UK)
EACC Economics of Adaptation to Climate Change
FHH Female-headed household
GCM General circulation model
GDP Gross domestic product
GIS Geographical information system
GoV Government of Vietnam
GSO General Statistics Office
IAE Institute for Agriculture and Environment
IPCC Intergovernmental Panel on Climate Change
MARD Ministry of Agriculture and Rural Development
MoLISA Ministry of Labor, Invalids, and Social Affairs
MoNRE Ministry of Natural Resources and Environment
NCAR National Center for Atmospheric Research
NGO Non-governmental organization
NTP-RCC National Target Program to
Respond to Climate Change
ppt Parts per thousand
SIWRP Southern Institute for Water Resources Planning
SLR Sea level rise
UNDP United Nations Development Programme
VHLSS Vietnam Household Living Standards Survey
VNĐ Vietnamese Đong
Note: Unless otherwise noted, all dollars are U.S. dollars, all tons are metric tons.
E C O N O M I C S O F A DA P TAT I O N TO C L I M AT E C H A N G E
This report is the outcome of a research effort to which both national and international experts have contributed in the context of the Economics of Adaptation of Climate Change study (EACC) implemented by the World Bank and funded by the governments of the Netherlands, Switzerland, and the United Kingdom.
The team effort in Vietnam was led and coor-dinated by Benoit Laplante with the support of Huynh Thi Thanh Thuy. The synthesis report was edited by Gordon Hughes (Consultant). We would like to thank the following individuals and organizations: Sergio Margulis (Team leader of the EACC study), Douglas J. Graham (Environ-ment Country Sector Coordinator), Laurent Cretegny, Robin Mearns, Steve Jaffee, Anne Kuriakose, Ian Noble, and Kiran Pandey (Coor-dinator EACC country studies) (World Bank); David Corderi (Consultant); Tingju Zhu and Zhe Guo (International Food Policy Research Institute); Le Heng Nam, Nguyen Thuy Hang, Ha Le Thanh, and Thuy Dung (Institute of Water Resources Plan-ning); Nguyen Ngoc Anh, Nguyen Xuan Hien, Do Duc Dung, Nguyen Vu Huy, Nguyen Huy Khoi, Thi Lan Huong, Le Ngoc Anh, Tran Duc Dung, and Cao Thi Tu Trinh (Southern Institute of Water
Resources Planning); Philip Adams, James Giesecke, Michael Jerie, and Nhi Hoang Tran (Centre of Policy Studies, Monash University); To Trung Nghia, Le Hung Nam, Le Hong Tuan, Truong Trong Luat, and Vu Dinh Huu (Institute of Water Resources and Planning); Pham Quang Ha, Mai Van Trinh, Tran Van The, and Vu Duong Quynh (Institute for Agricultural Environment); Bao Thanh, Luong Van Viet, Nguyen Thi Phuong, and Bui Chi Nam (Sub-Institute of Hydrometeorology and Environment of South Viet Nam); Tuyen Nghiem, Hue Le, and Huoung Vu Dieu (Center for Natural Resources and Environmental Studies); Pamela McElwee (Arizona State University); Dang Thu Phuong (Challenge to Change); Nguyen Van Be, Le Canh Dung, Nguyen Hieu Trung, and Sinh Le Xuan (Can Tho Univer-sity); Suan Pheng Kam, Marie Caroline Badjeck, Michael Phillips, and Robert Pomeroy (World Fish Center); Louise Teh and Lydia The (University of British Columbia); Be Nam Vo Thi (Sub-National Institute for Agricultural Planning and Projection); and Hien Than Thi and Hue Nguyen Thu (Centre for Marinelife Conservation and Community Development). We would also like to thank Robert Livernash for editorial services, Jim Cantrell for editorial input and production coordination, and Hugo Mansilla for editorial and production support.
E C O N O M I C S O F A DA P TAT I O N TO C L I M AT E C H A N G E
The Economics of Adaptation to Climate Change (EACC) study aims to support countries to understand the risks posed by climate change and to design better strategies to adapt to climate change. In doing so, a key objective of the study is to help decision makers at the national level to integrate robust adaptation strategies into their development plans and budgets in a context of high uncertainty, competing needs, and limited financial resources. In addition to providing esti-mates of adaptation costs at the global level,1
the EACC study has implemented country-level studies for Bangladesh, Bolivia, Ethiopia, Ghana, Mozambique, Samoa, and Vietnam.2
This report provides a synthesis of key findings of sector studies undertaken in Vietnam in the context of the EACC study. The sector studies were on agriculture (Zhu & Guo 2010), a separate computable general equilibrium [CGE] analysis based on agriculture findings (Adams et al. 2010), aquaculture (Kam et al. 2010), forestry (Phuong
1 At the global level, the EACC study estimates that it will cost between $70 and $100 billion each year to adapt to climate change over the period 2010 to 2050.
2 The study was funded by the governments of the United Kingdom, Netherlands, and Switzerland. Further details may be found at: www.worldbank.org/eacc. In addition, the synthesis report from Vietnam and the six underlying national sector reports can be downloaded from the Environment site of the World Bank’s web site for Vietnam: www.worldbank.org/vn/ environment.
et al. 2010, Almeida et al. 2010), social (McElwee et al. 2010), and coastal ports (VIMARU 2010). Further details can be found in the individual sector reports prepared by teams of national and international experts.
Vulnerability to
Climate Change
Vietnam is a long narrow country consisting of an extensive coastline, two major river deltas, and mountainous areas on its eastern and northeast-ern borders. Vietnam is heavily exposed to the risks of weather variability and climate change. Its vulnerability to weather risks has given the country experience in designing and implement-ing measures to mitigate the effects of droughts, flooding, storms, and similar events on agriculture and other sectors of the economy. Assessing the potential impacts of climate change and deter-mining how best to adapt represents a new chal-lenge, for which past experience may be a guide but which is accompanied by large uncertainties. In June 2009, the Ministry of Natural Resources and Environment (MoNRE) published Viet-nam’s official scenario for climate change. The MoNRE scenario falls in the middle of a range of
Executive Summary
E C O N O M I C S O F A DA P TAT I O N TO C L I M AT E C H A N G E
xii
alternative climate scenarios for Vietnam when these are arranged by their climate moisture indices. In addition to the MoNRE scenario, the EACC study has made use of two other climate scenarios—Dry (IPSL-CM4) and Wet (GISS-ER)—which represent the extremes of the distri-bution by climate moisture indices.
Rainfall projections across seasons are of particu-lar interest. The dry seasons are projected to get drier, with the March–May rainfall reductions being higher in the southern part of the country; the wet seasons are projected to get wetter, with the June–August rainfall increases being higher in the northern part of the country. Hence, it is expected that rainfall will be concentrated even more than
now in the rainy season months, leading to an increase in the frequency, intensity, and duration of floods, and to an exacerbation of drought prob-lems in the dry season. Sea level is projected to rise approximately 30 cm by 2050 and up to 75 cm by 2100 under the medium scenario.
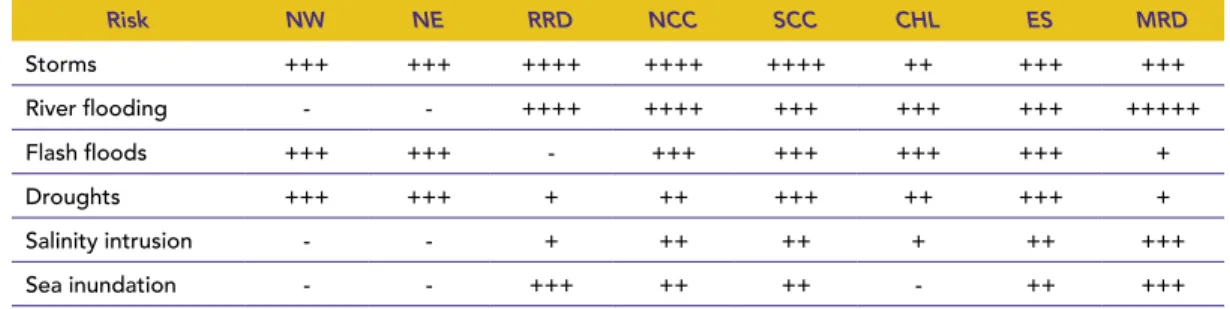
An analysis of vulnerability to climate change at the sub-national level was carried out as part of the social analysis. Exposure to climate change is assessed by considering the number of households potentially threatened by the effects of storm, flooding, salinity intrusion, sea level rise (SLR) and storm surges, landslides and flash floods, and drought. Each region is assigned to catego-ries ranked from 0 to 4 (low to severe exposure).
Table eS-1 REGIONAL VULNERAbILITY TO CLIMATE CHANGE Region North-west NW North-east NE Red River Delta RRD North Central Coast NCC South Central Coast SCC Central High-lands CHL South-east SE Mekong River Delta MRD eXPOSURe Storms 1 3 4 4 4 2 2 3 Flooding 1 1 4 4 4 2 2 4 Salinity 0 0 1 2 2 0 1 4 SLR 0 0 2 2 2 0 3 4 Landslides 3 3 1 3 3 2 1 1 Drought 2 2 1 4 4 4 2 2 Average 1.2 1.5 2.2 3.2 3.2 1.7 1.8 3.0 SeNSITIVITY Poverty 4 3 2 4 2 4 1 2 Economic diversification 4 4 2 4 3 4 2 2 Education 4 3 1 2 2 2 1 3 Health & sanitation 4 1 2 1 1 1 1 3 Ethnic minorities 4 3 0 1 1 4 1 2 Women & children 4 3 1 2 3 3 1 2 Migrants 0 0 2 2 1 4 4 1 Urban households 0 0 2 1 1 0 4 3 Average 3.0 2.1 1.5 2.1 1.8 2.8 1.9 2.3
Similarly, sensitivity to the impacts of climate is assessed on criteria that reflect vulnerability to the consequences of climate change based on specific socioeconomic characteristics—poverty, economic diversification, education, and health and sani-tation—and for specific social groups, including ethnic minorities, women and children, migrant populations, and urban populations. Again, each region is assigned to categories ranked from 0 to 4 (low to extreme sensitivity). Unweighted averages of the classifications were computed to gener-ate indices of exposure and sensitivity. These are shown in Table ES-1 (see also Figure 13 in main text which shows the regions on a map).
The analysis indicates that exposure to the effects of climate change is highest in the Central Coastal regions (NCC & SCC) and in the Mekong River Delta. On the other hand, sensitivity to the effects of climate change is highest in the North-West and Central Highland regions. The correlation between exposure and sensitivity is negative, so that regions with high exposure tend to have low sensitivity and vice versa. The only region with indices that are above the average on both mea-sures is the Mekong River Delta.
Methodology
The sectors were chosen based on interest of the Government, availability of data, the opportunity to pilot different methodological approaches, and the feasibility of carrying out an analysis. Some other sectors that were not looked at (e.g., urban infrastructure) could well be be subject to more important climate change impacts. Detailed stud-ies were carried out for agriculture (crop produc-tion), aquaculture, forestry, and coastal ports, as well as a broader study on social vulnerability. Each of the sector studies follows a broadly simi-lar approach with the following steps:
Step 1: Establish a baseline scenario consisting of projections of land use, production, value-added,
population growth, urbanization, and other vari-ables without climate change. This provides the reference scenario against which the impacts of climate change without and with adaptation are measured.
Step 2: Consider the relevant climate variables for the sector and identify changes projected to 2050 or beyond for each of the climate scenarios. This makes use of detailed information on precipita-tion by season and/or region.
Step 3: Identify the impact of changes in climate on resource productivity and land use. This included, for example, the effect of changes in seasonal temperatures on rice yields or of seasonal precipitation on coffee yields, as well as the effect of flooding or saline intrusion on the amount of land that can be used for rice production in the Mekong River Delta.
Step 4: Using geographical information systems (GIS) and other techniques, combine the infor-mation collected in Steps 2 and 3 to estimate the overall impact of climate change on land use and production by comparing estimates of yields and production under (a) no climate change, and (b) with climate change but no adaptation.
Step 4A: For agriculture, incorporate the results from Step 4 into a macroeconomic model to assess the consequences of changes in agricultural output on agricultural prices, trade, GDP, economic activ-ity in other sectors, and household consumption. Step 5: Identify opportunities for (a) autonomous adaptation undertaken by farmers and other pro-ducers in responses to changes in climate and other conditions, and (b) planned adaptation, which is likely to be initiated and at least partly funded by the government.
Step 6: Estimate the production of crops, timber, and so on under the new climate conditions after the adaptation measures have been implemented.
E C O N O M I C S O F A DA P TAT I O N TO C L I M AT E C H A N G E
xiv
This provides the basis for identifying (a) the effect of climate change with adaptation (the dif-ference between the baseline scenario and the scenario of climate change with adaptation), and (b) the impact of adaptation itself (the difference between the scenarios of climate change without and with adaptation).
Step 6A: As for Step 4A, incorporate the results from Step 6 into the macroeconomic model to assess the benefits of adaptation in terms of aggregate and sectoral economic activity and household consumption.
Many of the adaptation options are “no regrets” options that increase yields or production even without climate change. This is not invariably the case, for example there would be no need to upgrade ports if sea level and storm surges do not change. However, for agriculture and other sectors it is difficult to identify measures that are only justified under a specific set of climate con-ditions. For these sectors, adaptation is often a matter of doing things that would in any event have been economic under a wide range of cli-mate conditions.
Agriculture
The impact of the alternative climate scenarios on crop production has been examined using pro-jections of runoff, which affects the availability of irrigation water, plus agronomic models that take account of temperature and rainfall patterns,
water availability for rainfed and irrigated crops, and other factors to estimate the impact of cli-mate change on crop yields.
Changes in yields without adaptation vary widely across crops, agroecological zones, and climate scenarios. As for other EACC studies, the results reported do not take account of CO2 fertiliza-tion, because of the uncertainties about the extent of this effect; taking this into effect might have reduced the severity of some predicted productiv-ity declines. For rice, the Dry scenario would lead to reductions in yields ranging from 12 percent in the Mekong River Delta to 24 percent in the Red River Delta. The primary factors influencing rice yields are the increase in average temperatures and seasonal reductions in runoff.
There would be more extensive inundation of crop land in the rainy season and increased saline intrusion in the dry season as a consequence of the combination of sea level rise and higher river flooding. For the Mekong River Delta, it is esti-mated that about 590,000 ha of rice area could be lost due to inundation and saline intrusion, which accounts for about 13 percent of today’s rice production in the region.
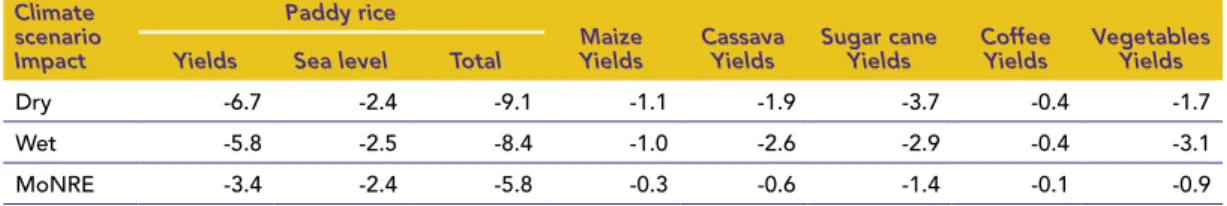
Table ES-2 shows the potential impact of climate change without adaptation under alternative cli-mate scenarios on production of six major crops or crop categories relative to a 2050 baseline of no climate change. Paddy rice production may fall by 5.8 (MoNRE) to 9.1 (Dry) million tons (mmt) per year.
Table eS-2 CHANGE IN CROP PRODUCTION IN 2050 DUE TO CLIMATE CHANGE wITH NO ADAPTATION (MILLION METRIC TONS)
Climate scenario Impact
Paddy rice
Maize
Yields CassavaYields Sugar caneYields CoffeeYields VegetablesYields Yields Sea level Total
Dry -6.7 -2.4 -9.1 -1.1 -1.9 -3.7 -0.4 -1.7 Wet -5.8 -2.5 -8.4 -1.0 -2.6 -2.9 -0.4 -3.1 MoNRE -3.4 -2.4 -5.8 -0.3 -0.6 -1.4 -0.1 -0.9
These figures are not forecasts of what will actually hap-pen. Farming involves a continuous process of adaptation to weather, technology, economic and other influences, so adaptation will certainly take place. Rather, these projections provide a starting point—based on the best available information and subject to substantial uncertainty—for (a) understanding the potential importance of cli-mate change for crop production holding other factors constant, and (b) assessing the type and scale of adaptation that may be required, which will require a combination of autonomous adap-tation (by farmers) and planned adapadap-tation (as a consequence of government policy).
Further, this assessment of the potential impact of climate change on crop production needs to be interpreted in a larger context. Changes in diets and consumer preferences with falling demand for rice, market liberalization, trade (which will expose Vietnam to lower-cost competition), and conversion opportunities to aquaculture and more salt-tolerant varieties will all have important effects on the demand for and the supply of agri-cultural products over the coming decades. The impacts of climate change have to be assessed against a background of wider economic and social development.
Macroeconomic impacts. As in the other EACC country studies, a computable general equilibrium (CGE) model has been used to examine the macro-economic impacts of climate change. In Vietnam, the CGE model was only used to take into account the effects of climate change and adaptation for the agricultural sector, so it does not attempt to take account of all of the macroeconomic impacts of climate change. The CGE model establishes a baseline composition of economic activity up to 2050, given data and assumptions about inter-industry linkages for 158 sectors, including regional crop production for the six crops examined above, consumption for ten rural/urban household groups, population, investment, and productivity growth. This is used to simulate the effect of exoge-nous “shocks;” that is, deviations from the baseline scenario, such as a reduction in crop production due to climate change. The model is run assuming that the aggregate level of investment and savings remains constant in real terms, so that aggregate consumption moves with gross domestic product (GDP). The model takes account of the effects of exogenous shocks on industry and services, interna-tional trade, commodity prices and the distribution of consumption. A broad picture of its results may be obtained by examining changes in total GDP, aggregate consumption, and other variables under
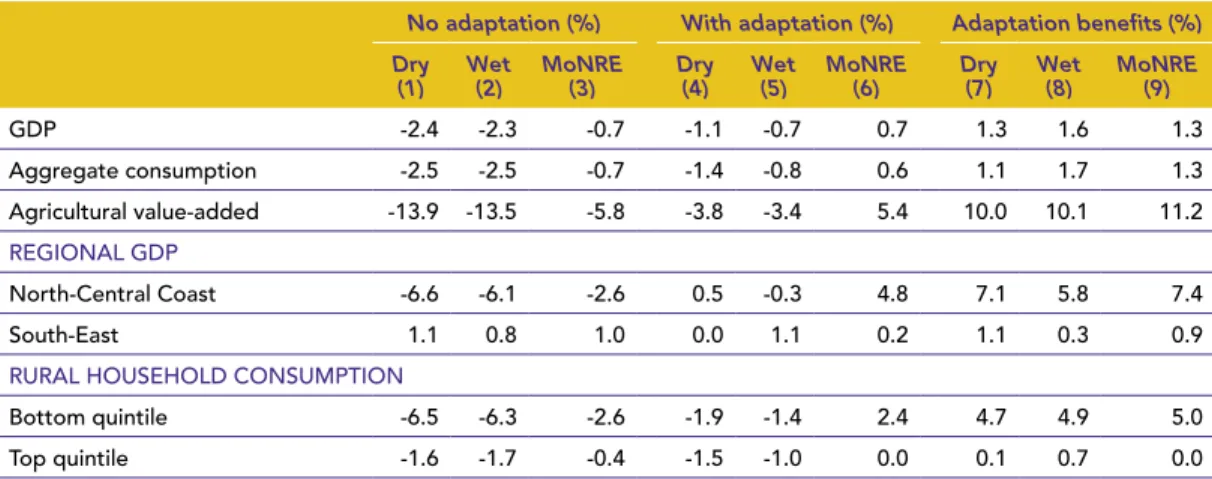
Table eS-3 MACROECONOMIC EFFECTS OF CLIMATE CHANGE
wITHOUT/wITH ADAPTATION IN 2050(PERCENTAGE DEVIATIONS FROM bASELINE wITH NO CLIMATE CHANGE)
No adaptation (%) With adaptation (%) Adaptation benefits (%) Dry
(1) Wet(2) MoNRE(3) Dry(4) Wet(5) MoNRE(6) Dry(7) Wet(8) MoNRE(9)
GDP -2.4 -2.3 -0.7 -1.1 -0.7 0.7 1.3 1.6 1.3 Aggregate consumption -2.5 -2.5 -0.7 -1.4 -0.8 0.6 1.1 1.7 1.3 Agricultural value-added -13.9 -13.5 -5.8 -3.8 -3.4 5.4 10.0 10.1 11.2 REGIONAL GDP North-Central Coast -6.6 -6.1 -2.6 0.5 -0.3 4.8 7.1 5.8 7.4 South-East 1.1 0.8 1.0 0.0 1.1 0.2 1.1 0.3 0.9 RURAL HOUSEHOLD CONSUMPTION
Bottom quintile -6.5 -6.3 -2.6 -1.9 -1.4 2.4 4.7 4.9 5.0 Top quintile -1.6 -1.7 -0.4 -1.5 -1.0 0.0 0.1 0.7 0.0
E C O N O M I C S O F A DA P TAT I O N TO C L I M AT E C H A N G E
xvi
the alternative climate scenarios in 2050 relative to a baseline with no climate change.
Total GDP and aggregate consumption in 2050 with no adaptation will be 2.4–2.3 percent lower than the baseline under the Dry/Wet scenarios but only 0.7 percent lower under the MoNRE sce-nario, shown in columns (1) through (3) of Table ES-3. The reason for the reduction in GDP is the decline in agricultural value-added of 13.9/13.5 percent under the Dry/Wet scenarios, which is marginally offset by small increases in value-added in industry and services. There are significant dif-ferences between the impact of climate change on different regions, as illustrated by the estimates for changes in regional GDP for the North- Central Coast and South-East regions. The gain in the South-East is a consequence of the concentration of industry and services in the region.
The impact on household incomes is skewed, with greater losses for those in the bottom rural quintile (the poorest 20 percent of rural house-holds arranged by expenditure per person) than for the top quintile. Poor rural and urban house-holds are most vulnerable because they rely more heavily on the agricultural sector for their incomes and they spend a higher proportion of their income on food, which becomes relatively more expensive.
Adaptation in agriculture. The study exam-ined a range of adaptation options including autonomous adaptations undertaken by farmers as well as planned adaptation underpinned by government spending in areas that will enhance the capacity of farmers to adapt. The autono-mous adaptations include changes in sowing dates, switching to drought-tolerant crops, adop-tion of salinity-tolerant varieties of rice, adopadop-tion of new varieties for other crops, and switching to rice-fish rotations. The planned adaptations focus on (a) increased spending on research, develop-ment, and extension with the goal of raising aver-age crop yields by 13.5 percent relative to the
baseline, and (b) extending the area of irrigated land by about 688,000 ha, roughly half for rice and the remainder mainly for maize and coffee. The total cost of these measures is estimated at about $160 million per year at 2005 prices with-out discounting over the period 2010–50. Deviations in GDP and other macroeconomic variables from the baseline with adaptation for the alternative climate scenarios are shown in columns (4) through (6) of Table ES-3, while columns (7) through (9) give the net benefits of adaptation after allowing for the costs that are incurred. The adaptation measures substantially reduce the impact of climate change under all scenarios. The expenditures on adaptation for agriculture are clearly justified as the ratio of their benefits to the costs that are incurred is much greater than 1. The combination of the MoNRE scenario with adaptation leads to an increase in aggregate consumption, indicat-ing that some, perhaps many, of the adaptation measures are “no regrets” options that would be justified even without climate change.
An important aspect of adaptation is that it off-sets most of the disproportionate impact of cli-mate change on poorer households. The bottom quintile of rural households benefit most from adaptation and the gap between the changes in household consumption for the bottom and top quintiles is almost eliminated. Adaptation partly or wholly offsets both the reduction in agricultural incomes and the increase in food prices that accompany climate change without adaptation.
Investments in flood and coastal protection were not incorporated in the macroeconomic analysis. Separate studies have indicated that the costs of building/upgrading sea dikes and flood defenses to protect urban infrastructure and the most valu-able agricultural land would be about 1 percent of total investment—about $540 million per year at 2005 prices.
Other Sectors
Aquaculture. Aquaculture, especially in the Mekong River Delta, is an important source of employment and rural income. It is estimated that some 2.8 million people are employed in the sector, while export revenue is expected to be about $2.8 billion in 2010. Higher temperatures, an increased frequency of storms, sea level rise, and other effects of climate change are likely to affect fish physiology and ecology as well as the operation of aquaculture. Some fish species, such as catfish, may grow more rapidly with higher temperatures but be more vulnerable to disease. The main impacts of climate change on aquacul-ture seem likely to be a consequence of increased flooding and salinity.
Parts of the aquaculture sector, particularly cat-fish farming, currently face uncertain economic prospects, particularly as a result of rising prices for feedstuffs and the costs of maintaining water quality. Without adaptation, it is likely that climate change will reduce profit margins, so that only the most efficient aquaculturists who adopt best practices will survive. Successful adaptation will require a combination of better feed conversion and improvements in marketing together with investments in upgrading dikes to reduce flood-ing and salinity intrusion that will benefit other sectors as well as aquaculture. Semi-intensive and intensive shrimp producers may incur additional costs of water pumping to maintain water and salinity levels. Since the industry is both capital-intensive and growing rapidly, adaptation is likely to be autonomous with the costs borne by opera-tors. The total cost of adaptation is estimated at an average of $130 million per year from 2010–50, which is equivalent to 2.4 percent of total costs. Forestry. The impact of climate change on for-ests is likely to be complex and long term. For natural forests, the analysis suggests that there will be a substantial reduction in the area of land
that is suitable for humid semi-deciduous forest, which would be replaced by other forest types. Mangrove forests will be affected by sea level rise unless they are able to migrate inland. The area of land under plantation forests with short rota-tions has increased rapidly over the past 20 years. A forestry growth model suggests that climate change will increase the variability of plantation yields across the country without having a major impact on the average yield. Thus, an important adaptation need will be to ensure the best match between soil, climate, and management practices to obtain the highest yields from plantations. A range of adaptation options was considered. The key measures identified were (a) changes in land use planning to facilitate the migration of mangroves; (b) adoption of plantation species and methods of silviculture that are more resilient to droughts; (c) improvements in pest management, including genetic selection and integrated pest control strategies; and (d) use of herbicides or bio-logical controls to limit the effect of exotic weed species on tree growth. The financial costs of adaptation are likely to be modest, but the institu-tional issues may be more difficult to deal with. Coastal ports. Along its 3,200 km coastline, Vietnam has a total of 116 ports. In addition, new terminals are being constructed and planned all along the coastline, particularly in the south around Ho Chi Minh City and in the north around Hai Phong. Given the nature of its loca-tion, this infrastructure is at risk from sea-level rise and storm surges. Impacts include accelerated depreciation of structures and flooding of port facilities such as warehouses.
Adaptation options examined in the study include (a) raising quay walls, (b) improving surface drain-age to reduce flooding, and (c) increased expendi-ture on the maintenance and replacement of port infrastructure. The cost of adaptation for all ports would be less than $500 million, or about $12 mil-lion per year without discounting at 2005 prices.
E C O N O M I C S O F A DA P TAT I O N TO C L I M AT E C H A N G E
xviii
Social Analysis
Up to now government policies have focused on sector-wide assessments for the whole country and on “hard” adaptation measures—such as sea dikes, reinforced infrastructure, and durable buildings. Little attention has been paid to “soft” adaptation measures like increasing institutional capacity or the role of collective action and social capital in building resilience. Most adaptation options identified at the field sites and during par-ticipatory scenario development workshops were aimed at improving response capacity and disas-ter risk reduction—such as forecasting, weather monitoring—and managing climate risk. Nota-bly, adaptation options that reduce poverty and increase household resilience or that integrate climate change into development planning were not emphasized.
Overall, many of the adaptation options observed at the field sites and/or proposed in workshops were highly cost-effective and do not require large expenditures. Moreover, they were largely in line with the adaptation options considered for the climate scenarios in the sector analyses. These adaptation measures included shifting planting dates, adopting drought-tolerant crops,
and switching to salinity-tolerant varieties of rice. The diversity of preferred adaptation responses reflected the impressive variety of Vietnam’s vul-nerability zones and confirm the need for a mix of both autonomous and planned adaptation, a mix of hard and soft options, and adaptation to be carried out at the national, subnational, and community levels.
Lessons and
Recommendations
Climate change will have a significant impact on some regions and sectors of Vietnam’s rural econ-omy. Still, in macroeconomic terms the impacts of climate change on agriculture and related sec-tors, even with no adaptation, appear to be rela-tively modest. In practice, there will be substantial autonomous adaptation even without active gov-ernment intervention, since farmers will change the crops and crop varieties that they grow and their methods of farming.
The major concern is the extent to which cli-mate change will hit poor households, partly because of the decline in agricultural incomes and partly because of an increase in food prices relative to the general cost of living. The low-est 20 percent of households—either urban or rural—arranged by household expenditure per person will experience larger reductions in real standards of living due to climate change than the top 20 percent of households.
Thus, the primary focus of policies to adapt to climate change for the sectors covered under the EACC studies, should be to protect the poor, the vulnerable, and those least able to respond to changing climatic stresses. The goal should be to provide farmers and others with the tools and resources that will enable them to respond to cli-mate change itself and to the new risks that will accompany climate change. The key elements will be:
Increased expenditures on research,
devel-■ ■
opment, and extension for crop production, aquaculture, and forestry to develop new crop varieties that are more tolerant to drought, salinity, higher temperatures early in the grow-ing season, and so on. Both the public and private sectors should be involved in efforts to increase yields and productivity.
Investment in expanding irrigation
infrastruc-■ ■
ture, especially in the central regions where the opportunities for irrigation expansion are greatest. In the short term, this should build upon achieving fuller utilization of existing irrigation infrastructure and improvements in operations and maintenance.
Increased spending on the maintenance and
■ ■
extension of coastal and flood defenses to min-imize the impacts of sea inundations, salinity intrusion, and river flooding, especially in the Mekong River and Red River Deltas.
Many of these expenditures would be justified even without climate change, so adaptation to climate change is primarily a matter of building upon no-regrets measures. Under the intermediate MoNRE climate scenario, the program of agri-cultural adaptation outlined in this study would increase agricultural incomes relative to the base-line, especially in the Central Highlands region, illustrating the general benefits of the strategy. If this program of adaptation were to be imple-mented, the adverse impacts of climate change on poorer households would largely be avoided. There would still be a net loss of agricultural value-added and aggregate consumption in the Wet and Dry climate scenarios, but the magni-tude of the losses would be significantly smaller and the skewed impact on the distribution of income would be corrected.
Year-to-year weather variability is much greater than the long-term trends associated with climate
change. Policies and systems that can cope effec-tively with current weather variability will be more successful in adapting to future climate change than those that cannot. Strengthening the capacity of the rural sector to cope with current weather variability and build resilience into such systems will yield benefits both now and in the future. It is also important to collect, analyze, and report data on how the climate is changing in dif-ferent regions of the country so that those who have to take account of climate change in plan-ning new infrastructure or implementing invest-ment programs should have access to the best possible information.
Climate change, including sea level rise, will affect the country’s infrastructure and require expen-ditures on adaptation. The case study of coastal ports indicated the lesson that the costs of adapta-tion are likely to be modest. The total cost of pro-tecting existing ports that are exposed to flooding as a result of a higher sea level, combined with greater storm surges, is estimated as no more than $500 million over 40 years, or about 1 percent of planned investment in ports over the period 2010–30.
An equally important lesson from the case study is that it is essential to plan ahead for climate change. Ports that are built over the next 10–20 years should be designed to cope with sea levels and storms to which they may be exposed 50 or more years from now. It may be cheaper to build margins of resilience and safety into new infra-structure than to upgrade assets during the course of their life. The same lesson emerges from the analyses for infrastructure and coastal protection undertaken as part of the EACC global study. The total cost of adaptation for these sectors amounts to about 2 percent of total investment for the Global Wet (NCAR) scenario, and about 1.3 percent of total investment for the Global Dry (CSIRO) scenario, on the assumption that adap-tation measures are combined with new invest-ments anticipating climate change up to 2100.
E C O N O M I C S O F A DA P TAT I O N TO C L I M AT E C H A N G E
As a long narrow country with an extensive coastline, one of the world’s major river deltas, and mountains on its eastern and northeast-ern borders, Vietnam is heavily exposed to the risks of weather variability and climate change. Its vulnerability to weather risks has given the country experience in designing and imple-menting measures to mitigate the effects of droughts, flooding, storms, and similar events on agriculture and other sectors of the econ-omy. Assessing the potential impacts of climate change—and how best to adapt—represents a new challenge, for which past experience may be a guide, but which is accompanied by large uncertainties.
The potential consequences of climate change have received considerable attention in Vietnam (World Bank 2010). The government has pre-pared the country’s National Target Program to Respond to Climate Change (NTP-RCC), which was adopted in 2008. The strategic objectives of the NTP-RCC focus on assessing the impacts of climate change on sectors and regions in specific periods and developing plans to respond to cli-mate change to ensure the sustainable develop-ment of the country. For this purpose, the tasks to be implemented over the period 2009–15 include: (a) enhancing the understanding of the impacts of climate change on socioeconomic activities;
and (b) assessing the costs and benefits of mea-sures to respond to climate change.3
A question of key interest pertains to the identifi-cation of the nature of the adaptation measures available for key sectors of economic activities and regions of the country, and the assessment of the possible costs and benefits of these measures. The current absence of such information repre-sents a significant factor limiting the capacity of governments at all levels to plan and implement the most cost-effective adaptation options. The Economics of Adaptation to Climate Change (EACC) study aims to support countries to understand the risks posed by climate change and to design better strategies to adapt to cli-mate change. A key objective of the study is to help decision makers at the national level to integrate robust adaptation strategies into their development plans and budgets in a context of high uncertainty, competing needs, and limited financial resources. In addition to providing esti-mates of adaptation costs at the global level,4
3 Prime Minister, Decision No. 158/2008/QĐ-TTg on Approval of the National Target Program to Respond to Climate Change, Hanoi,
Decem-ber 2, 2008.
4 At the global level, the EACC study estimates that it will cost between $70 and $100 billion each year to adapt to climate change over the period 2010 to 2050.
E C O N O M I C S O F A DA P TAT I O N TO C L I M AT E C H A N G E
2
the EACC study has implemented country-level studies for Bangladesh, Bolivia, Ethiopia, Ghana, Mozambique, Samoa, and Vietnam.5
This report provides a synthesis of the key find-ings of the sector studies undertaken in Vietnam in the context of the EACC study. The sectors covered by the study are agriculture, aquacul-ture, forestry, social, and coastal ports. Further details can be found in the individual sector reports prepared by teams of national and inter-national experts. Not all vulnerable sectors have been studied, and the studies themselves could not consider all possible impacts or adaptation measures. The analyses do not aim to provide 5 The study was funded by the governments of the United
Kingdom, Netherlands, and Switzerland. Further details may be found at www.worldbank.org/eacc. In addition, the synthesis report from Vietnam and the six underlying national sector reports can be downloaded from the Environment site of the World Bank’s web site for Vietnam: www.worldbank.org/vn/ environment.
the “final word” on the economics of adaptation in Vietnam. In most cases the studies highlight areas of significant uncertainty pertaining to the projected changes in climate variables, the rela-tionship between these changes and their impacts on resource productivity, and the vulnerability as well as the adaptive capacity of those who will be affected. The findings presented here should be regarded as a starting point to provide guidance for future investigations.
Each of the sector studies follows a broadly simi-lar approach with the following steps:
Step 1: Establish a baseline scenario consisting of projections of land use, production, value-added, population growth, urbanization, and other variables without climate change. This provides the reference scenario against which the impacts of climate change without and with adaptation are measured.
Step 2: Consider the relevant climate variables for the sector and identify changes projected to 2050 or beyond for each of the climate scenarios. For some purposes, this requires detailed information on, say, precipitation by season and/or region. An important qualification is that general circulation models (GCMs), used to generate scenarios, are not generally designed to produce reliable pro-jections in such detail. The general direction of change may be well-understood, but there may be wide margins of uncertainty about the pre-cise projections for specific grid cells in specific months. Hence, the necessity of using detailed cli-mate information requires an acceptance of rela-tively wide margins associated with the projected changes. Some of the potential differences may be captured by examining different climate scenarios, but large residual uncertainty cannot be removed. Step 3: Identify the impact of changes in climate on resource productivity and land use. This includes, for example, the effect of changes in sea-sonal temperatures on rice yields or of seasea-sonal precipitation on coffee yields as well as the effect of flooding or saline intrusion on the amount of land that can be used for rice production in the Mekong River Delta.
Step 4: Using GIS and other techniques, combine the information collected in Stages 2 and 3 to estimate the overall impact of climate change on land use and production.
Step 4A: For agriculture, incorporate the results from Step 4 into a macroeconomic model to assess the consequences of changes in agricultural output on agricultural prices, trade, GDP, economic activ-ity in other sectors, and household consumption.
Step 5: Identify opportunities for (a) autono-mous adaptation undertaken by farmers and other producers in response to changes in cli-mate and other conditions, and (b) planned adaptation, which is likely to be initiated and at least partly funded by the government. Such opportunities include the development and/or adoption of different crop varieties or new spe-cies that respond better to the changed climate conditions, plus investments in irrigation and other infrastructure.
Step 6: Estimate the production of crops, timber, and so on under the new climate conditions after the adaptation measures have been implemented as a basis for calculating the extent to which adap-tation can offset the impacts of climate change without adaptation.
Step 6A: As for Step 4A, incorporate the results from Step 6 into the macroeconomic model to assess the benefits of adaptation in terms of aggregate and sectoral economic activity and household consumption.
A final remark about the adaptation options. In many cases, these are “no regrets” options that increase yields or production even with-out climate change. This is not invariably the case, for example there would be no need to upgrade ports if sea level and storm surges did not change. However, for agriculture and other sectors it is difficult to identify measures that are only justified under a specific set of climate con-ditions. For these sectors, adaptation is often a matter of doing things that may be economic under a wide range of climate conditions, but either more or better.
E C O N O M I C S O F A DA P TAT I O N TO C L I M AT E C H A N G E
In this section, projected changes in climate vari-ables and sea level are briefly described at the regional and national levels. A general overview of historical and projected future climate change is provided in World Bank (2010).
Regional Projections
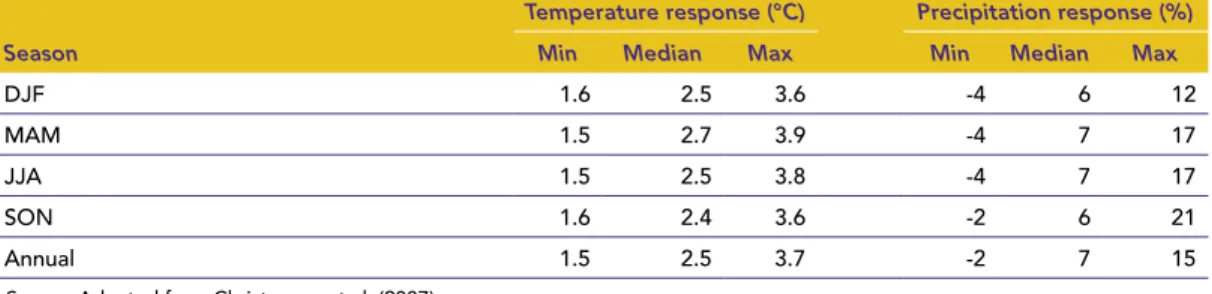
Table 1 summarizes the projected changes in seasonal air temperature and precipitation in Southeast Asia, as reported by the Intergov-ernmental Panel on Climate Change (IPCC, 2007). Regional averages of temperature and precipitation projections were calculated from a set of 21 global models in the multi-model ensemble approach, for 1980–99 and 2080–99 under the A1B SRES. The table shows the
minimum, maximum, and median (50 percent) values among the 21 models, for temperature (°C) and precipitation ( percent) changes. The results suggest seasonal temperature increases of 2.4–2.7°C and precipitation increases of 6–7 percent as median estimates.
Because climate change predictions incorpo-rate the results of many physical and chemical models, each containing their own uncertainties and errors, there is a high level of uncertainty about the projections under these scenarios. In their assessment of eleven GCMs in the Asian-Australian monsoon region, Wang et al. (2004) found that the models’ ability to simu-late observed inter-annual rainfall variations was poorest in the Southeast Asian portion of the domain.
Projections of Climate
Change and Sea Level Rise
Table 1 PROjECTED CLIMATE CHANGE FOR SOUTHEAST ASIA, 2080–99 AGAINST 1980–99 Temperature response (°C) Precipitation response (%)
Season Min Median Max Min Median Max
DJF 1.6 2.5 3.6 -4 6 12
MAM 1.5 2.7 3.9 -4 7 17
JJA 1.5 2.5 3.8 -4 7 17
SON 1.6 2.4 3.6 -2 6 21
Annual 1.5 2.5 3.7 -2 7 15
E C O N O M I C S O F A DA P TAT I O N TO C L I M AT E C H A N G E
6
Lacombe (2009) compares projected temperature and precipitation changes for the general South-east Asian region from different downscaled GCMs reported by various studies on regional projections of climate change. While the trend is clear regarding rising air temperatures, there is greater variation in projections of precipitation changes among different climate models, differ-ent emission scenarios, and across differdiffer-ent parts of the region. Projections on changes in seasonal-ity of rainfall patterns generally suggest the ten-dency toward wetter rainy seasons and drier dry seasons, but with geographical variation over the land and sea masses.
An increase in the frequency of extreme weather events such as heat waves and storms is also pro-jected throughout Southeast Asia (Walsh 2004). Similarly, it has been projected that an increase in sea surface temperature of 1°C will lead to an increase of 3–5 percent in tropical cyclone intensities (Knutson and Tuleya 2004). How-ever, changes in ocean temperatures only follow land temperatures with a considerable lag, so any increase in storm intensities up to 2050 is likely to be modest.
National Projections
In June 2009, MoNRE published Vietnam’s official climate change scenario (MoNRE 2009). While climate change estimates were developed for three different emissions scenarios low (B1), medium (B2), and high (A2 and A1FI), the medium emis-sion scenario (B2) was retained by MoNRE for the purpose of impact assessment and adaptation planning. The official scenario includes projected changes in temperature, rainfall, and sea level over the period 2020 to 2100. Projected changes in temperature and rainfall are estimated for each of Vietnam’s seven climatic zones.
Temperature. According to MoNRE (2009), the annual average temperature in Vietnam increased
by 0.5 to 0.7°C over the period 1958–2007. The report further notes that winter temperatures have increased faster than summer temperatures, and that temperatures in northern Vietnam have increased faster than those in the south. Annual average temperatures observed in Hanoi, Dan-ang, and Ho Chi Minh City have all been higher over 1991–2000 decade than the 1931–40 decade, and still higher in 2007 than over the 1991–2000 decade. These observations are all consistent with measured increases in global average temperature. Table 2 shows the projected increase in tem-perature assessed against average temtem-peratures recorded during the period 1980–99. The pro-jected increases in average temperature are slightly higher in the northern part of the country (2.4– 6.8°C by 2100) than in the south (1.6–2.0°C). Precipitation. As noted in the official scenario (MoNRE 2009), changes in rainfall patterns are complex, seasonal, and region-specific. Over the last century, changes in annual average rain-fall were not systematically either upward or downward: periods with declining rainfalls were followed by periods with increasing rainfalls. However, the annual rainfall appears to have decreased slightly over climate zones in the North, and increased over climate zones in the South. Despite the lack of obvious and definite trends in historical data, annual rainfall is projected to increase by 4–5 percent in Northern Vietnam by 2060 and by 7–8 percent by 2100. The changes in southern Vietnam are rather smaller, 1.5–3 per-cent by 2100 (Table 3).
As important as the projected changes in annual rainfall are, projected changes in rainfall across seasons are likely to be of greater significance. The dry seasons are projected to get drier, with the March–May rainfall reductions being higher in the southern part than in the northern part. The wet seasons are projected to get wetter, with the June–August rainfall increases being higher in the northern part than in the southern part.
Hence, it is expected that rainfall will be concen-trated even more than now in the rainy season months, leading to an increase in the frequency, intensity, and duration of floods, and to an exac-erbation of drought problems in the dry season. Sea level rise. Observations along the Vietnam-ese coast show that sea level has been rising at the rate of approximately 3 mm per year during the period of 1993–2008, consistent with the rate of 3.1 mm/yr reported at the global level over the period 1990–2000 (World Bank 2010). At the Hon Dau station, in the past 50 years, sea level rose approximately by about 20 cm, in the past
50 years. These observations are comparable with the global sea level rise trend (MoNRE 2009). Sea-level rise is projected to rise at an increasing rate over the period 2020–2100 (Table 4), lead-ing to an increase of approximately 30 cm by 2050 and up to 75 cm by 2100 under the medium scenario. As indicated earlier and as pointed in MoNRE’s official scenario, it is possible that IPCC projected changes in sea levels have been underestimated (Dasgupta et al. 2009).
The expected changes in climate variables and sea level discuss above form the background for
Table 2 PROjECTED INCREASES IN ANNUAL AVERAGE TEMPERATURES RELATIVE TO 1980–99 (MONRE MEDIUM SCENARIO, °C)
Climatic zone 2020 2040 2060 2080 2100 North-West 0.5 1.0 1.6 2.1 2.6 North-East 0.5 1.0 1.6 2.1 2.5 North Delta 0.5 0.9 1.5 2.0 2.4 North-Central 0.5 1.1 1.8 2.4 2.8 South-Central 0.4 0.7 1.2 1.6 1.9 Central Highlands 0.3 0.6 1.0 1.4 1.6 South 0.4 0.8 1.3 1.8 2.0
Table 3 PROjECTED CHANGES IN ANNUAL RAINFALL RELATIVE TO 1980–99 (MONRE MEDIUM SCENARIO, %)
Climatic zone 2020 2040 2060 2080 2100 North-West 1.4 3.0 4.6 6.1 7.4 North-East 1.4 3.0 4.7 6.1 7.3 North Delta 1.6 3.2 5.0 6.6 7.9 North-Central 1.5 3.1 4.9 6.4 7.7 South-Central 0.7 1.3 2.1 2.7 3.2 Central Highlands 0.3 0.5 0.9 1.2 1.4
Table 4 PROjECTED SEA LEVEL RISE IN VIETNAM (CM)
2020 2040 2060 2080 2100
Low scenario 11 23 35 50 65
Medium scenario 12 23 37 54 75
High scenario 12 24 44 71 100
E C O N O M I C S O F A DA P TAT I O N TO C L I M AT E C H A N G E
8
Table 5 INCREASES IN ANNUAL AVERAGE TEMPERATURES bY CLIMATE SCENARIO AND ZONE (˚C)
Agroecological zone
Dry (IPSL) Wet (GISS) MoNRE
2030 2050 2030 2050 2030 2050 NW 1.2 2.2 0.9 1.4 0.8 1.3 NE 1.2 2.2 0.9 1.4 0.7 1.3 RRD 1.2 2.2 0.9 1.4 0.7 1.3 NCC 1.1 2.0 0.9 1.4 0.9 1.6 SCC 0.9 1.6 1.0 1.6 0.5 0.9 CHL 0.8 1.6 0.9 1.6 0.5 0.9 SE 0.8 1.5 0.8 1.3 0.6 1.0 MRD 0.8 1.5 0.8 1.3 0.6 1.0
Table 6 INCREASES IN ANNUAL PRECIPITATION bY CLIMATE SCENARIO AND ZONE (%) Agroecological zone
Dry (IPSL) Wet (GISS) MoNRE
2030 2050 2030 2050 2030 2050 NW -16.5 -12.7 9.8 19.4 1.7 2.8 NE -16.5 -11.8 10.5 13.5 1.8 3.0 RRD -14.2 -9.2 8.6 10.1 2.1 3.5 NCC -11.9 -7.0 7.6 10.0 2.2 3.6 SCC -7.8 -9.7 5.2 5.7 1.6 2.8 CHL -11.0 -5.6 4.3 6.0 0.1 0.0 SE -10.7 -5.0 5.1 6.3 0.7 1.3 MRD -10.5 -6.3 5.2 6.3 0.9 1.5
estimating the impacts of climate change on eco-nomic sectors of activities as well as the nature, costs, and benefits of adaptation measures.
Climate Scenarios
To take account of differences in the projec-tions generated by different GCMs, a selection of climate scenarios was based on the ranking of GCMs with sufficient geographical detail by the climate moisture index (CMI) for the IPCC SRES A2 emission scenarios. There were 14 GCMs that met the criteria for consideration. The historical climate for 1971–2000 is roughly in the middle of the 14 projections, implying that there is nearly an equal opportunity for the climate to become dryer or wetter by 2050, if each of the projections had similar probabilities of being true. The driest (IPSL-CM4) and wet-test (GISS-ER) scenarios were used as the Dry and Wet scenarios in the analysis. In addition, MoNRE’s climate projection for the medium
emission scenario was included in the analysis to represent the middle of the distribution of GCMs in terms of the climate moisture index. Temperature increases and precipitation changes were estimated in all agroecological zones for all three climate change scenarios in the two future periods, 2030 and 2050.
The results are shown in Tables 5 and 6. The Dry scenario is warmer than the Wet scenario and both are warmer than the MoNRE scenario. However, the largest differences concern the changes in annual precipitation. For most of the country, the Dry scenario projects a significant decline up to 2030, which is partly reversed in the period 2030–50. On the other hand, the Wet scenario shows a substantial increase in annual precipitation, especially in northern Vietnam, but again the rate of change is greater up to 2030 than in the following two decades. In contrast, the MoNRE scenario shows much smaller changes in precipitation, so that it lies in between the Dry and Wet scenarios.
E C O N O M I C S O F A DA P TAT I O N TO C L I M AT E C H A N G E
Despite the country’s rapid rate of industrialization in the last two decades, agriculture remains a major economic sector in Vietnam. It generates employ-ment and income for a significant part of the population.6 Climate change is expected to affect
the sector significantly and in a number of differ-ent ways (Table 7). Much attdiffer-ention has focused on the potential impact of changes in temperature on rice yields, but any assessment of the impact of and adaptation to climate change on agriculture must take account of changes in land use due to salinization and flooding. Not all of the impacts will be negative because higher temperatures and/ or changes in rainfall may permit the cultivation of some crops in areas where they were previously not viable. Hence, it is necessary to examine the full set of adjustments to changes in crop yields, land suit-ability, market incentives and other factors in the context of a changing climate. One of the EACC sector studies (Zhu & Guo 2010) looked at these issues for a small number of crops.
The agricultural sector cannot be examined in isolation from the rest of the economy and world
6 In the ten years from 1995 to 2005, “agriculture, forestry, and fisheries” saw its relative contribution to the economy fall from 27.2 percent to 20.5 percent, while the industrial sector’s contri-bution increased from 28.8 percent to 41 percent over the same period. However, the agriculture, forestry, and fisheries sector continues to employ 57 percent of the total labor force (General Statistics Office 2009).
markets. Vietnam is a large exporter of rice, but agricultural markets and its comparative advan-tages may change in fundamental ways over a time horizon of four decades. Changes that affect the agricultural sector may affect economic growth and the distribution of incomes for the country as a whole. Equally, the impacts of climate change on the agricultural sector will be partly shaped by developments in the rest of the economy, so that the assessment must account for the dynamics of economic growth outside agriculture. For these reasons the analysis of the impacts of climate
Agriculture
Table 7 POSSIbLE IMPACTS OF CLIMATE CHANGE ON AGRICULTURE Climate change Possible impacts
Increasing temperature
Decreased crop yields due to heat stress and increased rate of evapotranspiration
Increased livestock deaths due to heat stress
Increased outbreak of insect pests and diseases
Changes in rainfall
Increased frequency of drought and floods causing damages to crops Changes in crop growing season Increased soil erosion resulting from more intense rainfall and floods Sea level rise Loss of arable lands
Salinization of irrigation water
Source: Adapted from Agricultural Development Bank