Publisher’s version / Version de l'éditeur:
Vous avez des questions? Nous pouvons vous aider. Pour communiquer directement avec un auteur, consultez la
première page de la revue dans laquelle son article a été publié afin de trouver ses coordonnées. Si vous n’arrivez pas à les repérer, communiquez avec nous à [email protected].
Questions? Contact the NRC Publications Archive team at
[email protected]. If you wish to email the authors directly, please see the first page of the publication for their contact information.
https://publications-cnrc.canada.ca/fra/droits
L’accès à ce site Web et l’utilisation de son contenu sont assujettis aux conditions présentées dans le site LISEZ CES CONDITIONS ATTENTIVEMENT AVANT D’UTILISER CE SITE WEB.
Proceedings of the 1st International Conference on Learning Analytics and Knowledge: LAK'11, pp. 104-109, 2011-03-01
READ THESE TERMS AND CONDITIONS CAREFULLY BEFORE USING THIS WEBSITE.
https://nrc-publications.canada.ca/eng/copyright
NRC Publications Archive Record / Notice des Archives des publications du CNRC : https://nrc-publications.canada.ca/eng/view/object/?id=7eb5062a-701b-480f-9b10-ec96d72c04b3 https://publications-cnrc.canada.ca/fra/voir/objet/?id=7eb5062a-701b-480f-9b10-ec96d72c04b3
NRC Publications Archive
Archives des publications du CNRC
This publication could be one of several versions: author’s original, accepted manuscript or the publisher’s version. / La version de cette publication peut être l’une des suivantes : la version prépublication de l’auteur, la version acceptée du manuscrit ou la version de l’éditeur.
For the publisher’s version, please access the DOI link below./ Pour consulter la version de l’éditeur, utilisez le lien DOI ci-dessous.
https://doi.org/10.1145/2090116.2090131
Access and use of this website and the material on it are subject to the Terms and Conditions set forth at
The value of learning analytics to networked learning on a personal learning environment
The Value of Learning Analytics to Networked Learning on a Personal Learning Environment
Abstract. Some might argue that the analytics tools at our disposal are currently mainly used for boring purposes, such as improving processes and making money. In this paper we will try to define learning analytics and their purpose for learning and education. We will ponder on the best possible fit of particular types of research methods and their analysis. Methodological concerns related to the analysis of Big Data collected on online networks as well as ethical and privacy concerns will also be highlighted and a case study of the use of learning analytics in a Massive Open Online Course explored. Key words: Learning Analytics, Analytics Tools, Massive Open Online Courses, Educational Research, Big Data
Introduction
The Internet and its recent tools and Web developments have added new research and evaluation tools to the arsenal of the educational researcher [2][3]. As educational practice and the settings in which learning takes place have changed with the proliferation of the Internet and its available tools, careful thought about these tools and considerations of the processes and means with which data is being collected and analyzed is once again required [4]. Lazer et al. [4] stress that social scientists have lagged behind researchers in other fields, for instance in fields such as biology and physics, and that it is unavoidable for analytics to become part of social science research. Moreover, they emphasise the urgency for a data-driven computational social science to develop „based in an open academic environment‟, rather than in the domain of private companies such as Google and Yahoo, and government agencies who are currently the main players in the analytics field. They answer the question: “What value might a computational social science – based in an open academic environment – offer society, by enhancing understanding of individuals and collectives?” [4, p.721]. We would like to add to this question one in the context of this paper: what would it offer stakeholders in the evaluation and improvement of the learning process: educators, researchers, administrators and learners themselves? In this paper we will illustrate the research methods used in exploring networked learning on a Massive Open Online Course.
Defining Learning Analytics
Analytics of web environments have been around for a while. The first reports we could find were from the mid 90s, and relate to the analysis of market trends using web logs and browser tags online [5]. Boyd highlights the „Big Data‟ development on the Internet, which “has created unprecedented opportunities for people to produce and share data, interact with and remix data, aggregate and organize data. . . .” [3, p1]. Educause [6] highlights features of analytics tools: „provide statistical evaluation of rich data sources to discern patterns that can help individuals at companies, educational institutions, or governments make more informed decisions.‟ There is a clear contradiction in this sentence: statistical evaluation of rich data sources. It seems that statistical evaluation is the perfect tool not for „rich‟ data sources, but for a „multitude‟ of data sources. Some researchers in the qualitative tradition might argue that „rich‟ data sources would
be better analyzed through qualitative methods as these would be better at capturing the depth and richness than statistical analysis could do.
Norris et al. [7] have a slightly different emphasis on the use of analytics; they would like analytics to be used to measure, compare and improve the performance of individuals, not just to better the experience but also to facilitate better outcomes to the activity. In the more specific context of education and learning some interesting distinctions in ideas and definitions on analytics have been proposed. Most analytics are related to the introduction of Learning Management Systems (LMSs) and are sometimes called Academic Analytics[8][9][10]. With the introduction of LMS came the back office functionality that would provide traces of participant‟ activities on the system and this data was then used to aid the management and effectiveness of institutional teaching and learning. Dawson et al. [9] added that the analysis of this data might be used to improve the student learning experience, which would not only require a quantitative analysis, but also a qualitative one, or at least a qualitative interpretation of findings. The interpretation would have to include a value judgment on people‟s use of the environment: not only counting who uses the environment for what, but also judging what might be a good and what might be a bad experience, and offering suggestions for moving on the continuum from one to the other. The conference organizers provided us with their definition of learning analytics, which seems to express most of the above: “Learning analytics is the measurement, collection, analysis and reporting of data about learners and their contexts, for purposes of understanding and optimising learning and the environments in which it occurs.”
Different Types of Analysis for Different Purposes
It follows that not only quantitative data should be used, but also qualitative as data collection would not only relate to the increase of the effectiveness of learning, for instance by showing trends in use, but also with possible changes in the learning process. As highlighted by Downes [10]: “There are different tools for measuring learning engagement, and most of them are quantificational. The obvious ones [measure] page access, time-on-task, successful submission of question results – things like that. Those are suitable for a basic level of assessment. You can tell whether students are actually doing something. That’s important in certain circumstances. But to think that constitutes analytics in any meaningful sense would be a gross oversimplification. There is a whole set of approaches having to do with content analysis. The idea is to look at contributions in discussion forums, and to analyze the kind of contribution. Was it descriptive? Was it on-topic? Was it evaluative? Did it pose a question?” [10]
Parry [11] and Kop [12] highlight possibilities to take this one step further, and suggest that analytics could be used not only to provide managers of learning and possibly educators and learners with information that they can use to improve learning, but also to provide learners with recommendations in their learning based on earlier learning activity. This would, however, require that data is used in a different way than in academic analytics. It would entail that data is not just analyzed with steps being taken by people to improve the performance in formal education but rather that technological means are being used to link data and use it to improve learning. This would change the realm of analytics and move it outside academic management and perhaps back onto the open wider Web, as people don‟t only learn in a formal academic environment but also outside it. We are most interested in analytics on online networks as our research interest is in Personal Learning Environments (PLEs).
Methods Used in Learning Analytics of Online Networks
Research in the intricacies of learning taking place on online networks is one of the means for our research into the design and development of a PLE. If people are encouraged to move away from the institution for their learning, it is important to find out if the informal (online) networks in which people do find their information and where they might develop understandings, are valuable to their learning experience. A network in the context of this paper would be an open online „space‟ where people meet, as nodes on networks, while communicating with others and while using blogs, wikis, audio-visuals and other information streams and resources. De Laat [13] highlighted the complexity of researching networked learning and emphasized as key problems the issues of human agency and the multitude of issues involved, such as the dynamics of the network, power-relations on the network, and the amount of content generated. Effective analysis would require a multi-method approach. He suggested the use of computer-generated content analysis to explore what people are discussing. In addition, interviews with an emphasis on critical event recall focusing on the experiences of participants to find out „why they are talking as they do‟ and Social Network Analysis to find out the dynamics of the network to see „who communicates with whom‟ [13, p. 110].
This seems a viable choice of research methods. Social Network Analysis would be a form of learning analytics, and a quantitative method, and could clarify who the central nodes on the network were, in other words which people on the network performed vital roles of connecting to the otherwise un-connected. It could also provide information on the importance of “connectors” to other networks, which would be important in finding out who the innovators on the network were, i.e. the ones to link vital information streams [14].
We would argue for the use of additional qualitative methods and that virtual ethnography would be the most appropriate method of qualitative research on learning networks. Researchers in this tradition work towards research data analysis that reflects as closely as possible what is happening in the chosen setting. The researcher is interested in the processes taking place, the perspectives and understandings of the people in the setting, the “details, context, emotion and the webs of social relationships that join persons to one another” [15, p. 55]. Hine [16] highlighted that in a technologically rich environment, such as the Internet, the technology itself and the artefacts it produces should be taken into consideration in the „online‟ ethnography as well, as these are part of the research setting and might influence the human interactions researched.
As vast amounts of data are being generated in networked learning in an open environment, computational tools for analysis and interpretation will have to play a role in the research. Some argue for a mixed-method approach in educational research as “the theories we hold, and the training we have received, critically affect the data we collect and the lenses we choose in looking at such data‟ [17, p. 30]. They argue that the use of more than one method in research will increase its robustness [15]. Boyd [3, p.2-5], a social scientist researching „Big Data‟ highlights some other methodological concerns especially when analyzing Big Data collected on online networks: 1) bigger data is not always better data than obtained in other research as reliability will very much depend on the sampling strategies being used; 2) caution needs to be taken as not all data are created equally; 3) what people do is of limited importance unless you
also ask people why they did what they did; 4) she argues that qualitative researchers are not the only ones interpreting data, that also quantitative researchers do this; dispelling the myth that „it is qualitative researchers [who] are in the business of interpreting stories and quantitative researchers [who] are in the business of producing facts’. Interpretation as part of analysis is the hardest of any data analysis, big or small. Boyd [3] would like to see computer experts working together with social scientists to avoid fallacies in interpretations.
Researching a MOOC: Analytics, Data mining or Qualitative Analysis
Background of the research
The research in this paper was carried out during The Personal Learning Environments Networks and Knowledge (PLENK2010 – http://connect.downes.ca) course in the fall of 2010. It was a free Massive Open Online course which lasted for 10 weeks. In total, 1641 participants were registered. The course was a joint venture between the National Research Council of Canada‟s (NRC) Institute for Information Technology, Learning and collaborative Technologies Group, PLE Project, The Technology Enhanced Knowledge Research Institute (TEKRI) at Athabasca University, and the University of Prince Edward Island. Four facilitators, highly visible and knowledgeable in the field of study, were active on the course and would find resources, speakers and participate in all aspects of the course.
PLENK2010 did not consist of a body of content and was not conducted in a single place or environment. It was distributed across the web. This type of learning event is called a „connectivist‟ course and is based on four major types of activity: 1) Aggregation: access to a wide variety of resources to read, watch or play, along with a newsletter called „The Daily‟, which highlighted some of this content; 2) Remixing: after reading, watching or listening to some content, it was possible to keep track of that somewhere-i.e., by creating a blog, an account with del.icio.us and creating a new entry, taking part in a Moodle discussion, or using any service on the internet – Flickr, Second Life, Yahoo Groups, Facebook, YouTube, iGoogle, NetVibes; 3) Repurposing: participants were encouraged to create something of their own. In the PLENK2010 the facilitators suggested and described tools that participants could use to create their own content. The job of the participants was to use the tools and just practice with them. Facilitators demonstrated, gave examples, used the tools themselves, and talked about them in depth. It was envisaged that with practice participants would become accomplished creators and critics of ideas and knowledge; and 4) Feed Forward: participants were encouraged to share their work with other people in the course, and with the world at large. Participants were able to work completely in private, not showing anything to anybody if they wished to do so. Facilitators emphasized that sharing would always be the participant‟s choice. In addition, a tag would be used to identify anything that was created in relation to the course, using the course tag #PLENK2010. That is how content related to the course was recognized, aggregated, and displayed in „The Daily‟ newsletter for the course.
If participants decided to use a tool such as Blogger, Flickr, or a discussion group they were asked to share the RSS feed. A separate post on how to produce and include their own RSS feed to the Daily was offered for those who did not know how to do this. All postings to a blog or forum would apply the #PLENK2010 tag. That is how information was recognized as being related to this particular course. When a connectivist course is working really well, one can see a
great cycle of content and creativity begin to feed on itself, people in the course reading, collecting, creating and sharing.
Research methods and tools used
The NRC research team decided to use a mixed methods approach and a variety of research techniques and analysis tools to capture the diverse activities and the learning experiences of participants on PLENK2010. Learning analytics tools were used as a quantitative form of Social Network Analysis to clarify activity and relationships between nodes on the PLENK network. Three surveys were carried out at the end of the course and after it had finished to capture learning experiences during the course: End survey (N=62); „Active producers‟ survey (N= 31); „Lurkers‟ survey (N=74).
In addition, qualitative methods in the form of virtual ethnography have been used. A researcher was an observer during the course, collecting qualitative data through observation of activities and engagement and also carried out a focus group in the final week of the course to gain a deeper understanding of particular issues related to the active participation of learners. As vast amounts of discursive data were generated and collected, analysis and computational tools have been used to represent large networks of activity in the PLENK, to identify themes in the data and for analysis and interpretation of the qualitative research data (e.g., SNAPP, Pajek, NetDraw and Nvivo).
For the data analysis on the course the Moodle data mining functionality was used and provided participant details, their level of use and access of resources, information on course activities, and discussions taking place in the course forums. The gRSShopper aggregator statistics functionality provided details on course-related use of blogs and micro-blogging tools such as Twitter. Some analytics and visualization tools, such as the Social Networks Adapting Pedagogical Practice (SNAPP) tool, were also used to deliver real-time social network visualizations of Moodle discussion forum activity, while the visualization tool NetDraw was used to create an ego network to provide an understanding of the role of a particular actor in a discussion.
Findings
The professional background of participants on the PLENK course, were mainly employed in education, research and design, and development of learning opportunities and environments. They were teachers, researchers, managers, mentors, engineers, facilitators, trainers, and university professors.
Analyzing and visualizing participation on the course
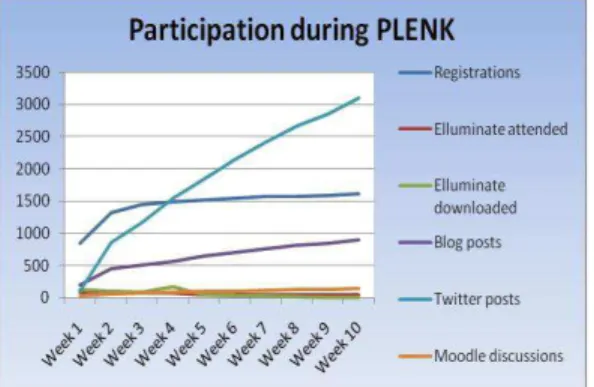
When the course started 846 had registered, which steadily increased to 1641 at the end of the course, as shown in Figure 1. People took part in the twice weekly meeting sessions that were hosted on Elluminate, once a week with an invited speaker and once as a discussion session amongst the group and facilitator(s). Actual presence at these synchronous sessions decreased over the weeks from 97 people in week two, when attendance was the highest, to 40 in the final week and there was a similar trend in the access of the recordings. Global participation and multiple time zones influenced who were present and who accessed the Elluminate recordings. A high number of blog posts were generated related to the course (949) and an even higher number
of Twitter contributions (3459) as a means of connection participants inside and outside the course (see Figure 2).
Figure 1. Participation during PLENK Figure 2. Twitter activity in PLENK
The #PLENK2010 identifier facilitated the easy aggregation of blog posts, del.icio.us links and Twitter messages produced by participants, which highlighted a wide number of resources and links back to participant‟s blogs and discussion forums, and thus connecting different areas of the course. Although the number of course registrations was high, an examination of contributions across weeks (i.e., Moodle discussions, blogs, Twitter posts marked with #PLENK2010 course tag, and participation in live Elluminate sessions) suggested that about 40-60 individuals on average contributed actively to the course on a regular basis by producing blog posts and discussion posts, while other‟s visible participation rate was much lower. A total of 652 participants used Twitter and were linked to other #tag networks as suggested in Figure 3.
Figure 3. Twitter networks that participants were also linked to with #tags
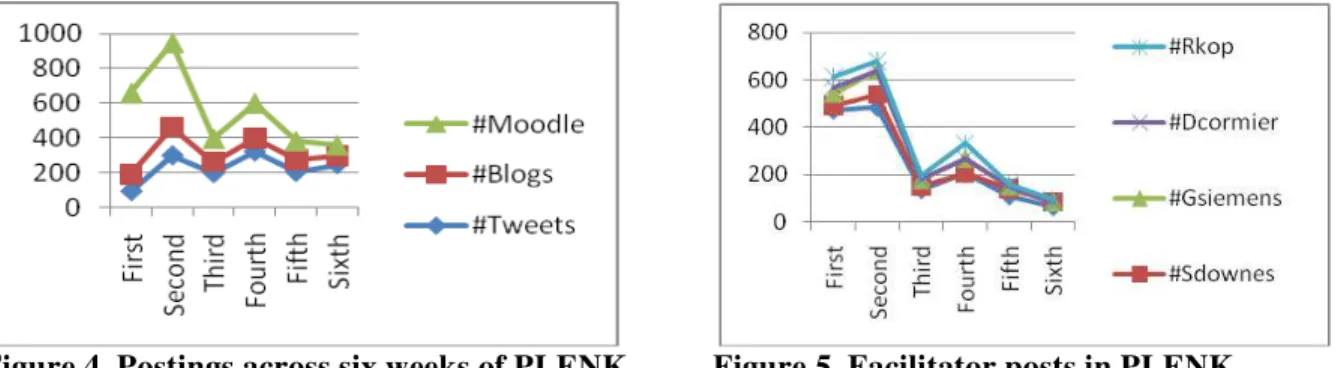
In the Moodle Forums for PLENK2010, general trends in posting behaviors indicate that there was a peak in activity in Week 2 in Moodle forums, with a slight upward trend in Blog and Twitter posts as well (Figure 3). This was followed by a sharp decline in the number of posts in all three mediums (Moodle, Blogs, and Twitter) in Week 3, a slight increase in Week 4, and a steady decline again in Weeks 5 and 6. Interestingly, the number of posts by course facilitators
follows similar trends (Figure 4), with the number of posts by facilitators peaking in Week 2, then showing a steady decline in Weeks 5 and 6. The facilitator(s) played an important role in triggering discussion, questioning, providing feedback, and sustaining interaction amongst participants.
Figure 4. Postings across six weeks of PLENK Figure 5. Facilitator posts in PLENK
Social Networks Adapting Pedagogical Practice (SNAPP) uses information on who posted and replied to whom, and what major discussions were about, and how expansive they were, to analyze the interactions of a forum and display it in a Social Network Diagram. Figures 5 and 6 provide a visual depiction of all interactions occurring among students and facilitators in PLENK2010 for Week 1-Discussion on PLE/PLNs. The social network diagram provides an aggregate visual representation of the connections that occurred between 69 participants for this particular discussion and is an aggregate visual representation of the interactions among participants but is not very comprehensive in describing the nature of the interaction (i.e., the quality).
Figure 5. Social network and connections Figure 6. Relationships between main topic between participants discussion in Week1
Some people with experience in learning on a MOOC were very active and involved in the course, producing a Google map for PLENK participant place of residence, another created a concept map to represent their PLE, while others produced Wordles to visualize the content of a paper. Not all participants contributed in a visibly active way. A high number of people accessed resources but were not engaged in producing blog posts, videos or other digital artifacts; they seemed to be consumers rather than producers on the course. Only a small percentage of participants engaged in the production of digital artifacts. Between 40 and 60 were active producers, the other 1580 were not visibly active. This was unexpected to the course organizers as before the start they saw the production phase as vital to the learning on a networked environment. After all, as some participants mentioned in the discussion, if nobody is an active
producer, it limits the resources that all participants can use to develop their ideas, to discuss, think, and be inspired by in their learning. Analyzing the word frequency in the Moodle discussion forum for Week 1 using Nvivo 9 highlighted the importance of “personal agency” in maintaining engagement, participation, and interaction with others. Keywords such as “learning”, “me”, “network”, “question”, and “exploration” in Week 1 discussions were focused on PLE/PLNs concept map activities. Connections between participants were made which supported the learning process as interactions generated many resources, including 49 links and 17 suggestions for useful tools.
The use of the #PLENK2010 hash tag made it possible to aggregate blog post and Twitter messages and visualize and organize them into the Daily newsletter and a Twitter newsletter. The end of survey results confirm that although the Daily newsletter and Moodle helped 45% of participants understand the course content, learners needed a common space to create artifacts and connect back to their blog, such as Amplify for example, for social sharing and bringing together various media and resources. One participant commented in the survey: “I would have liked to see a thread each week called, How Can We Help You allowing the community to answer many of the questions and offer more support, mentoring, and evaluations”.
Discussion and Conclusions
This paper has highlighted some of the possible uses of current analytics tools in providing useful information to participants and facilitators about their participation and social connections within the Massive Open Online Course and outside it, but also the limitations of visualization, knowledge representation, and virtualization in providing meaningful information about learning.
The mixed method approach used has highlighted the effectiveness of combining both quantitative and qualitative methods to achieve breadth and depth of data analyses. Quantitative analyses have exposed a basic level of assessment and reporting on learner activity, on whether participants are actually doing something, in this case either inside the Moodle environment and corresponding activity outside the environment including Blog and Twitter activity being tracked with the #PLENK2010 course tag. Qualitative tools and approaches (e.g., SNAPP, Nvivo, NetDraw) demonstrated how deep exploration of content can reveal the types of contributions made, as well as the knowledge, ideas, thinking, information, tools, and experience that promote learning along the way. But still, the need for human analysis and interpretation has also become apparent.
From a research point of view, the time and efforts needed to conduct various analyses on two forum discussions was prohibitive, but yielded a detailed view of what actually occurred in one discussion, including the processes, the learning, and important outcomes. The use of tags in the Moodle environment would have been helpful in linking various contents across weeks, allowing participants to search for relevant content and to see how they were connected to various content and people with similar interests.
Analytics can be applied to structure mining (link information), content mining (including text, images, audio files), usage mining and transaction data. Structure mining is often more valuable when it is combined with content mining of some kind to interpret the hyperlinks‟ contents. Vast
amounts of data were being generated in this example of networked learning in an open environment, so much so that facilitators, participants, and researchers could not possibly attend to all the details but needed to focus on the most relevant information efficiently and effectively in order to encourage better outcomes of activity. Intelligent and automatic data analysis with powerful computational tools for analysis and interpretation should be explored as a valid option for informing learning in MOOC in a connectivist-type course.
One of the limitations of the analytics approach, however, was the narrow scope of the analyses, as focused on one snapshot of the MOOC experience for Week 1 and 2 related to the topic of PLE/PLNs. It did expose what was occuring within the course when there was a peak in activity and when data was plentiful but did not expose gaps in the data that capture experiences that were lacking or nonexistant, and missing data, for instance in the case where people were „lurking‟ and their activity related to the course invisible. Qualitative methods will be applied to give more meaning to the experiences of those on the periphery, the non-active participants, and those who were perhaps lacking the skills or mechanisms for engaging wholeheartedly in the course. Interviews with participants who were either not connected, not visible on the “PLENK2010 social network” or on the fringes will provide them with a voice as the analytics used in our analysis could not capture their learning stories and made them into a marginalized, invisible group.
Another limitation of analytics has been their inability to capture contextual nuances in data. Analytics can provide a view of what is happening, but it has problems representing the nature of connections between data sets and people. Human interpretation or artifical intelligence capacity will be necessary to achieve this. Facilitators and participants themselves were exposed to analytics tools within the PLENK2010 course and in one of the discussions concluded that although they provided a global view of social networks in the MOOC they lacked sufficient detail to be really informative. A greater understanding of how learners communicate, complete tasks and construct new knowledge in a Moodle environment, combined with blogs, and Twitter activity will inform the design and development of optimal learning experiences.
Further analyses will be undertaken after the course has been completed with more options for analyses of data involving interpretation of meanings and human actions rather than a focus on the numbers. This work is expected to be completed in time for presentation at the conference on Learning Analytics and Knowledge, February 27-March 01, 2011.
The use of learning analytics is only in its infancy, but from our use of the tools it seems that they can be powerful in giving meaning to interactions and actions in a learning environment such as was used on this MOOC, providing scope for personalized learning and the creation of more effective learning environments and experiences. Personalization and analysis of user interaction data is a key approach to overcoming the problems related to the overpowering plethora of information available and generated through technology in an open networked learning environment. More in depth analyses of the data from PLENK will feed into the development of support structures of optimal learning experiences in Personal Learning Environments.
Learning analytics tools have clearly provided scope for information filtering and visualization, as promising technologies to support people in clarifying and relating information, peer learners and digital artifacts and in doing so supporting people in pursuing their learning.
References
1. Anderson, T. and Kanuka, H.: E-Research: Methods, Strategies, and Issues, Allyn & Bacon, Boston, New York (2003).
2. Boyd, D.: Privacy and Publicity in the context of Big Data, available at
http://www.danah.org/papers/talks/2010/WWW2010.html , Raleigh, North Carolina, April 29th 2010 (Accessed, 16th October, 2010).
3. Lazer, D., Pentland, A., Adamic, L., Aral, S., Barabasi, A, Brewer, D., Christakis, N., Contractor, N., Fowler, Gutmann, M., Jebara, T., King, G., Macy, M., Roy, D., and van Alstyne, M.: Computational social Science, in Science, Vol 323, 6 February 2009, Www.Sciencemag. org (Accessed 12th October, 2010).
4. Ballardvale Research (n.d.).: Market Trends - Web Analytics: History and Future, available from http://www.ballardvale.com/free/WAHistory.htm (Accessed 14th October 2010). 5. EDUCAUSE Learning Initiative.: 7 Things you should know about ANALYTICS, Available
from http://net.educause.edu/ir/library/pdf/ELI7059.pdf (Accessed, 3rd November 2010). 6. Norris, D., Baer, L. & Offerman, M.: A National Agenda for Action analytics, National
Symposium on Action Analytics , available from
http://www.edu1world.org/PublicForumActionAnalytics/ (Accessed 14th October 2010), (2009).
7. Campbell, J. & Oblinger, D.: Academic analytics, Educause (2007).
8. Dawson,S., Heathcote, L. & Poole, G.: Harnessing ICT potential: The adaptation and analysis of ICT systems for enhancing the student learning experience. International journal of Educational Management, 24, 2 (2010).
9. Dell cloud Services.: Collaboration, Analytics, and the LMS: A Conversation with Stephen Downes, in Learning Management that fits, Dell cloud services, available from
http://bit.ly/938t1o (Accessed 14th October 2010).
10. Parry, M.: Like Netflix, New College Software Seeks to Personalize Recommendations, The chronicle of Higher Education, available from http://chronicle.com/blogs/wiredcampus/like-netflix-new-college-software-aims-to-personalize-recommendations/27642 (2010).
11. Kop, R.: The Design and Development of a Personal Learning Environment: Researching the Learning Experience, European Distance and E-learning Network annual Conference 2010, June 2010, Valencia, Spain, Paper H4 32 (2010).
12. Laat, de, M.: Networked Learning, PhD Thesis, Instructional Science, Utrecht Universiteit, The Netherlands (2006).
13. Krebs, V.: Social Network Analysis, A Brief Introduction, OrgNet.com, Available from http://www.orgnet.com/sna.html (Accessed 16th October 2010), (2007).
14. Hammersley, M., Gomm, R., Woods, P., Faulkner, D., Swan, J., Baker, S., Bird, M., Carty, J., Mercer, N., and Perrott, M.: Research Methods in Education Handbook, Milton Keynes, Open University (2001).
15. Hine, C.: Internet Research and the Sociology of Cyber-Social-Scientific Knowledge, The Information society, 21, pg. 239-248 (2005).
16. Sloane, F., and Gorard, S.: Exploring Modeling Aspects of Design Experiments, Educational Researcher, 32, 1, 29-31 (2003).