HAL Id: hal-00545322
https://hal.archives-ouvertes.fr/hal-00545322
Submitted on 10 Dec 2010
HAL is a multi-disciplinary open access archive for the deposit and dissemination of sci-entific research documents, whether they are pub-lished or not. The documents may come from teaching and research institutions in France or abroad, or from public or private research centers.
L’archive ouverte pluridisciplinaire HAL, est destinée au dépôt et à la diffusion de documents scientifiques de niveau recherche, publiés ou non, émanant des établissements d’enseignement et de recherche français ou étrangers, des laboratoires publics ou privés.
improve phytate P availability to chickens
Yves Nys
To cite this version:
Yves Nys. Characterisation of European varieties of triticale with special emphasis on the ability of plant phytase to improve phytate P availability to chickens. British Poultry Science, Taylor & Francis, 2007, 48 (06), pp.678-689. �10.1080/00071660701691292�. �hal-00545322�
For Peer Review Only
Characterisation of European varieties of triticale with special emphasis on the ability of plant phytase to improve
phytate P availability to chickens
Journal: British Poultry Science Manuscript ID: CBPS-2007-148 Manuscript Type: Original Manuscript Date Submitted by the
Author: 15-Jun-2007
Complete List of Authors: Nys, Yves; INRA, Recherches Avicoles
Keywords: chicken, triticale, phytase, phosphorus, viscosity
For Peer Review Only
12 3
Characterisation of European varieties of triticale with special emphasis on the ability of 4
plant phytase to improve phytate phosphorus availability to chickens 5
6
C. JONDREVILLE, C. GENTHON1, A. BOUGUENNEC2, B. CARRE1, Y. NYS1* 7
8
Institut National de la Recherche Agronomique INRA, UMR1079 Systèmes d’élevage
9
Nutrition Animale et Humaine, Agrocampus, F-35590 Saint-Gilles, 1INRA, UR83 Recherches
10
Avicoles, F-37380 Nouzilly, 2INRAUMR1095 Amélioration et Santé des Plantes, Domaine de
11
Crouelle, UBP, F-63000 Clermont-Ferrand, France
12 13 14 15 16 17 18 19 20 21
To whom correspondence should be addressed.
22 Fax: +33 (0) 247427778 23 Tel: +33 (0) 247427700 24 E-mail: nys@tours.inra.fr 25 26
ed. MacLeod, September 2007
RUNNING TITLE: TRITICALE FOR CHICKENS
Accepted for publication 14th June 2007
3 4 5 6 7 8 9 10 11 12 13 14 15 16 17 18 19 20 21 22 23 24 25 26 27 28 29 30 31 32 33 34 35 36 37 38 39 40 41 42 43 44 45 46 47 48 49 50 51 52 53 54 55 56 57 58 59 60
For Peer Review Only
Abstract 1. A total of 30 varieties and selection lines of triticale grown under similar 1
conditions were characterised. Thousand grain weight, specific weight, Hagberg falling 2
number and N were 50.2 ± 5.0 g, 72.4 ± 2.1 kg/hl, 96 ± 48 s and 16.1 ± 0.11 g/kg, 3
respectively. 4
2. Mean phosphorus (P) concentration was 2.86 ± 0.31 g/kg, of which 77% was of phytic 5
origin. Mean phytase activity was 1018 ± 319 PU/kg. A genotypic effect on phytase activity 6
was detected amongst 5 varieties studied out of 30. Potential and real applied viscosities were 7
positively correlated and mean values were 3.53 ± 0.66 and 2.15 ± 0.31 ml/g, respectively. 8
3. The efficacy of plant phytase in improving P availability was assessed in chickens up to 3 9
weeks of age. Growth performance and bone ash concentration were compared in birds given 10
either a maize (450 g/kg) and soybean meal (230 g/kg) phosphorus deficient diet containing 11
3.5 g P/kg, this basal diet supplemented with 1 or 2 g P/kg as monocalcium phosphate (MCP) 12
or triticale (450 g/kg) and soybean meal (230 g/kg) diets containing 3.2 to 3.8 g P/kg with no 13
MCP. To achieve graded levels of phytase activity, 4 varieties of triticale, intact or in which 14
phytase was denaturated by heat treatment, were used. Estimated metabolisable energy, 15
protein, amino acids and calcium concentrations were similar in all diets. 16
4. Phytase activity in the triticale-based diets ranged between 135 and 1390 PU/kg. Growth 17
performance and bone ash were responsive to plant phytase and to MCP. Non-linear models 18
of these responses were adjusted with the best fit for bone ash parameters. 250, 500 and 1000 19
PU of plant phytase were estimated to be equivalent to 0.46, 0.67 and 0.81 g P as MCP, 20
respectively. 21
INTRODUCTION 22
Triticale is a hybrid of wheat and rye that has been proposed as an alternative cereal in animal 23
feeding because of its potential combination of wheat feeding characteristics and rye winter 24 3 4 5 6 7 8 9 10 11 12 13 14 15 16 17 18 19 20 21 22 23 24 25 26 27 28 29 30 31 32 33 34 35 36 37 38 39 40 41 42 43 44 45 46 47 48 49 50 51 52 53 54 55 56 57 58 59 60
For Peer Review Only
hardiness and disease resistance (Gatel et al., 1985; Vieira et al., 1995). Several grain 1
constituents play a role in optimum utilisation of this cereal by poultry. Among them, both 2
soluble non-starch-polysaccharides (NSP), mainly arabinoxylans present in the albumen, and 3
available phosphorus (P) are of great impact with regard to the nutritive value of the cereal 4
and to the alimentary strategies to control environmental pollution problems (Carré et al., 5
1994; Barrier-Guillot et al., 1996b) and are worth consideration in varietal selection 6
programmes. Improvements in nutritional value of triticale for broilers will increase the 7
economical interest in replacing wheat by triticale in broilers (Korver et al., 2004). Protein 8
concentation and its amino acid profile as well as metabolisable energy are key contributors to 9
feeding value. High contents of arabinoxylans should be avoided, because this might increase 10
feed viscosity, reduce digestibility of various components and induce over-consumption of 11
water by birds, which results in aqueous excreta (Carré et al., 2002). In contrast, high P 12
availability reduces the requirement for supplementing diets with mineral P leading to lower 13
excretion of this element by the animals. 14
The effect of arabinoxylans on viscosity can be assessed by means of real applied 15
viscosity (RAV) and potential applied viscosity (PAV) which refer to viscosity measured 16
when endogenous xylanases are allowed to act and are inactivated, respectively (Carré et al., 17
1994; Carré, 2002). In wheat, these parameters are factors of variation in metabolisable 18
energy (Carré et al., 2002). Bouguennec et al. (2000) reported PAV values from 1.6 to 5.1 for 19
49 varieties of triticale from the official French catalogue and highlighted that PAV is mainly 20
under genetic control, even if it may also be affected by environmental conditions. Similarly 21
in wheat, RAV and PAV are dependent on the genotype, although RAV, which depends on an 22
enzymatic activity, is affected by an environment x genotype interaction (Oury et al., 1998). 23
In wheat, variability in P availability for poultry is mainly related to phytase activity 24
but not to phytic P concentration (Barrier-Guillot et al., 1996b). Moreover, phytase activity 25 3 4 5 6 7 8 9 10 11 12 13 14 15 16 17 18 19 20 21 22 23 24 25 26 27 28 29 30 31 32 33 34 35 36 37 38 39 40 41 42 43 44 45 46 47 48 49 50 51 52 53 54 55 56 57 58 59 60
For Peer Review Only
displays a significant genotypic effect in wheat, although it is also influenced by a genotype x 1
environment interaction (Barrier-Guillot et al., 1996a; Oury et al., 1998). Triticale has been 2
reported to display a phytase activity intermediate between those of wheat and rye (770, 460 3
and 5350 phytase units (PU)/kg, respectively according to INRA-AFZ, 2004) but the 4
available studies (Eeckhout and De Paepe, 1994; Nys et al., 1996; Skiba et al., 2004) do not 5
provide information about the actual genotypic variability. Besides, the effectiveness of plant 6
phytase to improve P availability in chickens has mainly been studied in wheat (Barrier-7
Guillot et al., 1996b; Potkansky, 2000; Paik, 2003; Juanpere et al., 2004), with little 8
information available for triticale. Almost no information about the potential sparing effect of 9
triticale on the need for mineral P supplementation is available. 10
The aim of the present study was to evaluate the genotypic variability, in triticale, of 11
several characteristics including viscosity and phytase activity. In addition, the efficacy of 12
plant phytase contained in triticale to reduce the required mineral P supplementation in diets 13
for chickens was evaluated. 14
MATERIALS AND METHODS 15
Triticale varieties and lines 16
A total of 30 varieties and selection lines of triticale originating from different areas in Europe 17
and covering a wide range of genotypic variability were selected. They were grown at the 18
INRA research station in Clermont-Ferrand under a single crop management system adapted 19
to the local conditions. The 30 batches were each collected from a single plot (Table 1). In 20
addition, 5e varieties (DI34-2, Trimaran, Aubrac, Capitale and Calao) were chosen for the 21
wide range in phytase activity they displayed. They were each grown on 4 - 6 plots and were 22
used to assess the genotypic effect on phytase activity. Four out of these 5 latter varieties 23
(DI34-2, Trimaran, Aubrac and Calao) were used to assess response of chickens to graded 24 3 4 5 6 7 8 9 10 11 12 13 14 15 16 17 18 19 20 21 22 23 24 25 26 27 28 29 30 31 32 33 34 35 36 37 38 39 40 41 42 43 44 45 46 47 48 49 50 51 52 53 54 55 56 57 58 59 60
For Peer Review Only
levels of plant phytase. For this latter study, a mixture in equal proportions of the 4 to 6 1
available sub-batches of each variety was constituted. 2
Broiler experiment 3
The experiment was conducted under the animal research guidelines of the French Ministry of 4
Agriculture. From hatching till 5 d of age, 220 male Ross white chicks were placed in plastic-5
coated cages of two or three birds each and fed on a standard diet covering all nutrient 6
requirements (INRA, 1989). At d 5, chicks were individually weighed after an overnight fast 7
and the 192 chicks closest to the mean weight of 75.7 ± 1.78 g were placed in 96 plastic-8
coated cages, with two birds of similar initial live weight in each. For the subsequent 16-d 9
experiment, chicks were fed on one of 12 experimental diets (8 cages per diet). The initial 10
room temperature of 32°C was gradually decreased to to 30 and 28°C when the chicks 11
reached the ages of 2 and 14 d, respectively. During the first 2 d, birds were kept under 24 h 12
light a d and 23 h light per d thereafter. Birds had free access to water throughout the 13
experiment. After a 12 to 14-h fast, each chicken was weighed and killed and its right 14
tibiotarsus was collected. Feed consumption was recorded per cage for the 16-d experimental 15
period. Feed conversion ratio (FCR) was calculated as the ratio of feed intake to weight gain 16
over the 16-d experimental period. 17
Twelve diets were formulated to meet all nutrient requirements of the birds (INRA, 18
1989), except available P. Feedstuffs were ground in a hammer mill fitted with a 2.5 mm 19
screen prior to incorporation in the diet. Mixed diets were pelleted without steam addition. 20
Damage to plant phytase was not expected, as outlet temperature did not exceed 50°C. The 21
three first diets, with a phytase activity below the detection limit of 50 PU/kg, were based on 22
maize (450 g/kg) and soybean meal (230 g/kg) and contained graded levels of monocalcium 23
phosphate (MCP, 0, 1 and 2 g/kg in diets 1, 2 and 3, respectively) (Table 2). The basal diet 24
without any inorganic phosphorus contained 3,5 g P/kg and was deficient in non-phytic 25
Table 1 near here 3 4 5 6 7 8 9 10 11 12 13 14 15 16 17 18 19 20 21 22 23 24 25 26 27 28 29 30 31 32 33 34 35 36 37 38 39 40 41 42 43 44 45 46 47 48 49 50 51 52 53 54 55 56 57 58 59 60
For Peer Review Only
phosphorus compared to the requirement for growing chickens. Diets 4 to 12, did not contain 1
any maize but 450 g/kg of triticale. No MCP was added. In order to achieve graded levels of 2
phytase activity, four different genotypes of triticale (DI34-2, Trimaran, Aubrac and Calao), 3
raw or heat-treated, were introduced in the diets 4 to 7 and 8 to 11, respectively. A mixture of 4
raw (200 g/kg) and heat-treated Calao (250 g/kg) was introduced in diet 12. Heat treatment, 5
which aimed at reducing phytase activity, consisted in two successive heatings in a 6
microwave oven at 600 W for 2 minutes. Measured phytase activity in the raw triticale-based 7
diets and in the heat-treated triticale-based diets was 620 to 1390 PU/kg and 135 to 180 8
PU/kg, respectively. It was 645 PU/kg in the diet containing the mixture of raw and heated 9
Calao. Maize starch, wheat straw, soy isolate, vegetable oil, calcium carbonate and DL-10
methionine were used to balance the diets so that estimates of metabolisable energy, protein, 11
lysine, sulphur amino acids, phytic P and Ca concentrations were similar in maize-based diets 12
and in triticale-based diets (INRA, 1989). Moreover, the varieties of triticale were chosen so 13
that dietary RAV remained below 1.40 mlL/g to ensure a limited effect of this parameter on 14
dietary metabolisable energy (Maisonnier et al., 2001). At the end, the 12 diets provided 15
similar and adequate amounts of nutrients for chicks except available P (INRA, 1989). 16
Sampling and analyses 17
Analyses were performed in duplicate or in triplicate. Thousand grain weight (TGW) was 18
assessed by passing 200 g of fresh grain through an automated Decca seed counter and 19
adjusting weights to 15% moisture content. Specific weight (SW) was measured by means of 20
a Nilema apparatus (Tripette et Renaud, France). The Hagberg falling number (HFN) was 21
assessed by means of a Falling Number apparatus type 1400 (Falling Number AB, Sweden) 22
after grinding with a Falling Number mill type KT120 (Falling Number AB, Sweden). 23
Samples of triticale and diets were ground to pass through a 0.5 mm screen and stored at 4°C 24
prior to the other analyses. N was determined by the Kjeldahl method according to the French 25 Table 2 near here 3 4 5 6 7 8 9 10 11 12 13 14 15 16 17 18 19 20 21 22 23 24 25 26 27 28 29 30 31 32 33 34 35 36 37 38 39 40 41 42 43 44 45 46 47 48 49 50 51 52 53 54 55 56 57 58 59 60
For Peer Review Only
standard AFNOR (NFV 18-100) using a Kjelfoss apparatus (A/S N Foss Electric, Denmark). 1
Dry matter (DM) was measured by drying at 103°C until constant weight. P was analysed by 2
means of the vanadate colorimetric method according to the AFNOR method (NFV 18-106). 3
Phytic P was determined by ion-pair HPLC (Column C18, Hypersyl C 18-5 µm 200 x 2 mm, 4
Interchim) after acidic extraction and anionic exchange purification according to the method 5
developed by Sandberg and Adherrine (1986) and modified by Lehrfeld (1989). Phytase 6
activity (PA) was measured colorimetrically after incubation in a sodium phytate solution 7
(Engelen et al., 1994). One phytase unit (PU) is the amount of enzyme that liberates 1 µmol 8
per minute of inorganic P from 5.1 mmol/l solution of sodium phytate, at pH 5.5 and 37°C. 9
Prior to viscosity determination, extraction (pH = 4.5, temperature = 19-23°C) was performed 10
with or without pre-treatment in hot ethanol: water (80: 20). RAV and PAV refer to viscosity 11
measured when endogenous xylanases were allowed to act and were inactivated by treatment 12
of the sample, respectively. The viscosity data were divided by the viscosity of the buffer, 13
which gave relative viscosities (Vr), transformed into natural logarithm and then divided by 14
the concentration (g/mL) of the plant material in the buffer extraction volume. The results 15
“(Ln(Vr))/(g/ml)” were expressed as ml /g (Carré et al., 1994; Carré, 2002). 16
Tibiotarsi were pooled per cage. They were cleaned of all soft tissues, defatted (24 17
hours in ether), dried (105°C for 12 hours) and weighed. Thereafter, they were ashed at 550°C 18
for 14 h in a muffle furnace and weighed. Ash concentration was calculated on a fat-free dry 19
matter (FF DM) basis. 20
Statistical analyses 21
Statistical analysis of data was performed by means of the GLM procedure of the Statistical 22
Analysis Systems software package version 8.1 (SAS, 1990). Correlation coefficients (r) 23
between physical and analytical characteristics of the 30 batches of triticale were calculated. 24
The effect of the variety on phytase activity was assessed by an analysis of variance using the 25 3 4 5 6 7 8 9 10 11 12 13 14 15 16 17 18 19 20 21 22 23 24 25 26 27 28 29 30 31 32 33 34 35 36 37 38 39 40 41 42 43 44 45 46 47 48 49 50 51 52 53 54 55 56 57 58 59 60
For Peer Review Only
plot as the experimental unit, followed by a comparison of means. The chickens’ responses 1
were analysed using the cage as the experimental unit. Data were first submitted to an 2
analysis of variance with the diet as main factor, followed by a comparison of means. 3
Polynomial regression of the indicators of performance and of bone mineralisation was used 4
to determine the presence of linear and quadratic effects of mineral P added in the diet and of 5
dietary phytase activity. Effects were considered significant when P<0.05. 6
Non-linear (NLIN procedure of SAS) functions were fitted to the response of 7
performance and bone FF DM and ash to dietary P as MCP and phytase activity, using 8
treatment means. Exponential models were chosen to describe the response to phytase and 9
linear or exponential models were chosen to describe the response to mineral P, according to 10
the results obtained by polynomial regression. The exponential model was chosen because it 11
was extensively used to describe the effect of microbial phytase on P availability (Kornegay 12
et al., 1996; Kornegay, 2001). The model was Y = a + b (1 - e - l MinP) + c (1 - e - k Phyt) or Y = a 13
+ b MinP + c (1 - e - k Phyt) with Y = response measurement, MinP = P added as MCP (g/kg 14
diet), Phyt = phytase activity (PU/kg diet). 15
The coefficient of determination (R²) of each equation generated was calculated as the 16
square of the correlation coefficient between predicted and observed individual values. An 17
equivalency value of mineral P as MCP (g) for plant phytase (PU) was calculated by setting 18
equal the terms corresponding to mineral P and phytase activity. 19
RESULTS AND DISCUSSION 20
Physical and chemical characteristics of the 30 batches of triticale 21
Physical and chemical characteristics of the 30 batches of triticale are presented in Table 1. 22
Phytase activity and especially HFN displayed the highest degree of variation, with 23
coefficients of variation (CV) of 31 and 49%, respectively. PAV and RAV exhibited a CV of 24
15-20%. Phytic P displayed a CV of similar order, although with only 11 measurements 25 3 4 5 6 7 8 9 10 11 12 13 14 15 16 17 18 19 20 21 22 23 24 25 26 27 28 29 30 31 32 33 34 35 36 37 38 39 40 41 42 43 44 45 46 47 48 49 50 51 52 53 54 55 56 57 58 59 60
For Peer Review Only
performed. The other parameters (TGW, N and total P) had lower amplitude of variation (CV 1
7-10%). This amplitude of variation represents genotypic variability since all the varieties 2
were grown under similar conditions. 3
Total P concentration in the 30 batches of triticale ranged between 2.06 and 3.57 g/kg with a 4
mean of 2.86 ± 0.31 g/kg. This average P concentration was slightly below the values of 3.7 ± 5
0.2 and 3.9 ± 0.1 g P/kg previously observed by Eeckhout and De Paepe (1994) and Skiba et 6
al. (2004) when analysing 6 and 4 varieties of triticale, respectively. Phytic P was measured
7
in only 11 out of the 30 batches and ranged between 1.50 and 2.62 g/kg, with a mean of 2.18 8
± 0.40 g/kg. These values compare with the 2.5 ± 0.2 and 2.4 ± 0.2 g phytic P/kg reported in 9
the two aforementioned studies. As previously observed in wheat (Barrier-Guillot et al., 10
1996a; Viveros et al., 2000; Kim et al., 2002), P and phytic P were positively correlated (r = 11
0.60, P<0.05) (Table 3). However, the low value of r hampers a reliable prediction of phytate 12
P from total P. In the current study, 77% of P was, on average, of phytic origin. This is quite 13
a high proportion compared with the 67 and 61% reported by Eeckhout and De Paepe (1994) 14
and Skiba et al. (2004), which may be a consequence of the lower total P observed in the 15
current study. P and phytic P concentrations in wheat are influenced by crop management, 16
especially N and P fertilisation (Barrier-Guillot et al., 1996a; Oury et al., 1998). 17
Consequently, the current results may have been influenced by the conditions under which 18
triticale was grown. 19
Phytase activity measured in the 30 batches of triticale ranged between 447 and 1843 20
PU/kg, with a mean value of 1018 ± 319 PU/kg. As expected, these values are intermediate 21
between the phytase activities reported in wheat and in rye (460 and 5350 PU/kg, according to 22
INRA-AFZ, 2004), although they are closer to those of wheat. These values are below the 23
1688 ± 227 and 1784 ± 386 PU/kg published by Eeckhout and De Paepe (1994) and Skiba et 24
al. (2004), respectively, but compare with the 1190 ± 52 PU/kg measured by Nys et al. (1996)
25
Table 3 near here 3 4 5 6 7 8 9 10 11 12 13 14 15 16 17 18 19 20 21 22 23 24 25 26 27 28 29 30 31 32 33 34 35 36 37 38 39 40 41 42 43 44 45 46 47 48 49 50 51 52 53 54 55 56 57 58 59 60
For Peer Review Only
in 5 batches of triticale. These differences may originate from the huge inter-laboratory 1
variability in phytase activity determination mentioned by Tran and Skiba (2005), even when 2
similar analytical methodologies are implemented. Phytase activity determination might be 3
sensitive to the condition under which batches are stored prior to analysis (temperature, 4
duration of storage if the gain is ground) (Nys et al., 1996) and to the way phytase is extracted 5
before analysis of the liberated inorganic phosphates (Greiner and Egli, 2003). 6
Phytase activity measured in each of the 5 varieties of triticale grown on 4 to 6 plots 7
(Table 4) was 20 to 48% higher than the value previously obtained on the single batch of the 8
same variety (Table 1). Nevertheless, the varieties were similarly ranked in the two sets of 9
data, with a coefficient of correlation of 0.95 (P<0.05, n = 5). The origin of this systematic 10
difference is not clear but it may be ascribable to the interaction between the grinding of the 11
samples before analysis and the duration of their storage (Nys et al., 1996). Phytase activity 12
differed (P<0.01) between varieties. In Calao, Capitale, Aubrac and Trimaran, it exceeded by 13
112, 79, 41 and 30%, respectively, the value of 1012 PU/ kg in DI34-2. This genotypic effect 14
on phytase activity was previously reported in wheat (Barrier-Guillot et al., 1996a; Kim et al., 15
2002; Oury et al., 1998; Tran and Skiba, 2005). However, Oury et al. (1998) detected a strong 16
genotype x environment interaction in the phytase activity of wheat. This interaction, which 17
may also exist in triticale, was not investigated in the current study. Phytase activity was 18
negatively correlated (P<0.05) with SW and HFN, which is consistent with the fact that low 19
HFN (and possibly SW) might be linked with the stimulation of enzymatic activity in the 20
grain at germination as observed for amylase (Niziolek et al., 1994). As previously reported in 21
wheat (Eeckhout et de Paepe, 1994; Barrier-Guillot et al., 1996a) no relationship between 22
phytase activity and P or phytic P could be detected. In contrast, Viveros et al. (2000) found a 23
positive correlation between phytase activity and P in wheat; however, they were not able to 24
predict phytate P or phytase activity reliably from total P.
25 Table 4 near here
3 4 5 6 7 8 9 10 11 12 13 14 15 16 17 18 19 20 21 22 23 24 25 26 27 28 29 30 31 32 33 34 35 36 37 38 39 40 41 42 43 44 45 46 47 48 49 50 51 52 53 54 55 56 57 58 59 60
For Peer Review Only
PAV and RAV ranged between 2.35 and 4.65 ml/g and 1.71 and 2.86 ml/g, 1
respectively, with average values of 3.53 ± 0.66 and 2.15 ± 0.31 mL/g, respectively (Table 1). 2
The PAV values are in the range of those reported by Bouguennec et al. (2000) in triticale. 3
They are between those observed in rye (PAV = 28 mL/g, Carré et al., 1994) and wheat (PAV 4
= 2.9 mL/g, Oury et al., 1998; Carré et al., 2002), although they are closer to those of wheat. 5
As previously reported (Oury et al., 1998), PAV and RAV were positively correlated (r = 6
0.43, P<0.05) with each other but not with any other characteristic. 7
Nitrogen concentration in the 30 varieties of triticale ranged between 14.1 and 18.1 g 8
N/kg (Table 1), corresponding to a mean level of protein of 101 ± 8.8 g/kg with a range of 88 9
to 113 g/kg. This crude protein level is slightly lower than those observed in 8 Australian 10
cultivars (range 101-135 g/kg; Johnson and Eason, 1988) or that analysed by Vieira et al. 11
(1995) (129 g/kg) but is in agreement with levels observed by other authors: 72-110 g/kg 12
(Zacarias et al., 1982), 93 g/kg (Proodfoot and Hulan, 1988). 13
Triticale phosphorus availability in broilers 14
The microwave treatment applied to triticale was effective in reducing phytase activity, which 15
was reduced after treatment by 85-90%, down to 142, 156, 126, 127 PU/kg in DI34-2, 16
Trimaran, Aubrac and Calao, respectively. Phytase activity measured in diets exceeded the 17
value expected from measurements performed on the batches of triticale, especially at low 18
levels of phytase activity (Table 2). However, phytase activity measured in the batches of 19
triticale and in the diets were highly correlated (r = 0.99, P<0.001, n = 8). RAV in non-heated 20
triticale-based diets was 10 to 23% lower than in heated triticale-based diets, suggesting that 21
heat treatment reduced xylanase activity. However, it remained below 1.40 ml/g, even in 22
heated triticale-based diets. In the current study, heat treatment was considered to have no 23
effect on phytate concentration because phytates present in cereals are very stable to heating 24
(Reddy et al., 1989; Juanpere et al., 2004). 25 3 4 5 6 7 8 9 10 11 12 13 14 15 16 17 18 19 20 21 22 23 24 25 26 27 28 29 30 31 32 33 34 35 36 37 38 39 40 41 42 43 44 45 46 47 48 49 50 51 52 53 54 55 56 57 58 59 60
For Peer Review Only
Performance and bone characteristics of birds are presented in Table 5. Five birds fed 1
the maize based diet without MCP (diet 1) died before the end of the experiment, explaining 2
the removal of data from three cages. A high mortality level has previously been observed in 3
chicks fed on maize based diets without supplemented mineral P (Kornegay et al., 1996; Paik, 4
2003). 5
For all the variables studied, significant differences (P<0.001) among diets were 6
detected. Chicks given the maize-based diets without phosphate and supplemented with 2 g P 7
as MCP displayed the lowest performance and the highest bone characteristics. The linear 8
response of bone ash to graded level of inorganic phosphorus demonstrates that the chicks fed 9
on negative control diet were deficient in phosphorus. Performance and bone characteristics in 10
chickens given the raw triticale-based diets did not differ (P>0.05) from those of chickens 11
given the maize-based diet supplemented with 1 g P as MCP/kg, except for bone ash 12
concentration in the Trimaran-based diet, which was lower. Overall, bone characteristics and 13
final weight of chickens given the heated triticale-based diets were intermediate between 14
those of chickens given the unsupplemented maize-based diet and the raw triticale-based 15
diets. Except for the heated DI-34-2-based diet, feed intake in chicks given the heated 16
triticale-based diets did not differ from that in chicks fed the unsupplemented maize-based 17
diet, while their FCR did not differ from that in chicks fed the raw triticale-based diets. 18
Chickens given the maize-based diet supplemented with 2 g P as MCP/kg ingested 2.1 times 19
more feed than chickens given the maize-based diet without MCP. Feed intake increased 20
linearly (P<0.001) and quadratically (P<0.05 and P<0.001, respectively) with supplemental P 21
supply and with the dietary level of phytase. By the end of the experiment, birds fed on the 22
maize-based diet supplemented with 2 g P as MCP/kg were 2.2 times heavier than birds given 23
the maize-based diet without added P. Final weight increased linearly (P<0.001) and 24
quadratically (P<0.01 and P<0.001, respectively) with P addition and with dietary phytase 25
Table 5 near here 3 4 5 6 7 8 9 10 11 12 13 14 15 16 17 18 19 20 21 22 23 24 25 26 27 28 29 30 31 32 33 34 35 36 37 38 39 40 41 42 43 44 45 46 47 48 49 50 51 52 53 54 55 56 57 58 59 60
For Peer Review Only
activity (Figure). FCR decreased linearly and quadratically with added P (P<0.01 and 1
P<0.05, respectively) and dietary phytase activity (P<0.001 and P<0.01, respectively). FCR
2
was decreased by 30% by supplementing the maize-based diet with 1 g P as MCP, but no 3
further improvement was achieved with 2 g P as MCP. Chickens given the heated triticale-4
based diets, still containing some phytase (135 to 200 PU), displayed a FCR 25% lower than 5
chicks on the unsupplemented maize-based diet with no further improvement with raw 6
triticale-based diets. 7
Improvements in weight gain, feed intake, and FCR with increased available P 8
provision through P or phytase supplementation of low P diets have been previously reported 9
(Broz et al., 1994; Kornegay et al., 1996; Sebastian et al., 1996a and b; Paik, 2003). From a 10
literature review including 298 observations from 18 literature references, Lescoat et al. 11
(2005) established an exponential relationship between body weight gain of chickens 12
slaughtered at 21 to 24 d and P intake. The two-fold increase in final weight with the addition 13
of 2 g P as MCP in the maize-based diet fits well with the relationship established by these 14
authors. Increased weight gain with supplemental P may have resulted not only from an 15
increase in feed intake but also from a specific effect of P on growth. A specific effect of P is 16
expected in the chick because of the important role of this element in the formation of the 17
skeletal system and in body metabolism (e.g. nucleic acids, high-energy compounds and 18
various enzymatic reactions), and because of the fast rate of chick growth and its low capacity 19
of P storage (Kornegay et al., 1996). 20
Bone FF DM followed a trend very similar to final weight (r = 0.90, P<0.001, n = 90) 21
with an increase in bone FF DM by 2.9 times when 2 g of P were added to the maize based 22
diet. Bone FF DM responded linearly to P added (P<0.001) and linearly (P<0.001) and 23
quadratically (P<0.01) to phytase activity. The amplitude of the response of bone ash (g) was 24
a 5.1-fold increase when 2 g of P were added to the maize based diet. Bone ash (g and relative 25 3 4 5 6 7 8 9 10 11 12 13 14 15 16 17 18 19 20 21 22 23 24 25 26 27 28 29 30 31 32 33 34 35 36 37 38 39 40 41 42 43 44 45 46 47 48 49 50 51 52 53 54 55 56 57 58 59 60
For Peer Review Only
to FF DM) increased linearly with added P and with phytase activity (P<0.001) and 1
quadratically with phytase activity (P<0.001). The linearity and the higher amplitude of the 2
response of bone ash to dietary P compared to body weight gain indicates the ability of bone 3
to incorporate P beyond the dietary supply needed to maximize weight gain (Figure). Relying 4
on 316 observations collected in 15 literature references, Lescoat et al. (2005) established that 5
bone ash concentration in chickens reached a plateau when 250-300 mg total P were ingested 6
per d, a value that is higher than the 220 mg total P daily ingested by the chickens fed on the 7
maize diet supplemented with 2 g P as MCP. Moreover, the increase in bone ash 8
concentration fits well with the range of variation observed by these authors for similar 9
dietary P supply. The improvement in bone ash in chickens fed on triticale diets indicates that 10
plant phytase was effective in releasing P from the phytate-mineral complex. The maximum 11
responses appeared to occur at around 600 PU plant phytase/kg diet whatever the indicator. 12
Before equivalency values of plant phytase for P as MCP can be estimated, the 13
question arises whether responses of performance and bone characteristics observed in the 14
current study can be ascribed solely to the improvement in available P supply by means of P 15
as MCP in maize-based diets and by means of increased phytase activity in triticale-based 16
diets. In the control diet, maize was preferred to a mixture of heated triticale batches to avoid 17
any side effect due to heating other than lowering phytase activity and because maize is the 18
reference cereal used when evaluating any source of phosphorus in the literature. The results 19
of the current study cannot be used to compare the relative efficiency of maize and triticale 20
for chick performance. Nevertheless, maize- and triticale-based diets provided sufficients 21
amounts of all nutrients to fulfill the requirement of growing chicks up to 3 weeks of age, 22
except for P (INRA, 1989). Particularly, because all diets were balanced for Ca, there is a 23
very high probability that the response of bone ash concentration was related to available P 24
supply rather than to any other dietary parameter. The magnitude of variation in performance 25 Figure near here 3 4 5 6 7 8 9 10 11 12 13 14 15 16 17 18 19 20 21 22 23 24 25 26 27 28 29 30 31 32 33 34 35 36 37 38 39 40 41 42 43 44 45 46 47 48 49 50 51 52 53 54 55 56 57 58 59 60
For Peer Review Only
in the current study is very large compared with the slight decrease in performance reported 1
when maize is replaced by wheat (Singh et al., 2003) or by triticale (Proudfoot and Hulan, 2
1988) in isocaloric, isonitrogenous, iso-Ca and iso-P diets fed to chickens. The former authors 3
ascribe this depressed performance to the presence of arabinoxylans in wheat. In the current 4
study, RAV in triticale-based diets was not greater than 1.40 ml/g, and, according to 5
Maisonnier et al. (2001), such concentrations of RAV do not influence performance in 6
chicks. 7
Non-linear models of the response of feed intake, final weight and bone characteristics 8
to dietary mineral P and plant phytase activity as well as the derived equivalency values of P 9
as MCP for plant phytase are presented in Table 6. Models were adjusted with a coefficient of 10
determination of 0.77 to 0.89. All the indicators used were sensitive to plant phytase or MCP 11
supply, but the fit was better for bone ash than for the other parameters. Moreover, the actual 12
weight of bone ash displayed the highest R² for both the non-linear and polynomial 13
adjustments. Other authors have concluded that bone ash weight is the most sensitive 14
indicator to assess phytase efficacy in chickens (Zhang et al., 2000; Hall et al., 2003). 15
Random variability in the organic matrix left after water and lipid removal may be responsible 16
for the decreased R² value for ash expressed on a fat-free dry matter basis (Hall et al., 2003). 17
Based on bone ash parameters, increase in plant phytase activity from 0 to 250 PU was 18
estimated to be equivalent to 0.46-0.47 g P as MCP. Between 250 and 500 PU, 250 PU were 19
estimated to allow the release of an amount of P equivalent to 0.20-0.22 g of P as MCP. 20
Between 500 and 1000 PU, an equivalency of 0.12-0.15 g P as MCP for 500 PU was 21
obtained. 22
The equivalency values are not easy to compare with literature data because the 23
efficacy of phytase has been shown to depend on several parameters including the dietary 24
non-phytic P and Ca concentrations. These equivalency values may be relatively high because 25
Table 6 near here 3 4 5 6 7 8 9 10 11 12 13 14 15 16 17 18 19 20 21 22 23 24 25 26 27 28 29 30 31 32 33 34 35 36 37 38 39 40 41 42 43 44 45 46 47 48 49 50 51 52 53 54 55 56 57 58 59 60
For Peer Review Only
the triticale-based diets were not supplemented with P. Kornegay et al. (1996) demonstrated 1
that, probably because of an available P supply closer to the requirement, the equivalency 2
values decrease when the dietary non-phytate P concentration increases. On the contrary, the 3
wide Ca:P ratio in the current study, greater than 2.8:1, may have reduced the efficacy of 4
phytase in releasing phytate P. Increasing the Ca:P ratio in poultry diets was reported to 5
decrease the efficacy of microbial phytase (Schoner et al., 1993; Qian et al., 1996; Sebastian 6
et al., 1996b), with the optimum responses to phytase obtained at a Ca:P ratio as low as 1.1:1.
7
In accordance with our results, Paik (2003) observed that 650 PU of plant phytase 8
achieved by the addition of wheat and wheat bran in a maize-soybean meal-based diet were 9
equivalent to at least 1 g P as tricalcium phosphate in terms of growth performance and 10
mineral retention in chickens up to 35 d. Similarly, an equivalency of 0.65-1 g P as MCP for 11
500 PU was reported by Frapin (1996) when evaluating plant phytase efficiency from various 12
wheat varieties. At variance with our results, Juanpere et al. (2004) did not observe any effect 13
of around 150 units of phytase from barley on performance and toe ash concentration in 14
chicks. This absence of efficacy of plant phytase may be ascribable to a higher non-phytate P 15
concentration than in the current study. From literature data, Kornegay et al. (2001) estimated 16
that 500 PU of microbial phytase (3-phytase) were equivalent to 0.8 g P as MCP for 500 PU 17
in terms of mineral retention in broilers. This higher figure may originate from the lower 18
efficacy of plant phytase compared to microbial 3-phytase demonstrated in broilers (Frapin, 19
1996; Potkansky, 2000) and in pigs (Zimmermann et al., 2002). The activity of plant phytase 20
decreases rapidly when the pH decreases below the optimum pH of 5.0-5.5, whereas the 3-21
phytase still displays an activity of 60% of the optimum at pH 2 (Eeckhout and De Paepe, 22
1996). Plant phytase would be 40 to 80% less efficient in releasing P from phytates in vivo 23
than 3-phytase due to the low pH in the stomach of pigs and gizzard of poultry (Frapin, 1996; 24
Potkansky, 2000; Zimmermann et al., 2002). The acidic pH of the gizzard inactivates plant
25 3 4 5 6 7 8 9 10 11 12 13 14 15 16 17 18 19 20 21 22 23 24 25 26 27 28 29 30 31 32 33 34 35 36 37 38 39 40 41 42 43 44 45 46 47 48 49 50 51 52 53 54 55 56 57 58 59 60
For Peer Review Only
phytase in contrast to protected microbial phytase and consequently plant phytase activity is 1
limited to the crop (Frapin, 1996). Moreover, plant phytase may be more sensitive to the 2
presence of pepsin than 3-phytase (Rapp et al., 2001). 3
The present study confirmed the usefulness of the introduction of triticale in chickens’ 4
diets to reduce P emission and to limit environmental pollution, 500 PU of plant phytase 5
being equivalent to 0.66-0.69 g P as MCP. Accounting for the genotypic variability of phytase 6
activity in triticale (447 to 1843 PU/kg), a diet containing 450 g/kg triticale may display a 7
phytase activity of 201 to 829 PU/kg, provided plant phytase is not denaturated during feed 8
processing. In such a diet, P supplementation as MCP may be reduced by 0.4 to 0.8 g/kg, 9
compared to a low phytase diet, such as a maize-based diet. 10
REFERENCES 11
BARRIER-GUILLOT, B., CASADO, P., MAUPETIT, P., JONDREVILLE, C. & GATEL, F. 12
(1996a) Wheat phosphorus availability: 1 - In vitro study; factors affecting endogenous 13
phytasic activity and phytic phosphorus content Journal of the Science of Food and 14
Agriculture, 70: 62-68.
15
BARRIER-GUILLOT, B., CASADO, P., MAUPETIT, P., JONDREVILLE, C. & GATEL, F. 16
(1996b) Wheat P availability: 2 - In vivo study in broilers and pigs; relationship with 17
endogenous phytasic activity and phytic phosphorus content in wheat. Journal of the 18
Science of Food and Agriculture, 70: 69-74.
19
BOUGUENNEC, A., OURY, F.X. & JESTIN, L. (2000) Viscosity related to arabinoxylans in 20
triticale: genetic and environmental variation in France. Vorträge für Pflanzenzüchtung, 21
49: 161-169. 22
BROZ, J., OLDALE, P., PERRINVOLTZ, A. H., RYCHEN, G., SCHULZE, J. & SIMOES 23
NUNES, C. (1994) Effects of supplemental phytase on performance and phosphorus 24 3 4 5 6 7 8 9 10 11 12 13 14 15 16 17 18 19 20 21 22 23 24 25 26 27 28 29 30 31 32 33 34 35 36 37 38 39 40 41 42 43 44 45 46 47 48 49 50 51 52 53 54 55 56 57 58 59 60
For Peer Review Only
utilisation in broiler chickens fed a low phosphorus diet without addition of inorganic 1
phosphates. British Poultry Science, 35: 273-280. 2
CARRÉ, B. (2002) Carbohydrate chemistry of the feedstuffs used for poultry, in: McNAB, B. 3
& BOORMAN, N. (Eds) Poultry feedstuffs: supply, composition and nutritive value, pp 4
39-56 (Wallingford, UK, CAB International Publishing). 5
CARRE, B., GOMEZ, J., MELCION, J.P. & GIBOULOT, B. (1994) La viscosité des 6
aliments destinés à l’aviculture. Utilisation pour prédire la consommation et l’excrétion 7
d’eau. INRA Productions Animales, 7: 369-379. 8
CARRÉ, B., IDI, A., MAISONNIER, S., MELCION, J. P., OURY, F. X., GOMEZ, J. & 9
PLUCHARD, P. (2002) Relationships between digestibilities of food components and 10
characteristics of wheat (Triticum aestivum) introduced as the only cereal source in a 11
broiler chicken diet. British Poultry Science 43: 404-415. 12
EECKHOUT, W. & DE PAEPE, M. (1994) Total phosphorus, phytate-phosphorus and 13
phytase activity in plant feedstuffs. Animal Feed Science and Technology, 47: 19-29. 14
EECKHOUT, W. & DE PAEPE, M. (1996) In vitro and in vivo comparison of microbial and 15
plant phytase, in: COELHO, M.B. & KORNEGAY, E.T. (Eds) Phytase in Animal 16
Nutrition and Waste Management, pp 237-240 (Mount Olive, NJ, BASF corporation).
17
ENGELEN, A.J., VAN DER HEEFT, F.C., RANDSDORP, P.H.G. & SMIT, E.L.C. (1994) 18
Simple and rapid determination of phytase activity. Journal of AOAC International, 77: 19
760-764. 20
FRAPIN, D. (1996) Valorisation du phosphore phytique végetal chez l’oiseau : intérêt et 21
mode d’action des phytases végétales et microbiennes. Thèse de l’école nationale 22
supérieure agronomique de Rennes, 134 p.
23 3 4 5 6 7 8 9 10 11 12 13 14 15 16 17 18 19 20 21 22 23 24 25 26 27 28 29 30 31 32 33 34 35 36 37 38 39 40 41 42 43 44 45 46 47 48 49 50 51 52 53 54 55 56 57 58 59 60
For Peer Review Only
GATEL, F., LAVOREL, O., FEKETE, J., GROSJEAN, F. & CASTAING, J. (1985) Feeding 1
value of triticale for monogastrics: weaned piglets, growing finishing pigs and broilers, in: 2
BERNARD, M. & BERNARD, S. (Eds) Genetics and Breeding of Triticale, pp 659-670 3
(Paris, France, INRA). 4
GREINER, R. & EGLI, I. (2003) Determination of the activity of acidic phytase-degrading 5
enzymes in cereal seeds. Journal of Agricultural and Food Chemistry, 51: 847-850. 6
HALL, L. E., SHIRLEY, R. B., BAKALLI, R. I., AGGREY, S. E., PESTI, G. M. & 7
EDWARDS, H. M. (2003) Power of two methods for the estimation of bone ash of 8
broilers. Poultry Science, 82:414-418. 9
INRA (1989) L’Alimentation des Animaux Monogastriques: Porc, Lapin, Volailles (Paris, 10
France, Institut National de la Recherche Agronomique). 11
INRA-AFZ (2004) Tables of composition and nutritional value of feed materials, in: 12
SAUVANT, D., PEREZ, J.M. & TRAN, G. (Eds) 304 pp (Paris, France, Institut National de 13
la Recherche Agronomique, Association Française de Zootechnie). 14
JOHNSON, R. & EASON, P. (1988) Evaluation of triticale for use in diets for meat-type 15
chickens. Journal of the Science of Food and Agriculture, 42: 95-108. 16
JUANPERE, J., PEREZ-VENDRELL, A. M. & BRUFAU, J. (2004) Effect of microbial 17
phytase on broilers fed barley-based diets in the presence or not of endogenous phytase. 18
Animal Feed Science and Technology, 115: 265-279. 19
KIM, J. C., MULLAN, B. P., SELLE, P. H. & PLUSKE, J. R. (2002) Levels of total 20
phosphorus, phytate-phosphorus, and phytase activity in three varieties of Western 21
Australian wheats in response to growing region, growing season, and storage. Australian 22
Journal of Agricultural Research, 53: 1361-1366.
23 3 4 5 6 7 8 9 10 11 12 13 14 15 16 17 18 19 20 21 22 23 24 25 26 27 28 29 30 31 32 33 34 35 36 37 38 39 40 41 42 43 44 45 46 47 48 49 50 51 52 53 54 55 56 57 58 59 60
For Peer Review Only
KORNEGAY, E. T. (2001) Digestion of phosphorus and other nutrients: the role of phytases 1
and factors influencing their activity, in : Bedford, M. R. & Partridge, G. G. (Eds) 2
Enzymes in Farm Animal Nutrition, pp 237-271 (Wallingford, CAB International).
3
KORNEGAY, E. T., DENBOW, D., Yi, Z. & RAVINDRAN, V. (1996) Response of broilers 4
to graded levels of microbial phytase added to maize-soyabean-meal-based diets 5
containing three levels of non-phytate phosphorus. British Journal of Nutrition, 75:839-6
852. 7
KORVER, D.R., ZUIDHOF, M.J. & LAWES, K.R. (2004) Performance characteristics and 8
economic comparison of broiler chickens fed wheat- and triticale-based diets. Poultry 9
Science 83: 716-725.
10
LEHRFELD, J. (1989) High performance liquid chromatography analysis of phytic acid on a 11
pH-stable, macroporous polymer column. Cereal Chemistry, 66: 510-515. 12
LESCOAT, P., TRAVEL, A. & NYS, Y. (2005) Lois de réponse des volailles de chair à 13
l’apport de phosphore. INRA Productions Animales, 18: 193-201. 14
MAISONNIER, S., GOMEZ, J., CARRE, B. (2001) Nutrient digestibility and intestinal 15
viscosities in broiler chickens fed on wheat diets, as compared to maize diets with added 16
guar gum. British Poultry Science, 42: 102-110. 17
NIZIOLEK, S., BARTOSZEWICZ, K. & KACZKOWSKI, J. (1994) Some hydrolases and 18
their substrates occurring in initial period of germination in triticale grains of various pre-19
harvest sprouting resistance. Acta Physiologiae Plantarum, 16: 171-176. 20
NYS, Y., FRAPIN, D. & POINTILLART, A. (1996) Occurrence of phytase in plants, animals 21
and microorganisms, in: COELHO, M.B. & KORNEGAY, E.T. (Eds) Phytase in Animal 22
Nutrition and Waste Management, pp 213-236 (Mount Olive, NJ, BASF corporation).
23 3 4 5 6 7 8 9 10 11 12 13 14 15 16 17 18 19 20 21 22 23 24 25 26 27 28 29 30 31 32 33 34 35 36 37 38 39 40 41 42 43 44 45 46 47 48 49 50 51 52 53 54 55 56 57 58 59 60
For Peer Review Only
OURY, F.X., CARRE, B., PLUCHARD, P., BERARD, P., NYS, Y. & LECLERCQ, B. 1
(1998) Genetic variability and stability of poultry feeding related characters in wheat, in 2
relation to environmental variation. Agronomie, 18: 139-150. 3
PAIK, I. (2003) Application of phytase, microbial or plant origin, to reduce P excretion in 4
poultry production. Asian-Australasian Journal of Animal Sciences, 16:124-135. 5
POTKANSKY, A. (2000) The comparison of plant and microbial phytases in the feeding, in: 6
Grela (Ed) Proceedings of the International Symposium on Phytase in Animal Nutrition, 7
pp 21-27 (Lublin). 8
PROUDFOOT, F.G. & HULAN, H.W. (1988) Nutritive value of triticale as a feed ingredient 9
for broiler chickens. Poultry Science, 67: 1743-1749. 10
QIAN, H., KORNEGAY, E. T. & DENBOW, D. M. (1996) Phosphorus equivalence of 11
microbial phytase in turkey diets as influenced by calcium to phosphorus ratios and 12
phosphorus levels. Poultry Science, 75: 69-81. 13
RAPP, C., LANTZSCH, H. J. & DROCHNER, W. (2001) Hydrolysis of phytic acid by 14
intrinsic plant or supplemented microbial phytase (Aspergillus niger) in the stomach and 15
small intestine of minipigs fitted with re-entrant cannulas. 2. Phytase activity. Journal of 16
Animal Physiology and Animal Nutrition, 85: 414-419.
17
REDDY, N.K., PIERSON, M.D., SATHE, S.K. & SALUNKHE, D.K., 1989. Phytates in 18
Cereals and Legumes. CRC Press, Boca Raton. 19
SANDBERG, A.S. & ADHERINNE, R. (1986) HPLC method for determination of inositol 20
tri, tetra, penta and hexaphosphates in foods and intestinal contents. Journal of Food 21
Science, 51: 547-550.
22
SAS, 1990. Statistical Analysis Systems software package version 8.1. Statistical Analysis 23
Systems Institute, Inc., Cary, NC, USA. 24 3 4 5 6 7 8 9 10 11 12 13 14 15 16 17 18 19 20 21 22 23 24 25 26 27 28 29 30 31 32 33 34 35 36 37 38 39 40 41 42 43 44 45 46 47 48 49 50 51 52 53 54 55 56 57 58 59 60
For Peer Review Only
SCHONER, F. J., HOPPE, P. P., SCHWARZ, G. & WIESCHE, H. (1993) Comparison of 1
microbial phytase and inorganic-phosphate in male chickens - the influence on 2
performance and mineral retention at various calcium levels. Journal of Animal 3
Physiology and Animal Nutrition, 69: 235-244.
4
SEBASTIAN, S., TOUCHBURN, S., CHAVEZ, E. R. & LAGUE, P. C. (1996a) The effects 5
of supplemental microbial phytase on the performance and utilization of dietary calcium, 6
phosphorus, copper, and zinc in broiler chickens fed corn-soybean diets. Poultry Science, 7
75: 729-736. 8
SEBASTIAN, S., TOUCHBURN, S., CHAVEZ, E. R. & LAGUE, P. C. (1996b) Efficacy of 9
supplemental microbial phytase at different dietary calcium levels on growth performance 10
and mineral utilization of broiler chickens. Poultry Science, 75: 1516-1523. 11
SINGH, P. K., KHATTA, V. K., THAKUR, R. S., DEY, S. & SANGWAN, M. L. (2003) 12
Effect of phytase supplementation on the performance of broiler chickens fed maize and 13
wheat based diets with different levels of non-phytate phosphorus. Asian-Australasian 14
Journal of Animal Sciences, 16: 1642-1649.
15
SKIBA, F., CALLU, P., CASTAING, J., PABOEUF, F., CHAUVEL, J. & JONDREVILLE, 16
C. (2004) Variabilité intra-matière première de la digestibilité du phosphore des céréales 17
et du pois chez le porc en croissance. Journées de la Recherche Porcine en France, 36: 9-18
10. 19
TRAN, G. & SKIBA, F. (2005) Variabilité inter et intra matière première de la teneur en 20
phosphore total et phytique de l’activité phytasique. INRA Productions Animales, 18: 159-21 168. 22 3 4 5 6 7 8 9 10 11 12 13 14 15 16 17 18 19 20 21 22 23 24 25 26 27 28 29 30 31 32 33 34 35 36 37 38 39 40 41 42 43 44 45 46 47 48 49 50 51 52 53 54 55 56 57 58 59 60
For Peer Review Only
VIVEROS, A., CENTENO, C., BRENES, A., CANALES, R. & LOZANO, A. (2000) 1
Phytase and acid phosphatase activities in plant feedstuffs. Journal of Agricultural and 2
Food Chemistry, 48: 4009-4013.
3
VIEIRA, S.L., PENZ, A.M., KESSLER, A.M. & CATELLAN, E.V., Jr (1995) A nutritional 4
evaluation of triticale in broiler diets. Journal of Applied Poultry Research, 4: 352-355. 5
ZACARIAS, I., YANEZ, E., ESCOBAR, M., HEWSTONE, C. & WULF, H. (1982) 6
Chemical and nutritional evaluation of triticale (Secale sp.) cultivated in Chili. Archivos 7
Latinoamericanos de Nutrition, 32: 713-724.
8
ZHANG, Z. B., KORNEGAY, E. T., RADCLIFFE, J. S., DENBOW, D. M., VEIT, H. P. & 9
LARSEN, C. T. (2000) Comparison of genetically engineered microbial and plant phytase 10
for young broilers. Poultry Science, 79: 709-717. 11
ZIMMERMANN, B., LANTZSCH, H. J., MOSENTHIN, R., BIESALSKI, H. K. & 12
DROCHNER, W. (2002) Comparative evaluation of the efficacy of cereal and microbial 13
phytases in growing pigs fed diets with marginal phosphorus supply. Journal of the 14
Science of Food and Agriculture, 82: 1298-1304.
15 3 4 5 6 7 8 9 10 11 12 13 14 15 16 17 18 19 20 21 22 23 24 25 26 27 28 29 30 31 32 33 34 35 36 37 38 39 40 41 42 43 44 45 46 47 48 49 50 51 52 53 54 55 56 57 58 59 60
For Peer Review Only
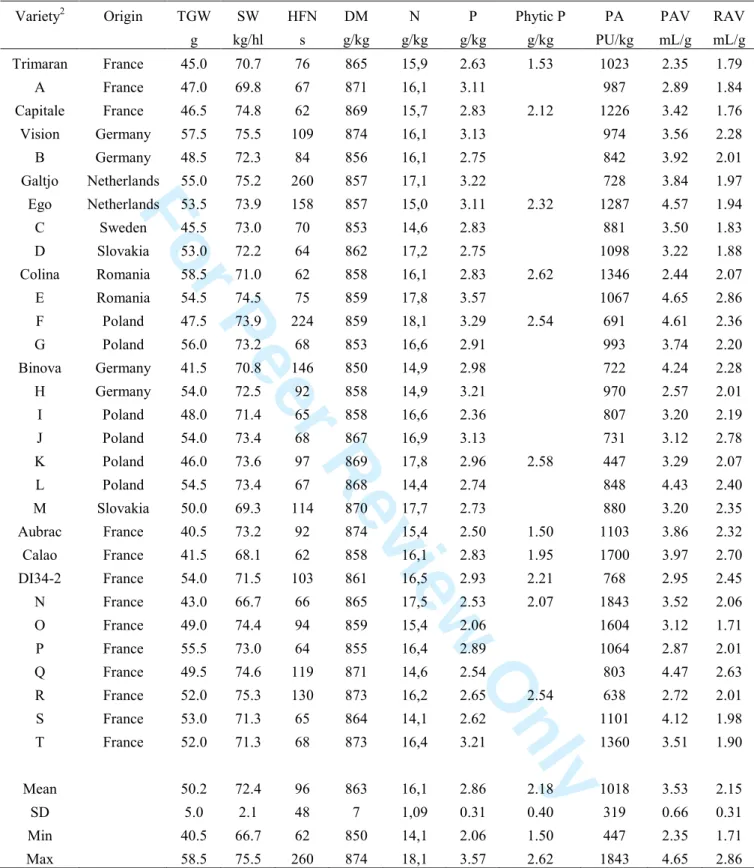
Table 1. Physical and chemical characteristics of 30 batches of triticale1 2
Variety2 Origin TGW SW HFN DM N P Phytic P PA PAV RAV g kg/hl s g/kg g/kg g/kg g/kg PU/kg mL/g mL/g Trimaran France 45.0 70.7 76 865 15,9 2.63 1.53 1023 2.35 1.79 A France 47.0 69.8 67 871 16,1 3.11 987 2.89 1.84 Capitale France 46.5 74.8 62 869 15,7 2.83 2.12 1226 3.42 1.76 Vision Germany 57.5 75.5 109 874 16,1 3.13 974 3.56 2.28 B Germany 48.5 72.3 84 856 16,1 2.75 842 3.92 2.01 Galtjo Netherlands 55.0 75.2 260 857 17,1 3.22 728 3.84 1.97 Ego Netherlands 53.5 73.9 158 857 15,0 3.11 2.32 1287 4.57 1.94 C Sweden 45.5 73.0 70 853 14,6 2.83 881 3.50 1.83 D Slovakia 53.0 72.2 64 862 17,2 2.75 1098 3.22 1.88 Colina Romania 58.5 71.0 62 858 16,1 2.83 2.62 1346 2.44 2.07 E Romania 54.5 74.5 75 859 17,8 3.57 1067 4.65 2.86 F Poland 47.5 73.9 224 859 18,1 3.29 2.54 691 4.61 2.36 G Poland 56.0 73.2 68 853 16,6 2.91 993 3.74 2.20 Binova Germany 41.5 70.8 146 850 14,9 2.98 722 4.24 2.28 H Germany 54.0 72.5 92 858 14,9 3.21 970 2.57 2.01 I Poland 48.0 71.4 65 858 16,6 2.36 807 3.20 2.19 J Poland 54.0 73.4 68 867 16,9 3.13 731 3.12 2.78 K Poland 46.0 73.6 97 869 17,8 2.96 2.58 447 3.29 2.07 L Poland 54.5 73.4 67 868 14,4 2.74 848 4.43 2.40 M Slovakia 50.0 69.3 114 870 17,7 2.73 880 3.20 2.35 Aubrac France 40.5 73.2 92 874 15,4 2.50 1.50 1103 3.86 2.32 Calao France 41.5 68.1 62 858 16,1 2.83 1.95 1700 3.97 2.70 DI34-2 France 54.0 71.5 103 861 16,5 2.93 2.21 768 2.95 2.45 N France 43.0 66.7 66 865 17,5 2.53 2.07 1843 3.52 2.06 O France 49.0 74.4 94 859 15,4 2.06 1604 3.12 1.71 P France 55.5 73.0 64 855 16,4 2.89 1064 2.87 2.01 Q France 49.5 74.6 119 871 14,6 2.54 803 4.47 2.63 R France 52.0 75.3 130 873 16,2 2.65 2.54 638 2.72 2.01 S France 53.0 71.3 65 864 14,1 2.62 1101 4.12 1.98 T France 52.0 71.3 68 873 16,4 3.21 1360 3.51 1.90 Mean 50.2 72.4 96 863 16,1 2.86 2.18 1018 3.53 2.15 SD 5.0 2.1 48 7 1,09 0.31 0.40 319 0.66 0.31 Min 40.5 66.7 62 850 14,1 2.06 1.50 447 2.35 1.71 Max 58.5 75.5 260 874 18,1 3.57 2.62 1843 4.65 2.86 1
TGW, thousand grain weight; SW, specific weight; HFN, Hagberg falling number; DM, dry matter; PA, phytase
3
activity; PAV, potential applied viscosity; RAV, real applied viscosity.
4
2
cultivars or selection lines.
5 3 4 5 6 7 8 9 10 11 12 13 14 15 16 17 18 19 20 21 22 23 24 25 26 27 28 29 30 31 32 33 34 35 36 37 38 39 40 41 42 43 44 45 46 47 48 49 50 51 52 53 54 55 56 57 58 59 60
For Peer Review Only
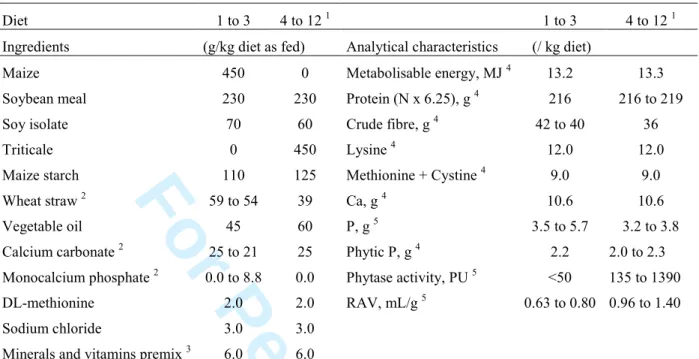
1Table 2. Composition and analytical characteristics of the experimental diets 2
Diet 1 to 3 4 to 12 1 1 to 3 4 to 12 1 Ingredients (g/kg diet as fed) Analytical characteristics (/ kg diet)
Maize 450 0 Metabolisable energy, MJ 4 13.2 13.3 Soybean meal 230 230 Protein (N x 6.25), g 4 216 216 to 219 Soy isolate 70 60 Crude fibre, g 4 42 to 40 36 Triticale 0 450 Lysine 4 12.0 12.0 Maize starch 110 125 Methionine + Cystine 4 9.0 9.0 Wheat straw 2 59 to 54 39 Ca, g 4 10.6 10.6 Vegetable oil 45 60 P, g 5 3.5 to 5.7 3.2 to 3.8 Calcium carbonate 2 25 to 21 25 Phytic P, g 4 2.2 2.0 to 2.3 Monocalcium phosphate 2 0.0 to 8.8 0.0 Phytase activity, PU 5 <50 135 to 1390 DL-methionine 2.0 2.0 RAV, mL/g 5 0.63 to 0.80 0.96 to 1.40 Sodium chloride 3.0 3.0
Minerals and vitamins premix 3 6.0 6.0
1
Without heat treatment, variety DI34-2, Trimaran, Aubrac and Calao in diets 4, 5, 6 and 7, respectively;
heat-3
treated, variety DI34-2, Trimaran, Aubrac and Calao in diets 8, 9, 10 and 11, respectively; variety Calao, 200 g/kg
4
without heat treatment and 250 g/kg heat-treated in diet 12. Heat treatment, which aimed at reducing phytase activity,
5
consisted in two successive heating in a microwave oven at 600 W for 2 minutes.
6
2
Wheat straw: 59, 56 and 54; calcium carbonate, 25, 23 and 21; monocalcium phosphate, 0.0, 4.4 and 8.8 g/kg in
7
diets 1, 2 and 3, respectively.
8
3
Vitamin-trace mineral mix that provided the following per kg diet: vitamin A (retinyl acetate), 10000 IU; vitamin
9
D3 (cholecalciferol), 4000 IU; vitamin E (DL-alpha-tocopherol), 80 mg; vitamin K3 (menadione), 4 mg; vitamin B1
10
(thiamin), 4 mg; vitamin B2 (riboflavin), 6.4 mg; vitamin B3 (PP, niacin), 80 mg; vitamin B5 (Ca pantothenate), 20
11
mg; vitamin B6 (pyridoxine), 5.6 mg; vitamin B8 (biotin, H), 0.2 mg; vitamin B9 (folic acid), 2.4 mg; vitamin B12
12
(cyanocobalamin), 0.016 mg; choline, 440 mg, Fe (FeSO4), 40 mg ; Cu (CuSO4), 16 mg; Mn (MnO), 64 mg; Zn
13
(ZnSO4), 72 mg; Co (CoSO4), 0.5 mg; I (Ca(IO3)2), 1.6 mg; Se (Na2SeO3), 0.16 mg.
14
4
Estimated from INRA (1989) and the analysed N and phytic P concentrations in the four varieties of triticale.
15
5 Analysed according to the methods described in the materials and methods section: P, 3.5, 4.5, 5.7, 3.8, 3.2, 3.6, 3.6,
16
3.7, 3.3, 3.3, 3.7 and 3.8 g/kg; phytase activity, < 50, < 50, < 50, 620, 875, 920, 1390, 180, 200, 180, 135 and 645
17
PU/kg; RAV, Real Applied Viscosity, 0.76, 0.63, 0.80, 1.04, 0.96, 1.08, 1.03, 1.16, 1.13, 1.40, 1.22 and 1.02 ml/g in
18
diets 1, 2, 3, 4, 5, 6, 7, 8, 9, 10, 11 and 12, respectively.
19 3 4 5 6 7 8 9 10 11 12 13 14 15 16 17 18 19 20 21 22 23 24 25 26 27 28 29 30 31 32 33 34 35 36 37 38 39 40 41 42 43 44 45 46 47 48 49 50 51 52 53 54 55 56 57 58 59 60
For Peer Review Only
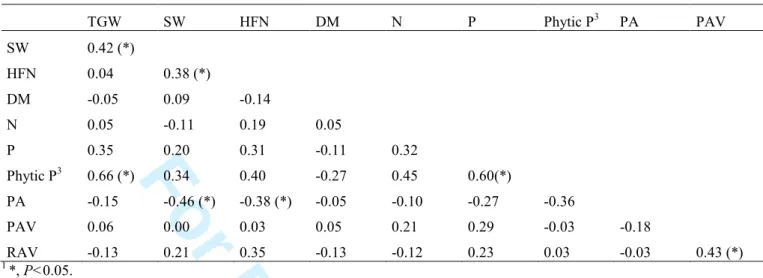
Table 3. Correlation coefficient (r) between physical and chemical characteristics of the 30 batches of
1 triticale 2 TGW SW HFN DM N P Phytic P3 PA PAV SW 0.42 (*) HFN 0.04 0.38 (*) DM -0.05 0.09 -0.14 N 0.05 -0.11 0.19 0.05 P 0.35 0.20 0.31 -0.11 0.32 Phytic P3 0.66 (*) 0.34 0.40 -0.27 0.45 0.60(*) PA -0.15 -0.46 (*) -0.38 (*) -0.05 -0.10 -0.27 -0.36 PAV 0.06 0.00 0.03 0.05 0.21 0.29 -0.03 -0.18 RAV -0.13 0.21 0.35 -0.13 -0.12 0.23 0.03 -0.03 0.43 (*) 1 *, P<0.05. 3 2
TGW, thousand grain weight; SW, specific weight; HFN, Hagberg falling number; DM, dry matter; PA, phytase
4
activity; PAV, potential applied viscosity; RAV, real applied viscosity.
5 3 n = 11. 6 3 4 5 6 7 8 9 10 11 12 13 14 15 16 17 18 19 20 21 22 23 24 25 26 27 28 29 30 31 32 33 34 35 36 37 38 39 40 41 42 43 44 45 46 47 48 49 50 51 52 53 54 55 56 57 58 59 60
For Peer Review Only
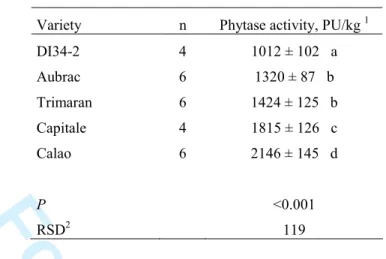
Table 4. Phytase activity in 5 varieties of triticale 1Variety n Phytase activity, PU/kg 1 DI34-2 4 1012 ± 102 a Aubrac 6 1320 ± 87 b Trimaran 6 1424 ± 125 b Capitale 4 1815 ± 126 c Calao 6 2146 ± 145 d P <0.001 RSD2 119 2 1
values are means ± standard deviation.
3
2
RSD, residual standard deviation.
4
a-d; Means within a column not followed by the same letter differ at P<0.05.
5 3 4 5 6 7 8 9 10 11 12 13 14 15 16 17 18 19 20 21 22 23 24 25 26 27 28 29 30 31 32 33 34 35 36 37 38 39 40 41 42 43 44 45 46 47 48 49 50 51 52 53 54 55 56 57 58 59 60
For Peer Review Only
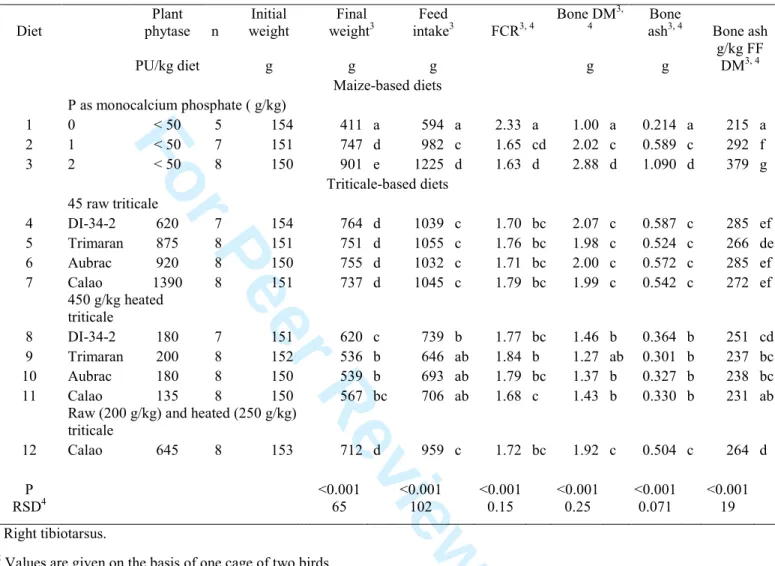
Table 5.Growth performance and bone characteristicsin chickens given the maize-based diets
1
supplemented with graded levels of P as monocalcium phosphate or the triticale-based diets containing
2
graded levels of phytase2
3 Diet Plant phytase n Initial weight Final weight3 Feed intake3 FCR3, 4 Bone DM3, 4 Bone
ash3, 4 Bone ash PU/kg diet g g g g g g/kg FF DM3, 4 Maize-based diets P as monocalcium phosphate ( g/kg) 1 0 < 50 5 154 411 a 594 a 2.33 a 1.00 a 0.214 a 215 a 2 1 < 50 7 151 747 d 982 c 1.65 cd 2.02 c 0.589 c 292 f 3 2 < 50 8 150 901 e 1225 d 1.63 d 2.88 d 1.090 d 379 g Triticale-based diets 45 raw triticale 4 DI-34-2 620 7 154 764 d 1039 c 1.70 bc 2.07 c 0.587 c 285 ef 5 Trimaran 875 8 151 751 d 1055 c 1.76 bc 1.98 c 0.524 c 266 de 6 Aubrac 920 8 150 755 d 1032 c 1.71 bc 2.00 c 0.572 c 285 ef 7 Calao 1390 8 151 737 d 1045 c 1.79 bc 1.99 c 0.542 c 272 ef 450 g/kg heated triticale 8 DI-34-2 180 7 151 620 c 739 b 1.77 bc 1.46 b 0.364 b 251 cd 9 Trimaran 200 8 152 536 b 646 ab 1.84 b 1.27 ab 0.301 b 237 bc 10 Aubrac 180 8 150 539 b 693 ab 1.79 bc 1.37 b 0.327 b 238 bc 11 Calao 135 8 150 567 bc 706 ab 1.68 c 1.43 b 0.330 b 231 ab
Raw (200 g/kg) and heated (250 g/kg) triticale 12 Calao 645 8 153 712 d 959 c 1.72 bc 1.92 c 0.504 c 264 d P <0.001 <0.001 <0.001 <0.001 <0.001 <0.001 RSD4 65 102 0.15 0.25 0.071 19 1 Right tibiotarsus. 4 2
Values are given on the basis of one cage of two birds.
5
3
Linear (L) and quadratic (Q) effects of P added as monocalcium phosphate (g/kg diet) and of phytase activity in the
6
diet (PU/kg diet):
7
Final weight: P added, L (P<0.001), Q (P<0.01); phytase activity, L (P<0.001), Q (P<0.001), RSD = 69, R² = 0.77.
8
Feed intake: P added, L (P<0.001), Q (P<0.05); phytase activity, L (P<0.001), Q (P<0.001), RSD = 104, R² = 0.78.
9
FCR: P added, L (P<0.01), Q (P<0.05); phytase activity, L (P<0.001), Q (P<0.01), RSD = 0.19, R² = 0.23.
10
Bone DM: P added, L (P<0.001); phytase activity, L (P<0.001), Q (P<0.001), RSD = 0.25, R² = 0.78.
11
Bone ash (g): P added, L (P<0.001); phytase activity, L (P<0.001), Q (P<0.001), RSD = 0.075, R² = 0.90.
12
Bone ash (g/kg FF DM): P added, L (P<0.001); phytase activity, L (P<0.001), Q (P<0.001), RSD = 20, R² = 0.81.
13
4
DM, dry matter; FF DM, fat-free dry matter; FCR, feed conversion ratio; RSD, residual standard deviation.
14
a-g; Means within a column not followed by a common letter differ at P<0.05.
15 3 4 5 6 7 8 9 10 11 12 13 14 15 16 17 18 19 20 21 22 23 24 25 26 27 28 29 30 31 32 33 34 35 36 37 38 39 40 41 42 43 44 45 46 47 48 49 50 51 52 53 54 55 56 57 58 59 60
For Peer Review Only
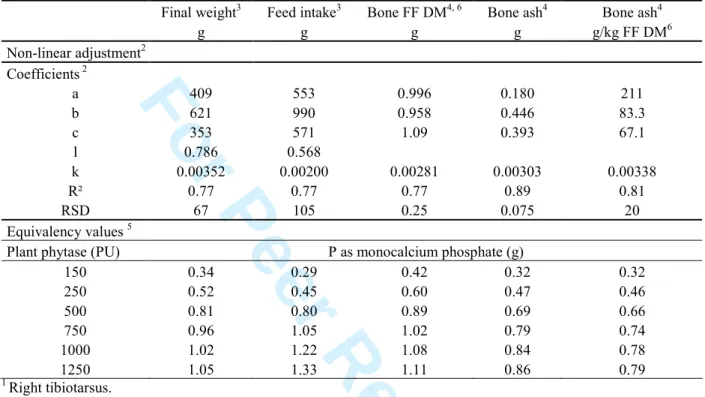
1Table 6. Adjustment of final weight, feed intake, bone1 dry matter and bone ash to P as monocalcium
2
phosphate (MCP, g/kg diet) and phytase activity (PU/kg diet) and equivalency values of P as MCP (g) for
3
plant phytase (PU)
4
Final weight3 Feed intake3 Bone FF DM4, 6 Bone ash4 Bone ash4
g g g g g/kg FF DM6 Non-linear adjustment2 Coefficients 2 a 409 553 0.996 0.180 211 b 621 990 0.958 0.446 83.3 c 353 571 1.09 0.393 67.1 l 0.786 0.568 k 0.00352 0.00200 0.00281 0.00303 0.00338 R² 0.77 0.77 0.77 0.89 0.81 RSD 67 105 0.25 0.075 20 Equivalency values 5
Plant phytase (PU) P as monocalcium phosphate (g)
150 0.34 0.29 0.42 0.32 0.32 250 0.52 0.45 0.60 0.47 0.46 500 0.81 0.80 0.89 0.69 0.66 750 0.96 1.05 1.02 0.79 0.74 1000 1.02 1.22 1.08 0.84 0.78 1250 1.05 1.33 1.11 0.86 0.79 1 Right tibiotarsus. 5 2
Models were generated using treatment means, R² (coefficient of determination) and RSD (residual standard
6
deviation) are calculated relative to individual observations.
7
3
The model was Y = a + b (1 - e - l MinP) + c (1 - e - k Phyt), with Y = response measurement, MinP = P added as MCP
8
(g/kg diet), Phyt = phytase activity (PU/kg diet).
9
4
The model was Y = a + b MinP + c (1 - e - k Phyt), with Y = response measurement, MinP = P added as MCP (g/ kg
10
diet), Phyt = phytase activity (PU/kg diet).
11
5
Final weight, feed intake, calculated as MinP = - 1/l ln [1 – A (1 - e - k Phyt)]; Bone dry matter and bone ash,
12
calculated as MinP = A (1 - e - k Phyt), with A = c/b, MinP = P as MCP (g), Phyt = phytase activity (PU)
13
6
FF DM, fat-free dry matter.
14 15 3 4 5 6 7 8 9 10 11 12 13 14 15 16 17 18 19 20 21 22 23 24 25 26 27 28 29 30 31 32 33 34 35 36 37 38 39 40 41 42 43 44 45 46 47 48 49 50 51 52 53 54 55 56 57 58 59 60
For Peer Review Only
1Figure. Response of final weight and bone1 ash to P as monocalcium phosphate in maize based diets and
2
to plant phytase in triticale based diets.
3 4 5 6 7 8 1 Right tibiotarsus. 9
Values are means ± S.E.
10
Parameters of the models are presented in Table 6.
11 Figure footnotes 3 4 5 6 7 8 9 10 11 12 13 14 15 16 17 18 19 20 21 22 23 24 25 26 27 28 29 30 31 32 33 34 35 36 37 38 39 40 41 42 43 44 45 46 47 48 49 50 51 52 53 54 55 56 57 58 59 60
For Peer Review Only
1 2 3 4 400 500 600 700 800 900 1000 0.0 0.5 1.0 1.5 2.0 2.5 Mineral P (g / kg diet) F in a l w e ig h t (g ) 0 250 500 750 1000 1250 1500 Plant phytase (PU / kg diet)Maize diets Triticale diets
5 0.00 0.20 0.40 0.60 0.80 1.00 1.20 0.0 0.5 1.0 1.5 2.0 2.5 Mineral P (g / kg diet) B o n e a s h ( g ) 0 250 500 750 1000 1250 1500 Plant phytase (PU / kg diet)
Maize diets Triticale diets
6 3 4 5 6 7 8 9 10 11 12 13 14 15 16 17 18 19 20 21 22 23 24 25 26 27 28 29 30 31 32 33 34 35 36 37 38 39 40 41 42 43 44 45 46 47 48 49 50 51 52 53 54 55 56 57 58 59 60