www.newphytologist.org 739
Research
Blackwell Publishing Ltd
Transcript profiling of a xylem vs phloem cDNA subtractive
library identifies new genes expressed during xylogenesis
in
Eucalyptus
Camille Foucart, Etienne Paux, Nathalie Ladouce, Hélène San-Clemente, Jacqueline Grima-Pettenati and Pierre Sivadon
UMR 5546 CNRS/Université Paul Sabatier Toulouse III, Pôle de Biotechnologies Végétales, 24 chemin de Borde Rouge, BP 42617 Auzeville Tolosane, 31326 Castanet Tolosan, France
Summary
• Eucalyptus is one of the world’s main sources of biomass. The genus includes species representing the principle hardwood trees used for pulp and paper. Here, we aimed to identify genes specifically expressed in differentiating secondary xylem compared with phloem.
• We constructed a xylem vs phloem subtractive library (Xp) that generated 263 unique sequences. By transcript profiling of xylem, phloem, vascular cambium and leaves using macroarrays, we classified the 263 unigenes into distinct tissue-specific groups. Reverse transcription–polymerase chain reaction (RT-PCR) confirmed the differential expression of representative expressed sequence tags (ESTs).
• A total of 87 unigenes were preferentially expressed in xylem. They were involved in functional categories known to play roles in xylogenesis, such as hormone signaling and metabolism, secondary cell wall thickening and proteolysis. Some of these genes, including unknown genes, may be considered xylem-specific and they are likely to control important functions in xylogenesis.
• These data shed light on the cellular functions of xylem cells and, importantly, provide us with a portfolio of Eucalyptus xylem genes that may be major players in the control of wood formation and quality.
Key words: cambium, cDNA arrays, Eucalyptus, phloem, suppression subtractive hybridization (SSH) library, xylem.
New Phytologist (2006) 170: 739–752
© New Phytologist (2006) No claim to French government works doi: 10.1111/j.1469-8137.2006.01705.x
Author for correspondence:
Jacqueline Grima-Pettenati Tel: +33 562193 513 Fax: +33 562193 502 Email: [email protected] Received: 6 October 2005 Accepted: 1 February 2006 Introduction
Plants first developed a vascular system some 400 million year ago. This was key to colonizing the land, because the vascular system enabled the long-distance transport of sap between the roots and the shoot organs and also provided stem rigidity, both of which are necessary to overcome the effects of gravity (Ye, 2002). In higher plants, the vascular system is composed
of two tissues containing distinct highly specialized cell types, the phloem, through which organic material is transported, and the xylem, which is dedicated to water and minerals. In species undergoing secondary growth, such as gymnosperms and angiosperm trees, a lateral meristematic tissue called the vascular cambium produces secondary phloem on the outside of the stem and secondary xylem (commonly known as wood) on the inside. The activity of this secondary meristem plays an important role in the thickening of plant axes, allowing the development of tree-like forms. Thus, it produces a major part of the biomass on Earth. It also ensures the perennial life of trees through the regular renewal of functional xylem and Numbers in square brackets after a gene name (e.g. ACC oxidase [17A02])
refer to the clone numbers in the Xp library; [–] means that the corresponding gene was previously isolated in our laboratory (e.g. EgCCR [–]).
New Phytologist (2006) 170: 739–752 www.newphytologist.org © New Phytologist (2006) No claim to French government works
Research
740
phloem. This is a unique example of continuous histogenesis from constitutively active stem cells.
The term ‘cambium’ in its strictest sense refers to one or several layers of cells called initials (Lachaud et al., 1999). Periclinal (tangential) divisions of these initials produce phloem or xylem mother cells that, in turn, can undergo several rounds of cell divi-sion before differentiating (Lachaud et al., 1999). Because cambial initials and mother cells are almost indistinguishable, they are collectively referred to as ‘the cambial zone’ (Larson, 1994). Although they are derived from the same cambial origin, xylem and phloem are distinct tissues made up of a variety of structurally and functionally different cell types. Molecular markers that differentiate between xylem and phloem mother cells would therefore be of great value (Schrader et al., 2004). The differentiation of mother cells into complex and highly specialized tissues involves unique developmental programs. For instance, the conducting elements in xylem are highly lignified hollow dead cells, whereas the phloem sieve elements are living enucleated cells connected by plasmodesmata (Oparka & Turgeon, 1999; Ye, 2002). The temporal and spatial dynamics of phloem and xylem differentiation must therefore involve extremely subtle and sophisticated coordination of cellular processes through the controlled expression of hundreds of genes. Comprehensive xylem, cambium and phloem transcript profiles would provide insights into the genetic mechanisms that control cambial activity and into the differ-entiation of secondary xylem and phloem.
Only two large-scale transcriptome studies with the aim of identifying genes important for phloem have been published to date (Vilaine et al., 2003; Zhao et al., 2005). By contrast, because of the high economic and environmental importance of wood, xylem differentiation has received more attention. Large-scale transcriptome analyses of isolated vascular tissues or cultured tracheary elements have been performed in model plants such as Zinnia elegans (Demura et al., 2002) and arabi-dopsis (Oh et al., 2003; Brown et al., 2005; Zhao et al., 2005) as well as in commercially important species including poplar (Sterky et al., 2004), pine (Allona et al., 1998; Whetten et al., 2001; Lorenz & Dean, 2002) and Eucalyptus (Paux et al., 2004, 2005). The use of microarray technology to carry out tran-scriptional profiling of thousands of genes in vascular tissues has lead to important advances towards a comprehensive approach to the functional genomics of vascular tissue differentiation and function. Notably, high-resolution transcript profiling of more than 13 000 genes across the cambial zone of aspen (Populus tremula) allowed Schrader et al. (2004) to identify potential regulators of cambial stem cell identity and to associate specific functional categories with the successive events of xylogenesis. The genus Eucalyptus includes the most widely used tree species for industrial plantation. These species are one of the world’s main sources of biomass and represent the principal hardwood trees used for making paper pulp. Although most Eucalyptus species have characteristics very similar to those of poplar species – a relatively small genome size (370 –700 Mbp),
diploid inheritance (n = 11), easy clonal propagation and fast growth – the lack of efficient genetic transformation methods has hampered Eucalyptus from becoming a popular model tree (Myburg et al., 2005). Nevertheless, because of the huge economic potential of Eucalyptus, a growing number of genetic tools (genetic and physical maps, and quantitative trait loci) are becoming available and, notably, the genome sequence of Eucalyptus camaldulensis is expected to be completed in 2007 (for reviews, see Myburg et al., 2005 and references therein). Because wood quality is a major trait that tree breeders would like to improve by using marker-assisted selection, there is a need to increase Eucalyptus genomic resources with candidate genes involved in the genetic control of wood properties. As a first step towards this goal, we recently showed that the combination of a ‘xylem vs leaves’ subtractive library with transcript profiling was an effective way to identify genes that are preferentially or specifically expressed in Eucalyptus xylem when compared with nonvascular tissues (leaf blades) (Paux et al., 2004). Here we gen-erated a ‘xylem vs phloem’ subtractive library (Xp) and followed the expression profiles of the resulting genes in the different vas-cular tissues, i.e. xylem, phloem and vasvas-cular cambium, as well as in leaves. The 263 unigenes of the Xp library were classified accord-ing to their transcript profiles into distinct tissue-specific groups. Among the 87 genes preferentially expressed in xylem as compared with phloem and cambium, some can be considered as xylem-specific and are likely to have important functions in xylogenesis.
Materials and Methods
Accession numbers
The sequences reported in this paper have been deposited in the dbESTs database of the National Center for Biotechnology Information (NCBI) (http://www.ncbi.nlm.nih.gov/dbEST/ index.html; accession numbers DR409896–DR410158). Accession numbers of the 32 candidate gene sequences in the macroarrays are included in Table S1, which is provided as supplementary data on the website of the journal.
Plant material and tissue harvesting
Vascular tissue samples and leaves were harvested in spring from 6-year-old field-grown Eucalyptus gunnii (McAulay & Brett) trees (clone 0867; AFOCEL, Longages, France). They were immediately frozen in liquid nitrogen and stored at −80°C. Leaf blades (L), without the central vein of young and mature leaves, were used to minimize the proportion of primary xylem. Vascular tissue samples were obtained from 5-cm-thick branches, as follows: differentiating secondary xylem (X) was scraped from the exposed xylogenic tissue after removal of the bark, as previ-ously described (Grima-Pettenati et al., 1993; Paux et al., 2004). Secondary phloem (P) was removed by scraping the bark from which the cork was removed. The vascular cambium sample (C) was obtained by smoothly scraping the inner side of the bark.
© New Phytologist (2006) No claim to French government works www.newphytologist.org New Phytologist (2006) 170: 739–752
Research 741
Total RNA extraction
Total RNA was extracted from 2 g of tissue as described previously (Southerton et al., 1998). Remaining traces of DNA were removed with RQ1 RNase-free DNase (Promega, Madison, WI, USA) according to the manufacturer’s procedure. For each tissue, two independent RNA extractions were performed. RNA purity and quality were checked by both agarose gel electrophoresis and spectrophotometry (Sambrook et al., 1989).
cDNA synthesis
Double-stranded cDNAs were obtained using the SMART PCR cDNA synthesis kit (Clontech Laboratories, Palo Alto, CA, USA) according to the manufacturer’s procedure, with the following minor modifications. One microgram of RNA was added to 1 µl of 10 µM SMART II primer and 1 µl of 10 µM
cDNA synthesis (CDS) primer in a final volume of 5 µl. After 2 min at 70°C, the reaction was initiated by addition of 1 µl of 0.1 M dithiothreitol (DTT), 1 µl of 10 mM dNTPs, 2 µl of 5×
First Strand Buffer and 1 µl of Superscript II reverse transcriptase (Invitrogen, Carlsbad, CA, USA). After 1 h of incubation at 42°C, the reaction was stopped by heating the mixture to 72°C for 7 min. Double-stranded cDNAs were synthesized from 5 µl of first-strand cDNA in 100-µl SMART PCR reactions. Construction of a cDNA xylem vs phloem subtractive library
The cDNA xylem vs phloem subtractive library (Xp library) was prepared using the suppression subtractive hybridization (SSH) technique (Diatchenko et al., 1996). SSH was performed between the xylem (tester) and the phloem (driver) using the PCR-Select cDNA Subtraction Kit (Clontech Laboratories) according to the manufacturer’s procedure. The subtracted PCR products generated by SSH were inserted into the pGEM-T easy vector (Promega) and cloned into Escherichia coli DH5α strain. Clones of recombinant bacteria were tested for α -complementation (Sambrook et al., 1989). A BioPick robot (Genomic Solutions, Huntingdon, UK) picked white colonies and arrayed them in 384-well plates containing Luria-Bertani (LB) freezing medium (25 g l−1 LB broth, 6.3 g l−1 K
2HPO4,
1.8 g l−1 KH
2PO4, 0.5 g l−1 sodium citrate, 1 g l−1 MgSO4,
0.9 g l−1 ammonium sulfate, and 4.4% glycerol) supplemented
with ampicillin (100 µg ml−1). All recombinant clones were
grown at 37°C overnight and then stored at −80°C. Production of cDNA arrays
A total of 295 clones were distributed into 96-well plates con-taining 100 µl of LB medium with 100 µg ml−1 ampicillin
using a BioGrid robot (Genomic Solutions), and bacteria were grown at 37°C overnight. Bacteria were then pelleted by centrifugation at 1500 r.p.m. for 5 min. The supernatant was
discarded and the pellets were resuspended in 100 µl of sterile water. This treatment was repeated once and the plates were stored at −20°C. PCR was performed on 10 µl of suspension (94°C for 6 min, 94°C for 30 s, 55°C for 30 s, and 72°C for 1 min, for 40 cycles, and 72°C for 10 min) using T7 and M13 reverse universal primers in a 100-µl reaction volume. The products of duplicate PCR reactions were pooled and concentrated in a speed vacuum. PCR products were resuspended in 10 µl of ultra-high purity water (UHQ) to a final concentration of 400–800 ng µl−1. Aliquots (0.1 µl) of
PCR products were transferred onto 7 × 11 cm Immobilon-Ny+ nylon membranes (Millipore, Billerica, MA, USA) using the BioGrid robot with a 96-pin tool. The Xp library clones, together with five controls, Eucalyptus globulus NADP-isocitrate dehydrogenase (EgIDH), E. globulus glyceraldehyde-3-phosphate dehydrogenase (EgG3PDH), E. globulus alphatubulin
(EgTUB1A), pGEMT-easy polylinker and Desmin, and 32
genes previously identified in the laboratory as genes putatively involved in xylogenesis (Table S1), were arrayed in duplicate on 6 × 6 spot grids. Membranes were denatured twice on Whatman 3MM paper saturated with denaturation buffer (0.5 M NaOH and 1.5 M NaCl) for 10 min, neutralized twice
on Whatman 3MM paper saturated with neutralization buffer (1 M Tris-HCl, pH 7.4, and 1.5 M NaCl) for 10 min,
rinsed in 2× saline sodium citrate (SSC), air-dried and finally cross-linked with 70000 µJ cm−2 UV radiation.
A hybridization step with radiolabeled pGEM-T easy polylinker was performed to assess the quality of the cDNA array filters (looking for nonconfluent spots with similar hybridization signals for replicates of the same clone, either on the same filter or on independent membranes).
Hybridization and washing of array filters
Before hybridization with labeled cDNA probes, the cDNA filters were processed through a mock hybridization to release loosely bound DNA. Filters were prehybridized for 6 – 8 h at 65°C in Church buffer [1% bovine serum albumin (BSA), 1 mM
ethylenediaminetetraacetic acid (EDTA), 0.5 M NaHPO4,
and 7% sodium dodecyl sulfate (SDS)] and then stripped with 0.4 M NaOH for 30 min at 45°C and neutralized with 0.1×
SSC, 0.1% SDS, and 0.2 M Tris-HCl, pH 7.5, for 15 min at
45°C. A hybridization step with radiolabeled pGEM-T easy polylinker was performed to validate cDNA array filter quality. Double-stranded SMART cDNAs from different tissues (xylem, phloem, cambium and leaves) were used as probes. Desmin DNA was prepared by PCR amplification of a full-length cDNA clone using ‘Desmin up’ (5′-cttcttccatcccaggacac-3′) and ‘Desmin down’ (5′-ctcccaccagcctgagac-(5′-cttcttccatcccaggacac-3′) primers. The pGEM-T easy polylinker was obtained by PCR amplification using T7 and M13 reverse universal primers. Labeling of probes was performed with [α-33P] dCTP (Amersham Biosciences,
Freiburg, Germany) on a cDNA mixture (100 ng SMART PCR cDNAs + 3 ng Desmin cDNA) using the Prime-a-Gene
New Phytologist (2006) 170: 739–752 www.newphytologist.org © New Phytologist (2006) No claim to French government works
Research
742
Labeling System (Promega) according to the supplier’s instructions. Labeling of pGEM-T easy polylinker was performed by primer extension using T7 or M13 reverse primers. cDNAs (20 ng) and primers (10 pmol each) were denatured for 2 min at 100°C, and then cooled on ice for 5 min. BSA (20 µg), dNTPs minus dCTP (1 nmol each), 5 units of DNA polymerase I Klenow fragment (Promega), 1× Klenow buffer and [α-33P] dCTP (50 µCi) (Amersham Biosciences)
were then added and the reaction was incubated for 1 h at room temperature. Labeled probes were purified on Sephadex-G50 (Amersham Biosciences) columns, denatured at 100°C for 3 min and cooled on ice for 5 min. Filters were prehybridized for 6 – 8 h at 65°C in Church buffer and hybridization was carried out at 65°C for 14–16 h. Filters were then washed at 65°C, once in 2× SSC and 0.5% SDS and twice in 2× SSC and 0.5% SDS for 15 min at 65°C. They were then dried on Whatman 3MM paper and exposed to phosphorscreen imaging plates (FUJI Film, Tokyo, Japan) for 2 h.
Image acquisition
Imaging plates were scanned with a phosphorimager FUJI BAS 500 (FUJI Film) at 50-µm resolution (graduation 8 bits). Detection and quantification of the signals, representing the hybridizing cDNAs, were performed using ARRAYGAUGE
version 1.3 imaging software (FUJI Film). A two-level grid template was generated, automatically superimposed on the data image for spot signal quantification and manually adjusted. The limit density range (LDR) option provided by the ARRAYGAUGE software was adjusted to 20% to eliminate
low-density pixels (> 20% of the average pixel density). The surrounding background for each grid was calculated based on the average pixel density of four empty spots positioned around each grid.
Data processing and statistical analysis
The quality of the raw hybridization data was first evaluated by comparing the values obtained for duplicates of the same membrane. Before any statistical treatment of hybridization data, raw hybridization signals were normalized. Normalization was performed on each filter independently. Both duplicates of the same clone were treated separately. The surrounding background was subtracted from the average density for each spot. The value obtained will be referred to as ‘raw intensity’. To correct the hybridization zone effect, arrays were shared in zones, each zone containing all internal standards (EgG3PDH, EgIDH and EgTubA1). The raw intensity of each spot was divided by a factor corresponding to the median intensity of internal standards within the corresponding zone divided by the median intensity of internal standards on the whole filter. The resulting corrected hybridization value was referred to as the ‘zone-corrected intensity’. To normalize probe labeling, the Desmin cDNA was incorporated into the probe before
labeling. This DNA did not hybridize on filters at levels higher than typical nonspecific hybridization (data not shown). The value of each spot could hence be corrected by dividing the zone-corrected intensity by the median intensity of all Desmin spots on the filter. The resulting ‘normalized intensity’ was then used for statistical analysis. Analyses of variance (ANOVAs) were performed for each Xp library clone. The significance of differences in expression patterns was tested by ANOVA with a threshold P-value of 0.05, using the R software (http://
www.r-project.org/). Sequencing
Sequencing was performed at the Toulouse Génopôle platform facilities (http://genopole-toulouse.prd.fr/) using PCR products purified on a Multiscreen 96-well filter plate (Millipore) with Sephadex G-50 Superfine (Amersham Biosciences). Sequencing reactions were carried out with dye terminator cycle chemistry (BigDyeTerminator Cycle Sequencing Kit; Applied Biosystems, Foster City, CA, USA) and automated capillary electrophoresis (ABI Prism 3700 DNA Analyzer; Applied Biosystems). Sequencing was performed using either T7 or M13 reverse universal primers.
Real-time PCR
Total RNAs were extracted and treated with RQ1 DNAse as previously described and cleaned on an RNeasy column (Qiagen, Valencia, CA, USA). The first-strand cDNA was synthesized using 1 µg of total RNA by priming with random hexamers and the Superpscript II retrotranscriptase (Invitrogen) according to the manufacturer’s procedure. Finally, first-strand cDNAs were purified on a column (QIAquick purification system for PCR product; Qiagen) and eluted in a final volume of 100 µl. Real-time reverse transcription (RT)–PCR was performed on a Light Cycler (Roche Diagnostics, Basel, Switzerland) using the LightCycler FastStart DNA MasterPLUS SYBR Green I
kit (Roche Diagnostics). PCR reactions were set up in a 15-µl volume containing 20 ng of purified cDNA, 1× Light Cycler FastStart DNA MasterPLUS SYBR Green I Master Mix and
0.5 µM of each primer.
Primer pairs were designed to contain a minimum of 50% GC and to amplify fragments 75–150 bp long using the
OLIGO PRIMER 3 software (Whitehead Institute for Biomedical
Research, Cambridge, MA, USA). Specific primers pairs were designed for each gene: [12A03] (up 5′-gaccaaggaggaagctgttg-3′, down 5′-gcctacagcagcatacaatcg-3′); [13C05] (up 5′-atgggtc-ccttcgagttctc-3′; down 5′-tatgaccgtcttgcctttgg-3′); [15C12] (up 5′-tgttgcctcgtaggtgtttg-3′; down 5′-tgcaactaagcatcccttgg-3′); [12C03] (up 5′-ggtgcctctttctttctttcc-3′, down 5′-agaactcccct-tcccacaag-3′); [17F08] (up 5′-tgacaacggcagcagagtag-3′; down 5′-ctcttccatgcttggacttc-3′); [17B12] (up 5′-agcggcctgtctaatctaga-3′; down 5′-agcggcctgtctaatctaga-3′); [15F10] (up 5′-cccatta-gagagatagtgaaaagt-3′; down 5′-cagtcggaggcgtcccaa-3′); [19H05]
© New Phytologist (2006) No claim to French government works www.newphytologist.org New Phytologist (2006) 170: 739–752
Research 743 (up 5′-agcgcgtcgaggttcatcaa-3′; down
5′-tggggaaagtgttgctggtata-3′) and the control EgrRNA 18S (up 5′-ccgtgcgatccgtcaag-3′; down 5′-cccgacttttggaagggatg-3′). The specificity of primer annealing was examined by monitoring the dissociation curve of the PCR products. For each gene, a negative control was run with no cDNA template, to assess the overall specificity. For each reaction, the PCR efficiency was tested using 50, 5, 0.5, 0.05 and 0.005 fg of each PCR product, and 50, 5, 0.5, 0.05 and 0.005 pg for the 18S control RNA, as templates to construct a standard curve. The standard curve slope was determined for each PCR run and used to calculate PCR efficiency. Relative quantification was performed according to the mathematical model developed by Pfaffl (2001).
Results
Identification and characterization of Xp library genes Xylem and phloem derive from the same meristematic cambium cells and both tissues may therefore express some of the same genes. Because we were interested in the molecular mechanisms underlying xylogenesis in particular, we decided to clone genes specifically or preferentially involved in secondary xylem formation when compared with secondary phloem. Towards this goal, SSH (Diatchenko et al., 1996) was carried out between cDNAs prepared from the differentiating secondary xylem (X) of Eucalyptus as tester and secondary phloem (P) as driver. The SSH technique was chosen because, by amplifying and normalizing the subtracted cDNAs, it enriches the less abundant transcripts (Diatchenko et al., 1996). Vascular tissue sampling is described in the ‘Materials and Methods’ section. The resulting ‘Xp’ SSH library contained a total of 1123 recombinant clones. cDNA fragments ranged from 50 to 750 bp, with an average size of 300 bp. Sequence analysis of these 1123 SSH clones led to the identification of 263 independent sequences (unigenes) of which 44.6% were present in only one copy, 24.4% were duplicates and 30% were represented three times or more (Table S1, provided as supplementary data on the website of the journal).
These 263 unigenes were annotated using BLASTX and TBLASTX similarity searches against nonredundant protein and GenBank databases (NCBI), and the Arabidopsis thaliana Munich Information Centre for Protein Sequences (MIPS) database. We also performed similarity searches against the Populus database (http://poppel.fysbot.umu.se/index.html), which includes more than 121 495 expressed sequence tags (ESTs), and the poplar genome databases (http://genome. jgi-psf.org/Poptr1/Poptr1.home.html). Similarities were con-sidered as significant when the E-value was below 0.0001. Among the 263 sequences, a high proportion (82 unigenes, or 31.2% of the unigenes) showed no homology with known sequences and were classified as ‘no hits’ (supplementary Table S1). Remarkably, one of these ‘no hits’ ([17B12]) corresponded to a clone we found 84 times in the library.
By contrast, 181 sequences (68.8% of the unigenes) showed significant similarities with proteins of known function (137 sequences, or 75.7%) or with putative proteins or proteins of unknown function (44 sequences, or 24.3%) (Table 1).
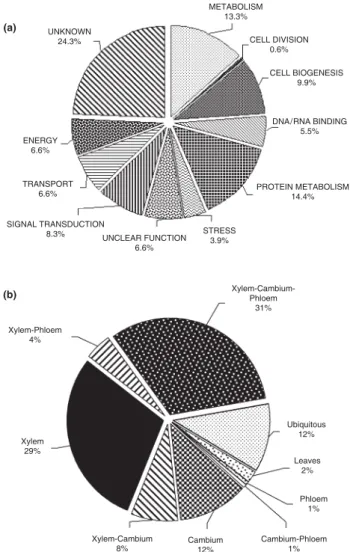
These 181 unigenes were assigned to 11 functional categories using the MIPS Functional Catalogue (Schoof et al., 2002; http://mips.gsf.de/projects/funcat; Table 1 and Fig. 1a). Some
Fig. 1 (a) Functional classification of the 181 xylem vs phloem
subtractive library (Xp) unigenes showing significant homologies. Expressed sequence tags (ESTs) with BLAST E-values < 0.0001 were categorized according to the Munich Information Centre for Protein Sequences (MIPS) standard: unknown (with similarity to putative proteins or proteins of unknown function), metabolism, energy, cell division, DNA/RNA binding, protein metabolism, transport, cell biogenesis, signal transduction, stress and unclear function. (b) Expression categories of the 295 unigenes spotted onto the membrane. Unigenes were classified according to their expression ratios between the different tissues. The categories consisted of unigenes exhibiting significant over-expression in xylem (X), cambium (C), phloem (P), leaves (L), both xylem and cambium (X-C), both xylem and phloem (X-P), both cambium and phloem (C-P), unigenes whose expression was similar in the three vascular tissues (X-C-P). Ubiquitous, unigenes whose expression was similar in vascular tissues and leaves, or whose expression was ubiquitous.
N ew P hytologist (2006) 170 : 739 –752 www .newphytologist.or g © N ew P hytologist (2006) N o claim to F rench go vernment wor ks Research 744
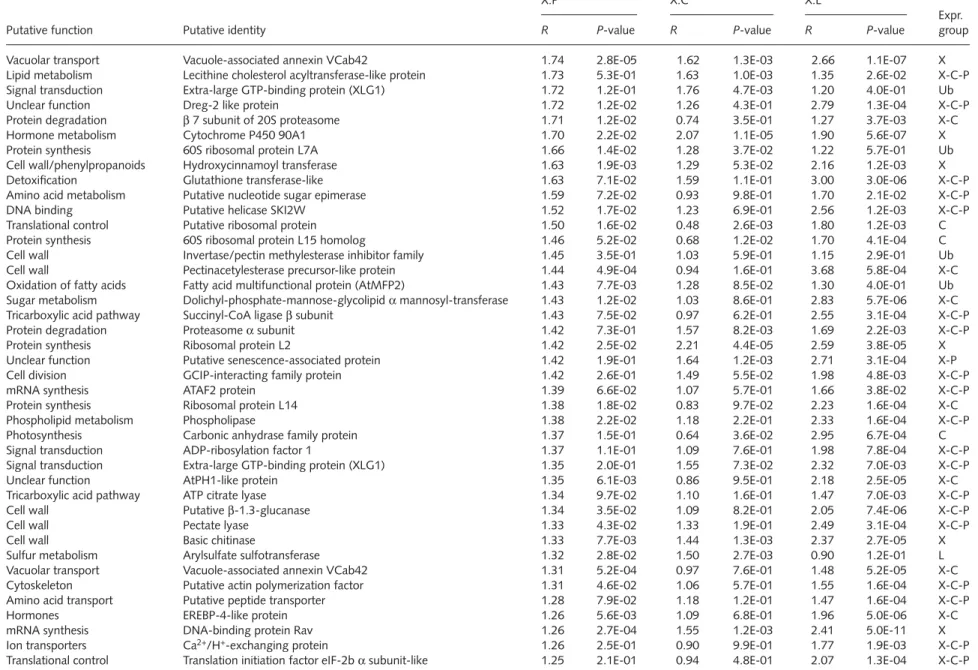
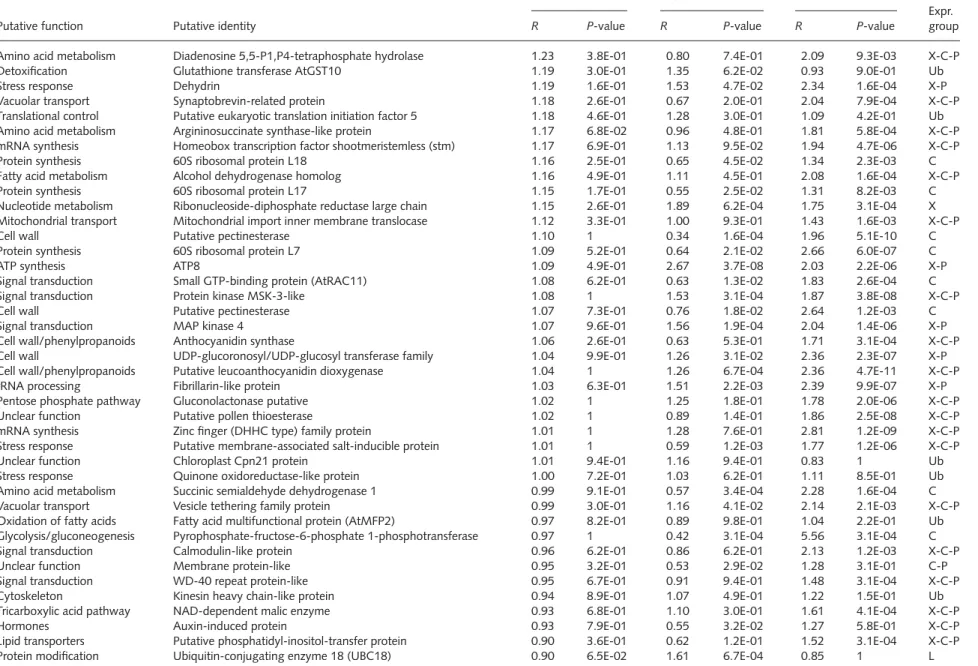
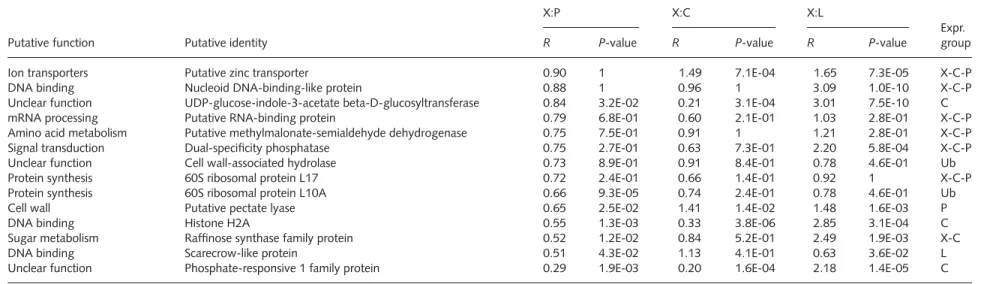
Table 1 Expression profiles of the xylem vs phloem subtractive library (Xp) unigenes with putative functions
Putative function Putative identity
X:P X:C X:L
Expr. group
R P-value R P-value R P-value
Secondary metabolism β-galactosidase-like protein 9.07 1.2E-03 11.11 4.1E-12 13.16 5.8E-04 X
Protein synthesis 60S ribosomal protein L7 7.73 5.8E-04 10.25 5.8E-04 13.75 5.8E-04 X
Hormone metabolism Aminocyclopropane-1-carboxylate oxidase 7.47 1.2E-03 14.73 5.8E-04 15.72 1.2E-03 X
Metabolism Alcohol dehydrogenase 2 5.05 1.2E-03 5.15 4.5E-08 6.89 6.7E-04 X
Nucleotide metabolism dTDP-D-glucose 4,6-dehydratase 4.91 3.1E-04 5.99 1.5E-07 9.78 3.1E-04 X
Protein degradation Cysteine proteinase 4.78 5.8E-04 4.84 5.8E-04 6.74 3.1E-04 X
Protein synthesis 60S ribosomal protein L15 4.78 3.1E-04 2.94 3.1E-04 8.83 3.1E-04 X
Cell wall UDP-glucose glucosyltransferase 4.24 7.3E-09 2.04 7.8E-05 10.46 3.1E-04 X
Defense NtPRp27-like protein 3.96 2.2E-03 4.88 2.2E-12 7.46 6.5E-13 X
Signal transduction Transducin family protein/WD-40 repeat family 3.53 5.8E-04 4.21 7.8E-09 4.83 1.1E-08 X
Metabolism Hexokinase putative 3.40 1.1E-02 1.96 2.6E-02 3.99 5.9E-12 X
Protein synthesis Peptidyl-prolyl cis-trans isomerase (PPIase) 3.27 4.9E-11 2.49 5.8E-04 7.70 5.7E-14 X
Cell wall/phenylpropanoids Caffeoyl-CoA O-methyltransferase 3.02 1.2E-04 1.46 1.1E-03 3.42 2.2E-03 X
Protein degradation Zinc finger (C3HC4-type RING finger) family protein 3.01 2.2E-03 2.77 3.7E-08 3.14 1.3E-08 X
Protein degradation Ubiquitin family protein 2.80 2.8E-05 3.53 7.1E-06 4.77 1.6E-04 X
Cell wall Fasciclin-like AGP 11 2.81 1.6E-04 2.25 4.5E-03 4.66 1.6E-04 X
Unclear function Selenium-binding protein 2.75 5.8E-04 1.81 1.5E-04 4.28 2.5E-03 X
Signal transduction Small GTP-binding protein (AtRAC5) 2.69 3.7E-05 1.80 1.7E-03 4.61 6.7E-04 X
Unclear function ATP-dependent Clp protease proteolytic subunit 2.64 1.2E-03 2.40 5.8E-04 2.53 5.8E-04 X
Tricarboxylic acid pathway Malate dehydrogenase-like protein 2.40 3.1E-04 1.13 3.8E-02 3.47 1.2E-03 X
Cell wall Xyloglucan endo-transglycosylase-like protein 2.39 3.6E-05 0.89 1 5.42 5.8E-04 X-C
Fatty acid metabolism Ribitol dehydrogenase-like 2.23 3.1E-04 2.56 3.1E-04 2.48 1.6E-04 X
Translational control Putative translation initiation factor eIF-1A 2.21 6.6E-08 2.08 1.3E-05 2.59 2.9E-07 X
Protein synthesis 60S ribosomal protein L7A 2.17 1.6E-04 1.30 5.8E-02 1.81 6.7E-04 X
Protein degradation Ubiquitin family protein 2.13 2.6E-04 2.37 3.0E-03 2.44 6.7E-04 X
Unclear function phi-1 2.11 6.4E-05 1.55 2.2E-03 2.03 5.8E-04 X
Signal transduction CBL-interacting protein kinase 2.08 2.0E-05 3.18 3.1E-04 1.50 2.1E-04 X
Phospholipid metabolism Phospholipid/glycerol acyltransferase family protein 2.07 6.2E-06 1.65 3.5E-04 2.05 4.9E-06 X
Tricarboxylic acid pathway ATP-citrate synthase [ATP-citrate (pro-S-)-lyase] 2.06 4.4E-04 1.62 1.3E-03 2.01 1.6E-04 X
Glycolysis/gluconeogenesis Phosphoenolpyruvate carboxykinase 2.00 2.2E-03 1.21 3.8E-02 3.04 1.2E-03 X
Vacuolar transport Annexin 1.95 1.1E-02 0.49 1.2E-03 2.82 5.8E-04 C
Vacuolar transport Synaptobrevin-related protein 1.90 1.4E-03 1.45 3.6E-02 2.86 1.6E-04 X
Protein synthesis 60S ribosomal protein L10A 1.86 6.9E-02 1.50 2.4E-01 4.26 1.6E-04 X-C-P
Nucleotide metabolism DNA (apurinic or apyrimidinic site) lyase (ARP) 1.86 3.1E-04 0.81 2.5E-01 2.02 6.7E-04 X-C
Metabolism Cytochrome P450-like_TbP 1.84 2.8E-01 1.77 5.3E-02 1.79 6.7E-04 X-C-P
Detoxification Glutathione-S-transferase 1.82 3.0E-02 0.72 7.8E-01 1.57 5.2E-04 X-C-P
Oxidative phosphorylation Putative SCO1 protein 1.81 9.0E-03 0.58 9.5E-03 3.12 1.2E-03 C
Protein synthesis 40S ribosomal protein S2 homolog 1.78 8.1E-09 1.20 5.0E-03 2.22 4.3E-08 X
Hormones ABA-responsive element binding bZip transcription factor 1.77 6.0E-05 1.55 1.6E-03 2.08 9.2E-06 X
Peptide transporters Putative peptide transport protein 1.76 5.2E-03 1.29 1.1E-01 4.29 3.1E-04 X-C-P
© N ew P hytologist (2006) N o claim to F rench go vernment wor ks www .newphytologist.or g N ew P hytologist (2006) 170 : 739 –752 Research 745
Vacuolar transport Vacuole-associated annexin VCab42 1.74 2.8E-05 1.62 1.3E-03 2.66 1.1E-07 X
Lipid metabolism Lecithine cholesterol acyltransferase-like protein 1.73 5.3E-01 1.63 1.0E-03 1.35 2.6E-02 X-C-P
Signal transduction Extra-large GTP-binding protein (XLG1) 1.72 1.2E-01 1.76 4.7E-03 1.20 4.0E-01 Ub
Unclear function Dreg-2 like protein 1.72 1.2E-02 1.26 4.3E-01 2.79 1.3E-04 X-C-P
Protein degradation β 7 subunit of 20S proteasome 1.71 1.2E-02 0.74 3.5E-01 1.27 3.7E-03 X-C
Hormone metabolism Cytochrome P450 90A1 1.70 2.2E-02 2.07 1.1E-05 1.90 5.6E-07 X
Protein synthesis 60S ribosomal protein L7A 1.66 1.4E-02 1.28 3.7E-02 1.22 5.7E-01 Ub
Cell wall/phenylpropanoids Hydroxycinnamoyl transferase 1.63 1.9E-03 1.29 5.3E-02 2.16 1.2E-03 X
Detoxification Glutathione transferase-like 1.63 7.1E-02 1.59 1.1E-01 3.00 3.0E-06 X-C-P
Amino acid metabolism Putative nucleotide sugar epimerase 1.59 7.2E-02 0.93 9.8E-01 1.70 2.1E-02 X-C-P
DNA binding Putative helicase SKI2W 1.52 1.7E-02 1.23 6.9E-01 2.56 1.2E-03 X-C-P
Translational control Putative ribosomal protein 1.50 1.6E-02 0.48 2.6E-03 1.80 1.2E-03 C
Protein synthesis 60S ribosomal protein L15 homolog 1.46 5.2E-02 0.68 1.2E-02 1.70 4.1E-04 C
Cell wall Invertase/pectin methylesterase inhibitor family 1.45 3.5E-01 1.03 5.9E-01 1.15 2.9E-01 Ub
Cell wall Pectinacetylesterase precursor-like protein 1.44 4.9E-04 0.94 1.6E-01 3.68 5.8E-04 X-C
Oxidation of fatty acids Fatty acid multifunctional protein (AtMFP2) 1.43 7.7E-03 1.28 8.5E-02 1.30 4.0E-01 Ub
Sugar metabolism Dolichyl-phosphate-mannose-glycolipid α mannosyl-transferase 1.43 1.2E-02 1.03 8.6E-01 2.83 5.7E-06 X-C
Tricarboxylic acid pathway Succinyl-CoA ligase β subunit 1.43 7.5E-02 0.97 6.2E-01 2.55 3.1E-04 X-C-P
Protein degradation Proteasome α subunit 1.42 7.3E-01 1.57 8.2E-03 1.69 2.2E-03 X-C-P
Protein synthesis Ribosomal protein L2 1.42 2.5E-02 2.21 4.4E-05 2.59 3.8E-05 X
Unclear function Putative senescence-associated protein 1.42 1.9E-01 1.64 1.2E-03 2.71 3.1E-04 X-P
Cell division GCIP-interacting family protein 1.42 2.6E-01 1.49 5.5E-02 1.98 4.8E-03 X-C-P
mRNA synthesis ATAF2 protein 1.39 6.6E-02 1.07 5.7E-01 1.66 3.8E-02 X-C-P
Protein synthesis Ribosomal protein L14 1.38 1.8E-02 0.83 9.7E-02 2.23 1.6E-04 X-C
Phospholipid metabolism Phospholipase 1.38 2.2E-02 1.18 2.2E-01 2.33 1.6E-04 X-C-P
Photosynthesis Carbonic anhydrase family protein 1.37 1.5E-01 0.64 3.6E-02 2.95 6.7E-04 C
Signal transduction ADP-ribosylation factor 1 1.37 1.1E-01 1.09 7.6E-01 1.98 7.8E-04 X-C-P
Signal transduction Extra-large GTP-binding protein (XLG1) 1.35 2.0E-01 1.55 7.3E-02 2.32 7.0E-03 X-C-P
Unclear function AtPH1-like protein 1.35 6.1E-03 0.86 9.5E-01 2.18 2.5E-05 X-C
Tricarboxylic acid pathway ATP citrate lyase 1.34 9.7E-02 1.10 1.6E-01 1.47 7.0E-03 X-C-P
Cell wall Putative β-1.3-glucanase 1.34 3.5E-02 1.09 8.2E-01 2.05 7.4E-06 X-C-P
Cell wall Pectate lyase 1.33 4.3E-02 1.33 1.9E-01 2.49 3.1E-04 X-C-P
Cell wall Basic chitinase 1.33 7.7E-03 1.44 1.3E-03 2.37 2.7E-05 X
Sulfur metabolism Arylsulfate sulfotransferase 1.32 2.8E-02 1.50 2.7E-03 0.90 1.2E-01 L
Vacuolar transport Vacuole-associated annexin VCab42 1.31 5.2E-04 0.97 7.6E-01 1.48 5.2E-05 X-C
Cytoskeleton Putative actin polymerization factor 1.31 4.6E-02 1.06 5.7E-01 1.55 1.6E-04 X-C-P
Amino acid transport Putative peptide transporter 1.28 7.9E-02 1.18 1.2E-01 1.47 1.6E-04 X-C-P
Hormones EREBP-4-like protein 1.26 5.6E-03 1.09 6.8E-01 1.96 5.0E-06 X-C
mRNA synthesis DNA-binding protein Rav 1.26 2.7E-04 1.55 1.2E-03 2.41 5.0E-11 X
Ion transporters Ca2+/H+-exchanging protein 1.26 2.5E-01 0.90 9.9E-01 1.77 1.9E-03 X-C-P
Translational control Translation initiation factor eIF-2b α subunit-like 1.25 2.1E-01 0.94 4.8E-01 2.07 1.3E-04 X-C-P
Putative function Putative identity
X:P X:C X:L
Expr. group
R P-value R P-value R P-value
N ew P hytologist (2006) 170 : 739 –752 www .newphytologist.or g © N ew P hytologist (2006) N o claim to F rench go vernment wor ks Research 746
Amino acid metabolism Diadenosine 5,5-P1,P4-tetraphosphate hydrolase 1.23 3.8E-01 0.80 7.4E-01 2.09 9.3E-03 X-C-P
Detoxification Glutathione transferase AtGST10 1.19 3.0E-01 1.35 6.2E-02 0.93 9.0E-01 Ub
Stress response Dehydrin 1.19 1.6E-01 1.53 4.7E-02 2.34 1.6E-04 X-P
Vacuolar transport Synaptobrevin-related protein 1.18 2.6E-01 0.67 2.0E-01 2.04 7.9E-04 X-C-P
Translational control Putative eukaryotic translation initiation factor 5 1.18 4.6E-01 1.28 3.0E-01 1.09 4.2E-01 Ub
Amino acid metabolism Argininosuccinate synthase-like protein 1.17 6.8E-02 0.96 4.8E-01 1.81 5.8E-04 X-C-P
mRNA synthesis Homeobox transcription factor shootmeristemless (stm) 1.17 6.9E-01 1.13 9.5E-02 1.94 4.7E-06 X-C-P
Protein synthesis 60S ribosomal protein L18 1.16 2.5E-01 0.65 4.5E-02 1.34 2.3E-03 C
Fatty acid metabolism Alcohol dehydrogenase homolog 1.16 4.9E-01 1.11 4.5E-01 2.08 1.6E-04 X-C-P
Protein synthesis 60S ribosomal protein L17 1.15 1.7E-01 0.55 2.5E-02 1.31 8.2E-03 C
Nucleotide metabolism Ribonucleoside-diphosphate reductase large chain 1.15 2.6E-01 1.89 6.2E-04 1.75 3.1E-04 X
Mitochondrial transport Mitochondrial import inner membrane translocase 1.12 3.3E-01 1.00 9.3E-01 1.43 1.6E-03 X-C-P
Cell wall Putative pectinesterase 1.10 1 0.34 1.6E-04 1.96 5.1E-10 C
Protein synthesis 60S ribosomal protein L7 1.09 5.2E-01 0.64 2.1E-02 2.66 6.0E-07 C
ATP synthesis ATP8 1.09 4.9E-01 2.67 3.7E-08 2.03 2.2E-06 X-P
Signal transduction Small GTP-binding protein (AtRAC11) 1.08 6.2E-01 0.63 1.3E-02 1.83 2.6E-04 C
Signal transduction Protein kinase MSK-3-like 1.08 1 1.53 3.1E-04 1.87 3.8E-08 X-C-P
Cell wall Putative pectinesterase 1.07 7.3E-01 0.76 1.8E-02 2.64 1.2E-03 C
Signal transduction MAP kinase 4 1.07 9.6E-01 1.56 1.9E-04 2.04 1.4E-06 X-P
Cell wall/phenylpropanoids Anthocyanidin synthase 1.06 2.6E-01 0.63 5.3E-01 1.71 3.1E-04 X-C-P
Cell wall UDP-glucoronosyl/UDP-glucosyl transferase family 1.04 9.9E-01 1.26 3.1E-02 2.36 2.3E-07 X-P
Cell wall/phenylpropanoids Putative leucoanthocyanidin dioxygenase 1.04 1 1.26 6.7E-04 2.36 4.7E-11 X-C-P
rRNA processing Fibrillarin-like protein 1.03 6.3E-01 1.51 2.2E-03 2.39 9.9E-07 X-P
Pentose phosphate pathway Gluconolactonase putative 1.02 1 1.25 1.8E-01 1.78 2.0E-06 X-C-P
Unclear function Putative pollen thioesterase 1.02 1 0.89 1.4E-01 1.86 2.5E-08 X-C-P
mRNA synthesis Zinc finger (DHHC type) family protein 1.01 1 1.28 7.6E-01 2.81 1.2E-09 X-C-P
Stress response Putative membrane-associated salt-inducible protein 1.01 1 0.59 1.2E-03 1.77 1.2E-06 X-C-P
Unclear function Chloroplast Cpn21 protein 1.01 9.4E-01 1.16 9.4E-01 0.83 1 Ub
Stress response Quinone oxidoreductase-like protein 1.00 7.2E-01 1.03 6.2E-01 1.11 8.5E-01 Ub
Amino acid metabolism Succinic semialdehyde dehydrogenase 1 0.99 9.1E-01 0.57 3.4E-04 2.28 1.6E-04 C
Vacuolar transport Vesicle tethering family protein 0.99 3.0E-01 1.16 4.1E-02 2.14 2.1E-03 X-C-P
Oxidation of fatty acids Fatty acid multifunctional protein (AtMFP2) 0.97 8.2E-01 0.89 9.8E-01 1.04 2.2E-01 Ub
Glycolysis/gluconeogenesis Pyrophosphate-fructose-6-phosphate 1-phosphotransferase 0.97 1 0.42 3.1E-04 5.56 3.1E-04 C
Signal transduction Calmodulin-like protein 0.96 6.2E-01 0.86 6.2E-01 2.13 1.2E-03 X-C-P
Unclear function Membrane protein-like 0.95 3.2E-01 0.53 2.9E-02 1.28 3.1E-01 C-P
Signal transduction WD-40 repeat protein-like 0.95 6.7E-01 0.91 9.4E-01 1.48 3.1E-04 X-C-P
Cytoskeleton Kinesin heavy chain-like protein 0.94 8.9E-01 1.07 4.9E-01 1.22 1.5E-01 Ub
Tricarboxylic acid pathway NAD-dependent malic enzyme 0.93 6.8E-01 1.10 3.0E-01 1.61 4.1E-04 X-C-P
Hormones Auxin-induced protein 0.93 7.9E-01 0.55 3.2E-02 1.27 5.8E-01 X-C-P
Lipid transporters Putative phosphatidyl-inositol-transfer protein 0.90 3.6E-01 0.62 1.2E-01 1.52 3.1E-04 X-C-P
Protein modification Ubiquitin-conjugating enzyme 18 (UBC18) 0.90 6.5E-02 1.61 6.7E-04 0.85 1 L
Putative function Putative identity
X:P X:C X:L
Expr. group
R P-value R P-value R P-value
© N ew P hytologist (2006) N o claim to F rench go vernment wor ks www .newphytologist.or g N ew P hytologist (2006) 170 : 739 –752 Research 747
Ion transporters Putative zinc transporter 0.90 1 1.49 7.1E-04 1.65 7.3E-05 X-C-P
DNA binding Nucleoid DNA-binding-like protein 0.88 1 0.96 1 3.09 1.0E-10 X-C-P
Unclear function UDP-glucose-indole-3-acetate beta-D-glucosyltransferase 0.84 3.2E-02 0.21 3.1E-04 3.01 7.5E-10 C
mRNA processing Putative RNA-binding protein 0.79 6.8E-01 0.60 2.1E-01 1.03 2.8E-01 X-C-P
Amino acid metabolism Putative methylmalonate-semialdehyde dehydrogenase 0.75 7.5E-01 0.91 1 1.21 2.8E-01 X-C-P
Signal transduction Dual-specificity phosphatase 0.75 2.7E-01 0.63 7.3E-01 2.20 5.8E-04 X-C-P
Unclear function Cell wall-associated hydrolase 0.73 8.9E-01 0.91 8.4E-01 0.78 4.6E-01 Ub
Protein synthesis 60S ribosomal protein L17 0.72 2.4E-01 0.66 1.4E-01 0.92 1 X-C-P
Protein synthesis 60S ribosomal protein L10A 0.66 9.3E-05 0.74 2.4E-01 0.78 4.6E-01 Ub
Cell wall Putative pectate lyase 0.65 2.5E-02 1.41 1.4E-02 1.48 1.6E-03 P
DNA binding Histone H2A 0.55 1.3E-03 0.33 3.8E-06 2.85 3.1E-04 C
Sugar metabolism Raffinose synthase family protein 0.52 1.2E-02 0.84 5.2E-01 2.49 1.9E-03 X-C
DNA binding Scarecrow-like protein 0.51 4.3E-02 1.13 4.1E-01 0.63 3.6E-02 L
Unclear function Phosphate-responsive 1 family protein 0.29 1.9E-03 0.20 1.6E-04 2.18 1.4E-05 C
Expression ratios (R) and their corresponding analysis of variance (ANOVA) P-values between normalized values from xylem and phloem (X:P), xylem and cambium (X:C), and xylem and leaves (X:L). ‘Expr. group’, the expression group into which unigenes were classified according to their significant over-expression in xylem (X), cambium (C), phloem (P), leaves (L), both xylem and cambium (X-C), both xylem and phloem (X-P), or both phloem and cambium (P-C), or their similar expression in the three vascular tissues (X-C-P) or ubiquitous expression in vascular tissues and leaves (Ub).
ABA, abscisic acid. NtPRp27, Nicotiana tabacum pathogenesis related protein. AGP, arabinogalactan protein. Clp, caseinolytic protein. CBL, Calcineurin B-like. SCO1, suppressor of cytochrome oxydase deficiency 1. Dreg-2, Drosophila rhythmically expressed gene 2.
GCIP, cyclin D interacting protein. ATAF2, Arabidopsis transcription activator factor. AtPH1, Arabidopsis thaliana pleckstrin homology domain containing protein. EREBP, ethylene responsive element binding protein. MSK-3, Medicago glycogen synthase kinase 3. MAP, Mitogen activated protein.
Putative function Putative identity
X:P X:C X:L
Expr. group
R P-value R P-value R P-value
New Phytologist (2006) 170: 739–752 www.newphytologist.org © New Phytologist (2006) No claim to French government works
Research
748
proteins fell into several functional classes. In these cases, they were classified according to their most probable role in xylem. When the function was unclear, proteins were classified as of ‘unclear function’. The most represented categories were protein metabolism (14.4%), metabolism (13.3%) and cell biogenesis (9.9%) (Fig. 1a). Other significant functional categories included signal transduction (8.3%), transport (6.6%) and DNA/RNA binding (5.5%). The percentage of genes belonging to the cell division category was very low (0.6%).
Many genes found in the various functional classes were indicative of biological processes known to occur during xylogenesis (Table 1). For example, several hormone signaling pathways were well represented in the library, in agreement with the known role of hormones in xylem differentiation. For instance, four unigenes encoded proteins involved in the auxin signaling pathway and auxin-responsive gene expression: two small GTP-binding proteins ([15E07] and [19H05]), one peptidyl-prolyl cis-trans isomerase (PPIase) ([15D12]) and one auxin-induced protein ([14H07]). The signal transduction category also contained two transcription factors potentially associated with abscisic acid (ABA) ([13G03]) and ethylene ([11E02]) signaling. The ubiquitin-dependent proteolysis pathway, whose role in xylogenesis is increasingly evident, was represented by no less than six genes within the protein degradation subclass of the protein metabolism category includ-ing one α and one β subunit of the 20S proteasome ([10D11] and [14H11]), one cysteine proteinase ([16G03]) and three proteins implicated in the ubiquitin degradation pathway ([13C05], [08A12] and [10A05]). The vast majority (90%) of genes found in the cell biogenesis category encoded cell wall-related proteins involved in either cell elongation (56%) or secondary cell wall formation (44%). Only two genes of the lignin biosynthetic pathway were present in the Xp library: a caffeoyl CoA O-methyltransferase (CCoAOMT [08G09]) and a hydroxycinnamoyl CoA:shikimate/quinate hydroxy-cinnamoyltransferase (HCT [12E10]) whose role in lignin biosynthesis was demonstrated recently (Hoffmann et al., 2003, 2004).
Notably, 35 unigenes in the Xp library were also found in the Eucalyptus ‘xylem vs leaves’ subtractive library previously constructed in our laboratory (Table S1) (Paux et al., 2004). Most of these common genes encode proteins belonging to categories of cell wall biogenesis (pectinesterase [14B10], xyloglugan endo-transglycosylase (XET) [15F10], arabinogalactan pro-tein [08B08] and CCoAOMT [08G09]) and auxin signaling (PPiase [15D12] and small GTP-binding proteins [15E07] and [19H05]). Interestingly, two proteins for which a role in xylogenesis is still unclear were present in the two subtractive libraries: a nitrilase-associated protein ([18A01]) and a Nico-tiana tabacum pathogenesis related protein (NtPRp27)-like protein ([17A09]). Several unigenes in the ‘no hits’ category were common to both libraries. Among them, the clone [17B12] was highly redundant in both libraries.
Gene expression profiling by macroarray analysis The 263 unigenes of the Xp library were spotted in duplicate onto nylon membranes, together with 32 Eucalyptus genes previously cloned in our laboratory that we considered to be candidate genes for a function in xylogenesis (such as the genes for lignin biosynthesis; Paux et al., 2004). A complete list of the ESTs we analysed is provided as supplementary material (Table S1). To minimize both technical and biological variations, the expression levels in xylem, phloem, cambium and leaves were monitored by hybridization of two membranes with two independent tissue-specific probes (raw hybridization values are provided in supplementary Table S2). Each probe was prepared from distinct RNA samples extracted from the same pool of tissue taken from three field-grown trees of the same Eucalyptus clone. A total of eight raw values were obtained for each clone under each condition. Each raw value was then normalized according to the procedure described in ‘Materials and Methods’ to correct variations related to spot position on membranes and labeling efficiency of the probes. An ANOVA with a threshold P-value of 0.05 was performed for each gene to identify genes showing significant variation in their expression levels between xylem, phloem, cambium and leaves (Table S1). This analysis indicated that the vast majority (86.7%; 256 unigenes) of the unigenes were overexpressed in at least one of the vascular tissues when compared with leaves, demonstrating that this library is enriched in sequences preferentially expressed in the vascular system (Fig. 1b).
Based on these relative expression criteria in the three vascular tissues, the genes were then classified into seven groups (X, P, C, X-C, X-P, C-P and X-C-P groups) (Fig. 1b; Table S1). Among the 123 genes preferentially expressed in one tissue only, 70.7% were preferentially expressed in xylem (X group; Table S3) and 27.6% in cambium (C group; Table S4). Only two genes were preferentially expressed in phloem (P), only one of which was from the Xp library. This clearly demonstrates the effectiveness of the subtraction, as the Xp library is largely free of phloem-specific or preferential sequences. Among the genes most highly expressed in xylem when compared with the other vascular tissues – genes that can be considered as xylem-specific – four fell into the ‘no hits’ category ([15C12], [17B12], [14D04] and [17F08]) with X:P and X:C ratios ranging between 4.5 and 12.0.
Interestingly, the X group also contained five of the eight unigenes in the Xp library that were related to protein modi-fication and proteolysis: one PPIase ([15D12]), two ubiquitin family proteins ([13C05] and [08A12]), one C3HC4-type RING-finger ([10A02]), and one papain-like cysteine proteinase ([16G03]) that could be involved in tracheary element (TE) autolysis. These genes exhibited quite high X:P and X:C expres-sion ratios ranging between 2.2 and 4.8, thus providing new evidence supporting roles for ubiquitin- and proteasome-dependent proteolysis in regulating xylem differentiation (Vilaine et al., 2003; Paux et al., 2004; Schrader et al., 2004; Zhao et al., 2005).
© New Phytologist (2006) No claim to French government works www.newphytologist.org New Phytologist (2006) 170: 739–752
Research 749
A significant number of unigenes belonged to the functional category of hormone metabolism and signaling. For instance, one unigene corresponding to a putative aminocyclopropane-1-carboxylate (ACC) oxidase ([17A02]) – an enzyme of the ethylene biosynthetic pathway – was highly and specifically expressed in xylem (X:P = 7.5; X:C = 14.7), consistent with its role in wood formation (Andersson-Gunneras et al., 2003). A gene encoding a cytochrome P450 90A1 ([10D05]), likely to be involved in gibberellin (GA) biosynthesis, was also classified in the xylem group (X:P = 1.7; X:C = 2.1), support-ing the evidence that GA is involved in xylogenesis that was recently obtained from studies on transgenic tobacco (Nicotiana tabacum) plants or poplars overexpressing a GA20 oxidase gene (Eriksson et al., 2000; Biemelt et al., 2004). Also in the X group were a small GTP-binding protein of the Rho of plants (ROP) family that has homology to Arabidopsis thaliana ras-related C3 botulinum toxin substrate 5 (AtRAC5) ([15E07]) (X:P = 2.7; X:C = 1.8), which is involved in the auxin signaling pathway, and a beta (b)ZIP transcription factor ([13G03]) thought to function in ABA signaling (X:P = 1.8; X:C = 1.6).
Most of the genes we found that were involved in cell wall biogenesis were also in the X group. These included genes encoding proteins related to cell wall synthesis and elongation, such as UDP-glucose glucosyltransferase [15A09], glucosyl-transferase-5 [–], fasciclin-like arabinogalactan (FLA) protein [08B08], chitinase [18B02] and expansin [–]. Interestingly, UDP-glucose glucosyltransferase [15A09], an enzyme that catalyzes the transfer of sugar moieties from activated donor molecules to specific acceptor molecules by the formation of glycosidic bonds, was one of the most highly expressed genes in xylem tissue, suggesting its involvement in carbohydrate synthesis during secondary cell wall thickening (Mellerowicz et al., 2001). In agreement with the deposition of lignin in secondary cell walls, most of genes involved in the lignin biosynthesis pathway also belonged to the X group, i.e. laccase [–], CCoAOMTs ( [–]; [08G09] ), 4-coumarate-CoA ligase (4 CL) [–], cinnamyl alcohol dehydrogenase 2 (CAD2) [–] and HCT [12E10] (1.2 < X:P < 4.2 and 1.2 < X:C < 3.2).
A total of 34 unigenes were classified into the subset of genes preferentially expressed in the cambium (C group; Table S4). About 15% of them corresponded to genes encoding ribosomal proteins, which are thought to be expressed mainly in dividing cells. In addition, this C group also contained several enzymes that may be involved in cell wall polysaccharide remodeling or cell elongation: two putative pectinesterases ([10H06], C:X = 1.3 and C:P = 1.4; [14B10], C:X = 1.6 and C:P = 3.2), two XETs ([–], C:X = 1.5 and C:P = 3.1; [–], C:X = 1.8 and C:P = 3.2), and a β-1,3 glucanase ([–], C:X = 2.1 and C:P = 1.9). The C group also contained a small GTP-binding protein of the ROP family showing homology with AtRAC11 ([19H05]), consistent with recent reports that ROP family GTPases are involved in both cell elongation and auxin signaling (Fu et al., 2002; Fu et al., 2005).
Genes preferentially expressed in two tissues formed the smallest groups, with only 38 sequences belonging to the X-C group (60.5%, 23 unigenes), the X-P group (34.2%, 13 unigenes), or the C-P group (5.3%, two unigenes). The X-C group is of particular interest as it likely contains genes involved in early processes of xylem differentiation, including genes involved in cell wall biogenesis (Table S5). It includes pectinacetylesterase precursor-like protein [09C06], XET [15F10], an ethylene-responsive element-binding protein 4 (EREBP-4)-like transcription factor involved in hormone signaling ([11E02]), and a small GTP-binding protein of the RAC family ([–]) showing homology with Lotus japonicus (Lj) RAC2. Altogether, the X, C and X-C groups contained about 54% (144 unigenes) of the Xp library unigenes and more than 62% (20 unigenes) of the candidate genes that were added to the array.
Validation by real-time RT-PCR
To verify the reliability of the cDNA array analyses, which provided a global view of the transcript profiles, we selected
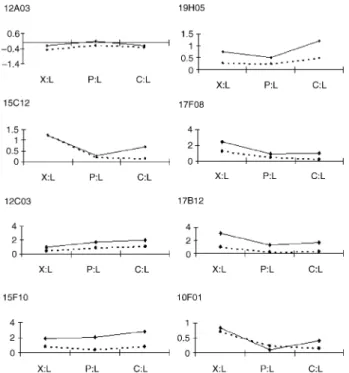
Fig. 2 Reverse transcription–polymerase chain reaction (RT-PCR)
validation of cDNA array-based expression profiles. The expression pattern of each cDNA is shown as a fold change compared with the reference tissue (leaves) and is shown on a log10 scale. The solid black
lines represent the PCR results and the dashed lines the cDNA array results. [12A03], a Scarecrow-like transcription factor; [19H05], a Rho-related small GTP-binding protein; [15C12], [17F08] and [17B12], ‘no hits’ sequences; [12C03], a phosphate-responsive 1 family protein; [15F10], a xyloglucan endo-transglycosylase-like protein; [13C05], a ubiquitin family protein. X:L, xylem versus leaves expression ratio; P:L, phloem versus leaves expression ratio; C:L cambium versus leaves expression ratio.
New Phytologist (2006) 170: 739–752 www.newphytologist.org © New Phytologist (2006) No claim to French government works
Research
750
eight genes from the Xp library to follow their expression profiles using real-time RT-PCR (Fig. 2). The choice of these genes was based on both their putative functions inferred from sequence comparison and their distinct expression patterns in the vascular tissues. For instance, two genes belonged to the C group (Table S4): a phosphate-responsive 1 family protein ([12C03]) and a small GTP-binding protein ([19H05]). According to array expression data, [12C03] exhibited the highest C:X ratio (5.1). The X group (Table S3) was represented by three ‘no hits’ genes exhibiting very high specificity for xylem as compared with cambium and phloem ([15C12], [17F08] and [17B12]), as well as one gene encoding a ubiquitin family protein ([13CO5]). A XET-like protein ([15F10]) represented the X-C group (Table S5), whereas a Scarecrow-like transcription factor ([12A03]) was representative of genes expressed in leaves.
Figure 2 shows a comparison of the relative expression ratios in the three vascular tissues as compared with leaves (X:L, C:L and P:L) for the eight selected genes obtained by both cDNA array and real-time RT-PCR methods. The hierarchy of ratios for all eight genes is well respected by the two methods, further supporting our classification of the genes into the various groups as defined by the array data. Although the data obtained with real-time RT-PCR were consistent with those obtained from the array experiments, the relative expression ratios were often higher. For instance, a dramatic difference between the data obtained with the two methods was observed for clone [17B12] (a ‘no hit’). The relative expression ratio in xylem compared with leaves (X:L) was 1243-fold higher by real-time RT-PCR than by the array method, in good agreement with the remarkable redundancy of this clone in the Xp library (found 84 times).
Similar discrepancies between the two methods were reported previously, suggesting that the ratios calculated using cDNA arrays are often underestimates (Paux et al., 2004). As shown by Miller et al. (2002), the differences observed are probably a result of the cross-hybridization that may occur between sequence-related genes from the same multigene family on arrays, whereas the use of gene-specific primers in real-time RT-PCR allows the specific amplification of a single gene.
Discussion
As a first step to identifying genes exclusively dedicated to xylem differentiation in Eucalyptus, we generated a ‘xylem vs phloem’ cDNA subtractive library (Xp). The rationale for this subtraction was to select genes that were not only preferentially expressed in the vasculature but also more specific to xylem than to phloem.
We identified 263 unigenes, of which 222 (84%) had not previously been identified in Eucalyptus. Among the gene products whose putative functions were inferred from sequence comparisons (52.1% of the 263 sequences), almost all the functional categories in the MIPS standard (Schoof et al.,
2002) were represented, with a bias towards genes involved in cell wall biogenesis and remodeling. The overall distribution among the functional categories was similar to that found in previous studies of secondary xylem formation in forest tree species and in arabidopsis, including large-scale EST sequencing approaches (Allona et al., 1998; Oh et al., 2003; Paux et al., 2004; Schrader et al., 2004; Sterky et al., 2004; Zhao et al., 2005). This, no doubt, reflects the complexity of secondary xylem in woody angiosperms, a highly specialized tissue composed of several cell types at different developmental stages. It is also consistent with the fact that xylem cells inte-grate many exogenous and endogenous signals that impinge on the expression of genes underlying cell division, elongation, cell wall biosynthesis and programmed cell death during xylogenesis.
Notably, 35 unigenes from the Xp library were also present in a Eucalyptus ‘xylem vs leaves’ subtractive library previously constructed in our laboratory (Paux et al., 2004). This validates the principle of constructing complementary sub-tractive libraries as a means to increase the pool of candidate genes potentially involved in xylem formation. Together, these libraries provide a unique portfolio of 452 unigenes that are preferentially expressed in Eucalyptus xylem. They also emphasize the importance of these common genes in xylogenesis. In addition to genes involved in the cell wall biogenesis and in the auxin signaling pathway categories, there are genes whose function in xylogenesis is unclear. This is the case, for instance, for a nitrilase-associated protein and a NtPRp27-like protein as well as for several genes in the ‘no hits’ category, which merit further investigation.
We found a large proportion of ‘no hits’ sequences (31.2% or 82 genes) among the Xp library genes. One possible explana-tion for this is that both the small average length of the SSH fragments and the large proportion of fragments correspond-ing to 3′ untranslated regions (UTRs), which are usually the least conserved regions of genes, reduce the probability of detecting sequence homologies. Some of these ‘no hits’, however, may well correspond to unidentified genes, because the SSH technique is reputed to identify new genes that are not easily recovered from total cDNA libraries because their transcripts are not very abundant (Diatchenko et al., 1996; Xiong et al., 2001; Vilaine et al., 2003). This is likely to be the case for one of the clones, [17B12], a highly xylem-specific gene that was also present in the ‘xylem vs leaves’ library (Paux et al., 2004). Although we were able to obtain a longer sequence (900 bp) than that of the initial clone, we were still unable to detect significant similarities with any public databases, including the poplar genome database and databases containing thousands of ESTs from other woody and herbaceous species (data not shown). This gene may therefore be expressed only in Eucalyptus. This particular ‘no hits’ clone [17B12], as well as other ‘no hits’ genes that we found to be highly and specifically expressed in xylem, deserve functional characterization to decipher their roles in secondary xylem formation.
© New Phytologist (2006) No claim to French government works www.newphytologist.org New Phytologist (2006) 170: 739–752
Research 751
Transcript profiling in the three different vascular tissues allowed us to classify the genes into tissue-specific subsets. Among the 87 genes belonging to the xylem group, some can be considered as xylem-specific and likely control important functions in xylogenesis. Thirty-four genes were preferentially expressed in cambium and 23 genes were preferentially expressed in both cambium and xylem (X-C). This large proportion of genes expressed preferentially in vascular tissues confirms that subtractive libraries are a more efficient way to clone tissue-specific genes than are large-scale sequencing methods. Taken together, our ‘xylem vs leaves’ and Xp libraries contain 487 unigenes, of which more than 80% are xylem-preferential genes. In comparison, only 17% of the 13 526 poplar ESTs from wood-related cDNA libraries were shown to be differentially expressed in poplar vascular tissues (Schrader et al., 2004) and 348 secondary-xylem genes were identified in the whole arabidopsis transcriptome by Zhao et al. (2005). The large proportion of ‘no hits’ and unknown genes prefer-entially expressed in xylem also demonstrates that subtractive libraries can be used to identify new genes that are overlooked by large-scale EST projects.
Most interestingly, we identified a clear relationship between functional categories and tissue-expression groups. For instance, the X-C and C groups contained genes whose products belonged to functional categories involved in the early events of xylem differentiation when the main cellular processes are cell division, elongation and biogenesis with primary cell wall remodeling. This could be compared to transcriptome studies that clustered genes according to their expression profiles in the different vascular tissues or during cellular events that occur in xylogenesis. For example, genes encoding ribosomal proteins, which are known to be preferentially expressed in cambium, figured in the X-C and C groups (Sterky et al., 1998; Hertzberg et al., 2001; Schrader et al., 2004). The X-C and C groups also contained two pectin esterases and two XETs shown to be involved in the early stages of xylogenesis in trees (Darley et al., 2001; Hertzberg et al., 2001), as well as a small GTP-binding protein of the Rac family possibly involved in cell elongation through effects on the actin cytoskeleton and intracellular calcium (Fu et al., 2002, 2005; Kim & Triplett, 2004).
The xylem group of genes encoded proteins involved in functional categories such as hormone signaling and metabo-lism, which intervene in all processes of xylogenesis, and in functional categories such as secondary cell wall thickening and proteolysis, processes that play roles in the late steps of xylogenesis (Mellerowicz et al., 2001; Ye, 2002).
The partitioning of the different functional classes of genes between distinct tissue-expression groups supports the theory that the cambium sample contains mainly xylem mother cells and cells at the very early stages of xylogenesis. Consistent with this, the genes in the cambial zone group were similar to those found in the poplar cambium central zone, and in the xylem-side cambial zone described by Schrader et al. (2004), which contains xylem mother cells.
Taken together, the data presented here provide a portfolio of candidate genes for future studies on wood formation. They include genes encoding proteins of known function, some of which likely encode a protein family member that is specifically involved in xylem differentiation, as well as genes whose functions are completely unknown, such as the ‘no hits’ genes. Functional analyses of these genes may reveal new factors and processes involved in wood development, including xylem cell type and morphology, secondary cell wall structure and the chemical structure of the wood fibers. Such studies will not only increase our knowledge of the developmental processes underlying xylogenesis, but also provide useful genetic tools to increase the value of Eucalyptus wood and fibers for industrial use.
Acknowledgements
We thank the Genopole of Toulouse for sequencing and spotting facilities. CF was supported by a grant from the French Ministère de l’Education Nationale, de l’Enseignement Supérieur et de la Recherche.
References
Allona I, Quinn M, Shoop E, Swope K, St Cyr S, Carlis J, Riedl J, Retzel E, Campbell MM, Sederoff R, Whetten RW. 1998. Analysis of
xylem formation in pine by cDNA sequencing. Proceedings of the National
Academy of Sciences, USA 95: 9693–9698.
Andersson-Gunneras S, Hellgren JM, Bjorklund S, Regan S, Moritz T, Sundberg B. 2003. Asymmetric expression of a poplar ACC oxidase
controls ethylene production during gravitational induction of tension wood. The Plant Journal 34: 339 –349.
Biemelt S, Tschiersch H, Sonnewald U. 2004. Impact of altered gibberellin
metabolism on biomass accumulation, lignin biosynthesis, and photosynthesis in transgenic tobacco plants. Plant Physiology 135: 254 –265.
Brown DM, Zeef LA, Ellis J, Goodacre R, Turner SR. 2005. Identification
of novel genes in Arabidopsis involved in secondary cell wall formation using expression profiling and reverse genetics. The Plant Cell 17: 2281– 2295.
Darley CP, Forrester AM, McQueen-Mason SJ. 2001. The molecular basis
of plant cell wall extension. Plant Molecular Biology 47: 179–195.
Demura T, Tashiro G, Horiguchi G, Kishimoto N, Kubo M, Matsuoka N, Minami A, Nagata-Hiwatashi M, Nakamura K, Okamura Y, Sassa N, Suzuki S, Yazaki J, Kikuchi S, Fukuda H. 2002. Visualisation by
comprehensive microarray analysis of gene expression programs during transdifferentiation of mesophyll cells into xylem cells. Proceedings of the
National Academy of Sciences, USA 99: 15794 –15799.
Diatchenko L, Lau Y-FC, Campbell AP, Chenchik A, Moqadam F, Huang B, Lukyanov S, Lukyanov K, Gurskaya N, Sverdlov ED, Siebert PD. 1996. Suppression subtractive hybridisation: a method for
generating differentially regulated or tissue-specific cDNA probes and libraries. Proceedings of the National Academy of Sciences, USA 93: 6025 –6030.
Eriksson ME, Israelsson M, Olsson O, Moritz T. 2000. Increased
gibberellin biosynthesis in transgenic trees promotes growth, biomass production and xylem fiber length. Nature Biotechnology 18: 784 –788.
Fu Y, Gu Y, Zheng Z, Wasteneys G, Yang Z. 2005. Arabidopsis
interdigitating cell growth requires two antagonistic pathways with opposing action on cell morphogenesis. Cell 120: 687–700.
New Phytologist (2006) 170: 739–752 www.newphytologist.org © New Phytologist (2006) No claim to French government works
Research
752
Fu Y, Li H, Yang Z. 2002. The ROP2 GTPase controls the formation of
cortical fine F-actin and the early phase of directional cell expansion during Arabidopsis organogenesis. The Plant Cell 14: 777–794.
Grima-Pettenati J, Feuillet C, Goffner D, Borderies G, Boudet AM. 1993.
Molecular cloning and expression of a Eucalyptus gunnii cDNA clone encoding cinnamyl alcohol dehydrogenase. Plant Molecular Biology 21: 1085 –1095.
Hertzberg M, Aspeborg H, Schrader J, Andersson A, Erlandsson R, Blomqvist K, Bhalerao R, Uhlen M, Teeri TT, Lundeberg J, Sundberg B, Nilsson P, Sandberg G. 2001. A transcriptional roadmap to wood
formation. Proceedings of the National Academy of Sciences, USA 98: 14732 –14737.
Hoffmann L, Besseau S, Geoffroy P, Ritzenthaler C, Meyer D, Lapierre C, Pollet B, Legrand M. 2004. Silencing of hydroxycinnamoyl-coenzyme A
shikimate/quinate hydroxycinnamoyltransferase affects phenylpropanoid biosynthesis. The Plant Cell 16: 1446 –1465.
Hoffmann L, Maury S, Martz F, Geoffroy P, Legrand M. 2003.
Purification, cloning and properties of an acyltransferase controlling shikimate and quinate ester intermediates in phenylpropanoid metabolism. Journal of Biological Chemistry 278: 95 –103.
Kim HJ, Triplett BA. 2004. Characterization of GhRac1 GTPase expressed
in developing cotton (Gossypium hirsutum L.) fibers. Biochimica Biophysica
Acta 1679: 214–221.
Lachaud S, Catesson AM, Bonnemain JL. 1999. Structure and functions
of the vascular cambium. Comptes Rendus de L’académie des Sciences III: 633–650.
Larson PR. 1994. The vascular cambium: development and structure. Berlin,
Germany: Springer-Verlag.
Lorenz WW, Dean JF. 2002. SAGE profiling and demonstration of
differential gene expression along the axial developmental gradient of lignifying xylem in loblolly pine (Pinus taeda). Tree Physiology 22: 301–310.
Mellerowicz EJ, Baucher M, Sundberg B, Boerjan W. 2001. Unravelling
cell wall formation in the woody dicot stem. Plant Molecular Biology 47: 239–274.
Miller NA, Gong Q, Bryan R, Ruvolo M, Turner LA, LaBrie ST. 2002.
Cross-hybridisation of closely related genes on high-density macroarrays.
Biotechniques 32: 620 – 625.
Myburg Z, Potts BM, Marques CMP, Kirst M, Gion JM, Grattapaglia D, Grima-Pettenati J. 2005. Genome mapping and molecular breeding in
Eucalyptus: molecular domestication of a major fiber crop. In: Kole C, ed.
The genomes: a series on genome mapping, molecular breeding and genomics of economic species. Enfield, NH, USA; Plymouth, UK: Science Publishers
Inc. (In press.)
Oh S, Park S, Han KH. 2003. Transcriptional regulation of secondary
growth in Arabidopsis thaliana. Journal of Experimental Botany 54: 2709–2722.
Oparka KJ, Turgeon R. 1999. Sieve elements and companion cells – traffic
control centers of the phloem. The Plant Cell 11: 739–750.
Paux E, Carocha V, Marques C, Mendes de Sousa A, Borralho N, Sivadon P, Grima-Pettenati J. 2005. Transcript profiling of Eucalyptus
xylem genes during tension wood formation. New Phytologist 167: 89–100.
Paux E, Tamasloukht M, Ladouce N, Sivadon P, Grima-Pettenati J. 2004.
Identification of genes preferentially expressed during wood formation in Eucalyptus. Plant Molecular Biology 55: 263 –280.
Pfaffl MW. 2001. A new mathematical model for relative quantification in
real-time RT-PCR. Nucleic Acids Research 29: 2002–2007.
Sambrook J, Fritsch EF, Maniatis T. 1989. Molecular cloning: a laboratory
manual, 2nd edn. New York, NY, USA: Cold Spring Harbor Laboratory
Press.
Schoof H, Zaccaria P, Gundlach H, Lemcke K, Rudd S, Kolesov G, Arnold R, Mewes HW, Mayer KF. 2002. MIPS Arabidopsis thaliana
Database (MAtDB): an integrated biological knowledge resource based on the first complete plant genome. Nucleic Acids Research 30: 91–93.
Schrader J, Nilsson J, Mellerowicz EJ, Berglund A, Nilsson P, Hertzberg M, Sandberg G. 2004. A high-resolution transcript profile
across the wood-forming meristem of poplar identifies potential regulators of cambial stem cell identity. The Plant Cell 16: 2278 –2292.
Southerton SG, Marshall H, Mouradov A, Teasdale RD. 1998. Eucalypt
MADS-box genes expressed in developing flowers. Plant Physiology 118: 365 –371.
Sterky F, Bhalerao RR, Unneberg P, Segerman B, Nilsson P, Brunner AM, Charbonnel-Campaa L, Lindvall JJ, Tandre K, Strauss SH, Sundberg B, Gustafsson P, Uhlen M, Bhalerao RP, Nilsson O, Sandberg G, Karlsson J, Lundeberg J, Jansson S. 2004. A Populus EST resource for
plant functional genomics. Proceedings of the National Academy of Sciences,
USA 101: 13951–13956.
Sterky F, Regan S, Karlsson J, Hertzberg M, Rohde A, Holmberg A, Amini B, Bhalerao R, Larsson M, Villarroel R, Van Montagu M, Sandberg G, Olsson O, Teeri TT, Boerjan W, Gustafsson P, Uhlen M, Sundberg B, Lundeberg J. 1998. Gene discovery in the wood-forming tissues of poplar:
analysis of 5,692 expressed sequence tags. Proceedings of the National
Academy of Sciences, USA 95: 13330 –13335.
Vilaine F, Palauqui JC, Amselem J, Kusiak C, Lemoine R, Dinant S. 2003.
Towards deciphering phloem: a transcriptome analysis of the phloem of
Apium graveolens. The Plant Journal 36: 67– 81.
Whetten R, Sun YH, Zhang Y, Sederoff RR. 2001. Functional genomics
and cell wall biosynthesis in loblolly pine. Plant Molecular Biology 47: 275–291.
Xiong L, Lee M, Qi M, Yang Y. 2001. Identification of defense-related rice
genes by suppression subtractive hybridization and differential screening.
Molecular Plant Microbe Interactions 14: 685 – 692.
Ye ZH. 2002. Vascular tissue differentiation and pattern formation in plants.
Annual Review in Plant Biology 53: 183 –202.
Zhao C, Craig JC, Petzold HE, Dickerman AW, Beers EP. 2005. The xylem
and phloem transcriptomes from secondary tissues of the Arabidopsis root-hypocotyl. Plant Physiology 138: 803 – 818.
Supplementary Material
The following supplementary material is available for this article online.
Table S1 List of the 295 unigenes spotted onto the arrays Table S2 Mean signal intensities for xylem, phloem, cambium
and leaf probes on the Xp unigenes macroarray
Table S3 Group of xylem-preferentially expressed unigenes Table S4 Group of cambium preferentially expressed unigenes Table S5 Group of xylem and cambium preferentially
expressed unigenes
This material is available as part of the online article from http://www.blackwell-synergy.com