https://doi.org/10.4224/17712915
READ THESE TERMS AND CONDITIONS CAREFULLY BEFORE USING THIS WEBSITE.
https://nrc-publications.canada.ca/eng/copyright
Vous avez des questions? Nous pouvons vous aider. Pour communiquer directement avec un auteur, consultez la
première page de la revue dans laquelle son article a été publié afin de trouver ses coordonnées. Si vous n’arrivez pas à les repérer, communiquez avec nous à [email protected].
Questions? Contact the NRC Publications Archive team at
[email protected]. If you wish to email the authors directly, please see the first page of the publication for their contact information.
NRC Publications Archive
Archives des publications du CNRC
For the publisher’s version, please access the DOI link below./ Pour consulter la version de l’éditeur, utilisez le lien DOI ci-dessous.
Access and use of this website and the material on it are subject to the Terms and Conditions set forth at
Frictional stress formulation for solid-liquid two-phase flows
Sayed, Mohamed; Dabros, Tadek
https://publications-cnrc.canada.ca/fra/droits
L’accès à ce site Web et l’utilisation de son contenu sont assujettis aux conditions présentées dans le site LISEZ CES CONDITIONS ATTENTIVEMENT AVANT D’UTILISER CE SITE WEB.
NRC Publications Record / Notice d'Archives des publications de CNRC:
https://nrc-publications.canada.ca/eng/view/object/?id=52199b65-4340-4441-9dcb-483ebbbb1290 https://publications-cnrc.canada.ca/fra/voir/objet/?id=52199b65-4340-4441-9dcb-483ebbbb1290
Frictional Stress Formulation for Solid-Liquid Two-PhaseFlows
Mohamed Sayed and Tadek Dabros
DRAFT
Technical Report CHC-PR-072
Frictional Stress Formulation for Solid-Liquid Two-Phase
Flows
Mohamed Sayed
Canadian Hydraulics Centre
National Research Council of Canada Ottawa, Ontario Tadek Dabros NRCanENERGY Devon, Alberta Technical Report CHC-PR-072 April 2010
ABSTRACT
A formulation of the frictional stress for flowing granular materials is presented. The objective is to provide a model for the frictional stresses which is suitable for solids-liquid, two-phase flows. The new formulation overcomes the main problem facing two-phase modeling that involves granular materials; namely the ability to account for stagnant regions where the granular phase remains at rest. That behaviour is encountered in several applications such as deposition of tailings and transport of slurries in pipes.
The formulation accounts for differing behaviour between contracting and expanding bulk granular materials. This contrasts the familiar approaches which are based on a critical state assumption. The formulation is tested against experimental measurements of passive earth pressure. The comparison shows that the representation of material convergence (or divergence) is key to reproducing the appropriate behaviour. The comparison with experimental data also provides estimates for the values of material properties that are used in the formulation. Additional test cases addressing single-phase solids flow through bins and the formation of granular heaps are also carried out. Those tests illustrate that the formulation produces expected flow patterns.
ii CHC-PR-072
TABLE OF CONTENTS
1. INTRODUCTION ... 1
2. THE Frictional Stresses ... 2
2.1 The Governing Equation ... 2
2.2 Numerical Implementation... 5
3. TESTS OF PASSIVE EARTH PRESSURE... 5
4. FLOW THROUGH BINS... 11
5. CONCLUSION... 14
6. ACKNOWLEDGEMENTS ... 15
TABLE OF FIGURES
Figure 1: Yield envelopes for two-dimensional deformation, φ = 300. ...5 Figure 2: Measured stress distribution (reproduced from Fang et al., 1993).6 Figure 3: Measurefd Coefficient of Passive Earth Pressure. ...7 Figure 4: The coefficient of passive earth pressure for different values of
the parameter c’. ...8 Figure 5: Horizontal normal stress distribution over depth. ...9 Figure 6: The yield envelope for the case of c’ = 0.5 and n = 5...10 Figure 7: The coefficient of passive earth pressure for different values of
the parameter n. The case of critical state model is also included. ...10 Figure 8: Contour plots of the solids volume fraction for tests of flow
though through a bin; Time= 3.5 s. ...12 Figure 9: velocity vectors for the present model of the frictional stress and
the critical state model; time= 3.5 s...13 Figure 10: Mean velocity at the aperture of the bin. ...14
Frictional Stress Formulation for Solid-Liquid Two-Phase Flows
1. INTRODUCTION
Several two-phase flows of solids-liquids systems involve slow deformation or formation of stagnant regions of bulk granular materials. Such flows concern, for example, settling of tailings, deposition of solids in pipes, solids discharge through bins, and the formation of solids heaps. This behaviour poses a major difficulty to two-phase models. The main challenge remains to be modeling of the stresses within the granular phase for slow or stagnant regions.
Granular stresses are commonly considered to be the sum of two parts. The first part represents the frictional or quasi-static stress that arises due to inter-particle surface friction and interlocking. The second part accounts for the dynamic stresses that arise due to collisions between fast flowing particles. The present work focuses on evaluating and testing of an expression for the frictional stresses in the granular phase.
The frictional granular stresses are usually assumed to follow a plastic yield condition. See, for example, Tardos (1997) for a discussion of the subject. The bulk granular material deforms once the yield condition is reached, and the stresses remain independent of the magnitude of the velocity. An associated flow rule is also adopted, which requires the coincidence of the directions of the principal stresses and strain rates. For the yield condition, Mohr-Coulomb criterion is universally accepted. It relates the shear strength of the bulk material to the pressure (mean normal stress). A model for such friction stresses was proposed by Schaefer (1987), and further developed by Tardos (1997), Savage (1998), and Srivasta and Sundaresan (2003).
The formulation of the frictional stresses has many common features with those used in soil mechanics (e.g. Schofield and Roth, 1968). The main difference relates to the magnitude of the deformation. Soil mechanics problems are mainly concerned with small deformations. The soils are modeled as elastic-plastic materials, with emphasis on the elastic strains and the stress path to the yield envelope. For flowing granular materials deformations are very large. The models approximate the rigid-plastic behaviour with a viscous plastic deformation. Soil mechanics models also encompass the concept of critical state and include detailed treatment of the dilation and compaction of the bulk material. The treatment of flowing granular materials lags in the latter respect. Current practices usually imply that the material is at the critical state.
The models of Tardos (1997) and Srivasta and Sundaresan (2003) depart from that common practice. They account for the role of compactness of the bulk material on the yield stresses. Their formulations include the effects of dilation of tightly packed materials and compaction of loosely packed materials.
The present work tests a formulation for the frictional stress that follows the model of Srivasta and Sundaresan (2003). The model is verified using the experimental measurements of passive earth pressure of Fang et al. (1994). The objective is to examine the implementation, validation and performance of the model. The testing also determines the role of bulk material’s dilation or compaction. Following the validation, tests of granular flows through bins are carried out. Those tests are intended to qualitatively illustrate the ability of the model to handle problems of interest to handling and processing of tailings and oil sands.
This report will list the governing equations that describe the frictional stresses. The numerical approach used in the test is next briefly discussed. Validation against the experimental measurements of passive earth pressure follows. Finally, example illustrating modeling of flow through bins are given.
2. THE Frictional Stresses
2.1 The Governing Equation
We consider here single phase flow of bulk granular materials. Thus, the conservation of mass and linear momentum can be written as
(
)
0 = ⋅ ∇ + ρ ν v ν ρ s s t d d (1) g σ v ρ ν ν ρs s t d d + ⋅ ∇ − = ⎥ ⎦ ⎤ ⎢ ⎣ ⎡ (2)where ν is volume fraction of the solids, ρs is the solids density, v is the
velocity, σ is the stress tensor, and g is the gravitational acceleration.
A general form of the stress-strain rate relationship that can satisfy the rigid-plastic behaviour can be expressed as
(
)
ij ij ij A p pδ ε ν σ − Δ = • , 2 (3)where σij is the stress tensor,
• ij
ε is the strain rate tensor, and p is the pressure. The strain rate Δ is given by
• • • • • • • • • • • + + + ⎟ ⎠ ⎞ ⎜ ⎝ ⎛ − + ⎟ ⎠ ⎞ ⎜ ⎝ ⎛ − + ⎟ ⎠ ⎞ ⎜ ⎝ ⎛ − = = Δ 12 23 13 2 33 11 2 33 22 2 22 11 2 2 3 1 3 1 3 1 ε ε ε ε ε ε ε ε ε ε εij ij (4)
Obviously there is a singularity for the case of zero strain rates. The numerical implementation must include a small minimum value for Δ. That value should be sufficiently small to ensure that the flow is plastic. Any viscous flow (for near zero strain rates) should be negligible.
The function A(p, ν) is chosen to satisfy the yield condition (Schaeffer, 1987). The formulation of Srivasta and Sundaresan (2003) gives expressions for the pressure and the function A as follows. At the critical
state, the bulk material deforms without undergoing volume change, and
the pressure would be given by
( )
ν νν ν ν − − = max min C pc (5)where νmin is a minimum solids volume fraction below which the pressure vanishes, and νmax is the solids volume fraction that corresponds to
maximum packing. The constant C can be taken as C = k ρs gL, where L is a length scale for the problem under consideration. The non-dimensional parameter k would represent a stiffness of the bulk material.
For cases where the material undergoes volume change, the pressure p is related to the critical state pressure pc by
1 1 sin 2 1 − ⎥ ⎦ ⎤ ⎢ ⎣ ⎡ Δ ⋅ ∇ − = n c n p p ϕ v (6)
The parameter n influences the shape of the yield envelope, and φ is the traditional angle of internal friction. Equations (6) shows that when the bulk material dilates, the divergence is positive (∇⋅v >0), and the pressure is smaller than the critical state pressure (p<pc). For bulk material undergoing compression, the divergence becomes negative, and the pressure would be larger than that of the critical state (p>pc).
The expression for the function A(p, ν) is
(
)
⎥ ⎥ ⎥ ⎦ ⎤ ⎢ ⎢ ⎢ ⎣ ⎡ ⎟⎟ ⎠ ⎞ ⎜⎜ ⎝ ⎛ − − = −1 1 1 sin n c p p n n p A ϕ (7)The yield envelope given by Equations (3) to (7) can be represented graphically by plotting the normalized principal stresses. Figure 1 shows yield envelopes for two-dimensional deformation for a value of the angle of internal friction φ = 300. The plots show the principal stresses, S1 and S2, divided by the critical state pressure pc for different values of the parameter n. Srivasta and Sundaresan (2003) indicated that n= 1.73 ensures that stresses are always compressive. For other values of n, we introduced a tension cut-off by adjusting the value of A (when tension is encountered).
At the critical state, no volume change takes place, and the yield condition reduces to the linear Mohr-Coulomb criterion. The pressure would be equal to the critical value (p=pc), and the yield function becomes A= psinϕ. The critical state appears as a single point on the plots in Fig. 1. Stresses higher than the critical values correspond to compaction, while lower stresses correspond to dilation.
Figure 1: Yield envelopes for two-dimensional deformation, φ = 300.
2.2 Numerical Implementation
The emphasis of the present work is on testing the formulation of frictional granular stresses. Numerical solution of the governing equations could be achieved using a variety of approaches. The present solution employs a solver that was used earlier by Levy and Sayed (2008). The solution is based on a hybrid Lagrangian-Eulerian approach. Advection is modeled using a Particle-In-Cell (PIC) method, where an ensemble of particles represents the bulk granular material. The particles may be viewed as moving nodes that hold the various material attributes and variables such as the solids volume fraction and the velocity. The particles are advected in a Lagrangian manner.
The momentum equations are solved on a fixed Eulerian grid to determine the strain rates, stresses, accelerations and velocities. The continuity equation, however, is solved over the particles. The various variables are mapped between the particles and the grid each time step. An adequate description of the PIC approach is beyond the scope of this report. For a rigorous discussion of the PIC approach, see for example Sulsky et al (1994). The PIC method was also used by Wieckowski et al. [9] for modeling granular flow in hoppers.
3. TESTS OF PASSIVE EARTH PRESSURE
Passive earth pressure refers to the stresses that develop during yield of soils under lateral compression. The horizontal stresses are larger than the vertical stresses generated by gravity. The subject has been extensively studied in geotechnical engineering literature (e.g. Scott, 1963). The coefficient of passive earth pressure, kp, is calculated as the ratio of the horizontal to vertical mean normal stresses. For a material deforming at the critical state (following a linear Mohr-Coulomb yield criterion),
ϕ ϕ sin 1 sin 1 − + = p k (8)
In practice, however, a range of values for kp is often observed, which departs from Eq. (8). The value of is evidently sensitive to the dilation or compression of the bulk material. Moreover, the simple geometry and
availability of reliable measurements make it suitable for testing of model performance.
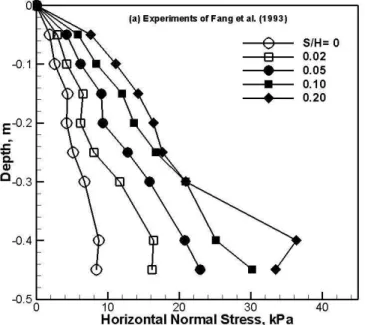
Fang et al. (1993) reported on detailed measurements of passive earth pressures against flat walls. They measured stress distributions and displacements of a rigid vertical wall. The tests were done using a rigid container of rectangular cross-section, 2 m long and 1 m wide. Soil was placed to a depth, H = 0.5 m. The test case used for comparison with the present model corresponds to translation of one vertical wall at a rate of 0.27 mm/s along the length of the container. The unit weight of the soil was 15.5 kN/m3, and the angle of internal friction was 30.90.
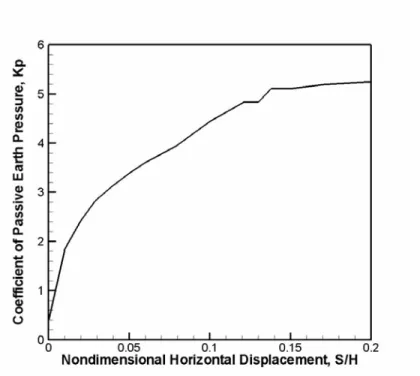
Figure 2 shows the experimental measurements (Fang et al., 1993) of the stress distribution on the vertical moving wall at several values of the non-dimensional displacement, S/H. Fang et al. (1993) also presented their results in the form of values of the coefficient of passive earth pressure, Kp
, which are shown in Figure 3. That coefficient is defined as the horizontal force divided by γH2/2, where γ is the initial unit weight of the soil.
Figure 3: Measurefd Coefficient of Passive Earth Pressure.
Numerical simulations were done for the geometry and boundary displacements of the experiments. The initial solids volume fraction was 0.525. Material properties were represented by a solids bulk density, ρs, of
3000 kN/m3 and an angle of internal friction, ϕ = 310. The numerical solution was done using a rectangular grid of 0.02 m cells, and a time step of 10-4 s. The tests examined the role of the parameter n, and the performance of the present model (versus the critical state assumption).
For the pressure- solids volume content relationship (Eq. 5), the values of the maximum and minimum solids volume fractions are νmax = 0.64 and νmin = 0.4.
The parameter C (where C = c’ ρs gL ) is calculated using the following values: L= 1m, ρs = 3000 kg/m3. A range of values for c’ was tested. The resulting stresses and modes of deformation are sensitive to the value of this parameter. If the value of c’ is too high, the material would be jammed between the horizontal plates and unrealistically high stresses develop. Naturally, the initial solids volume fraction plays a role.
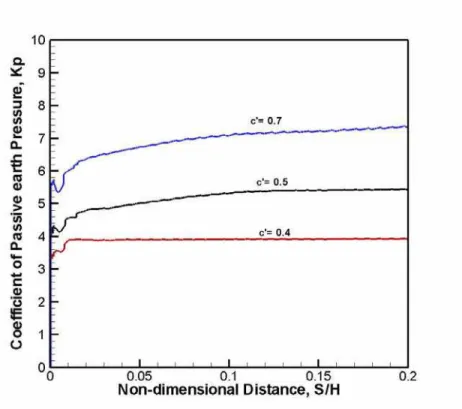
Figure 4: The coefficient of passive earth pressure for different values of the parameter c’.
The initial value of ν = 0.53 was used in the present tests. It was found that values of k up to 0.7 produced a reasonable deformation and build-up of the stresses. Several values of k and n were tested. For n= 5, plots of the coefficient of earth pressure, Kp are shown in Figure 4 for three values of c’
of 0.4, 0.5 and 0.7. The value of Kp corresponding to c’= 0.5 is close to the
experimental measurements. The predicted Kp increases relatively quickly
with deformation to reach a steady value. The experimental measurements show that the build-up of Kp is more gradual. The pre-yield behaviour is
not included in the present formulation. it is, therefore, expected that the numerical solution reaches plastic yield conditions without accounting for elastic deformations that may take place prior to the plastic flow.
The normal stress distribution along the depth is shown in Figure 5 for (for
c’= 0.5 and n=5). The stresses again show agreement with the maximum
values of the experimental measurements. The measured gradual build-up of the stress is not reproduced by the present model. The yield envelope for this case is shown in Figure 6. The principal stresses from every cell in the computational grid are plotted in Fig. 6. The plots indicate that parts of the bulk material undergo compaction, with stresses exceeding the those of the critical state.
Figure 5: Horizontal normal stress distribution over depth.
The effect of n is shown by plotting Kp versus non-dimensional
displacement in Figure 7. The results for the critical state (linear Mohr-Coulomb) solution are also plotted in Figure 7. The latter case predicts values of Kp that approache the theoretical value (Eq. 8). Figure 7 indicates
that the value of Kp , and the stresses, increase with decreasing values of
n. Figure 7 also shows that the critical state solution cannot adequately
Figure 6: The yield envelope for the case of c’ = 0.5 and n = 5.
Figure 7: The coefficient of passive earth pressure for different values of the parameter n. The case of critical state model is also included.
The preceding results show that the present model of the frictional stress can predict values of the coefficient of passive earth pressure that are in
agreement with experimental measurements. Evidently, the traditional use of a critical state formulation (linear Mohr-Coulomb criterion) cannot predict those values. The present tests represent a situation where the bulk material undergoes considerable compaction. Accounting for compaction and dilation, which an essential part of the present model, becomes essential for proper simulation of the behaviour of the bulk granular material.
4. FLOW THROUGH BINS
Patterns of flow through bins are representative of many situations in the processing and transport of bulk solids. Parkash and Rao (1988) have shown that stresses are mostly frictional inside hoppers (and bins). The collisional stresses become significant only at the aperture. This problem is thus suitable for testing the stress formulation.
Tests were done to illustrate the potential differences between the present model and the critical state formulation. A case of two-dimensional, 0.5 m wide bin with a 0.1 m aperture width is considered. The value of φ is taken as 200.
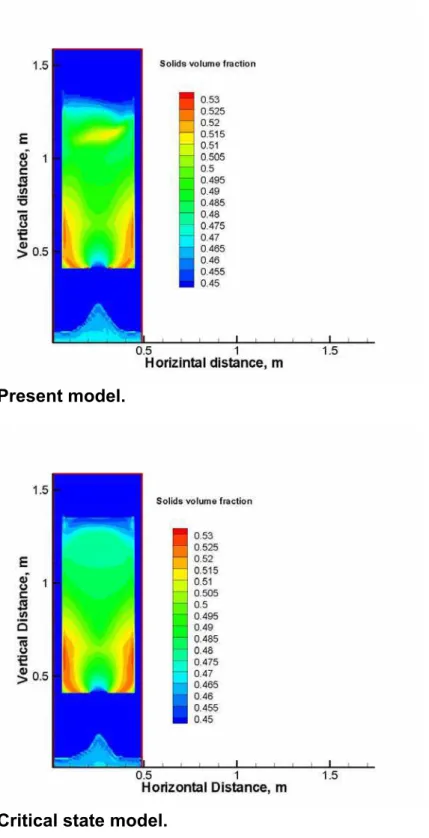
Results of two cases are shown here. The first uses the present frictional stress model with n = 5. The second case employs the critical state formulation. The resulting contour plots of the solids volume fraction are shown in Figure 8a and 8b. Both cases appear to give very close results. The velocity vectors for the two cases are shown in Figures 9a and 9b. They are also very similar. It is noted that velocities disappear within the corners of the bin to form stagnant zones. Srivasta and Sundaresan (2003) included additional terms in the expression for the frictional stress, which involve the granular temperature (or velocity fluctuations). They found that those terms prevented the formation of such stagnant zones.
Figure 10 shows plots of the mean velocity at the aperture for both cases. The present model evidently produces slightly higher velocities, particularly in the early stages of the test. The differences are too small, however, to establish whether the present formulation produces better agreement with experiments. We note that these are cursory tests aimed to illustrate performance of the model. A thorough parametric study and comparison with experiments is beyond the scope of the present report.
Present model.
Critical state model.
Figure 8: Contour plots of the solids volume fraction for tests of flow though through a bin; Time= 3.5 s.
The present model.
The critical state model.
Figure 9: velocity vectors for the present model of the frictional stress and the critical state model; time= 3.5 s.
Figure 10: Mean velocity at the aperture of the bin.
5. CONCLUSION
This report has examined a formulation of the frictional stresses for bulk granular materials that follows the model of Srivasta and Sundaresan (2003). The formulation accounts for the dilation and compaction of the material. This contrasts the widely used formulation that is based on a critical state assumption. In the present formulation, a tightly packed material dilates during deformation and the pressures would be lower than the critical values. Conversely, a loose material compacts during deformation and the pressure becomes larger than that of the critical state. Testing of the model focused on the case of passive earth pressure, where the material undergoes relatively large degree of compaction. It was shown that a critical state formulation predicts values of the coefficient of passive earth pressure that are significantly different from experimental measurements. The tests verified that the present formulation can reproduce the measured values of that coefficient. The present model for that test case showed substantially improved results beyond those based on the critical state assumption.
Tests also examined the flow of granular materials through bins. The cursory tests showed that the present model produces results that are close to those obtained using the critical state model. The reason for the
agreement between the two models could be attributed to relatively limited volume changes. Apparently, the bulk material does not experience substantial volume changes in this case.
It may, therefore, be concluded that the present formulation would be necessary for cases involving relatively large volume changes (e.g. compaction). Models based on the critical state assumptions may not be adequate for such cases.
The present study is a first step in the examination of two-phase, solids-liquid systems. The following step will employ the present frictional stress model in a two-phase flow formulation.
6. ACKNOWLEDGEMENTS
The financial support of the Program on Energy Research and Development (PERD) is gratefully acknowledged.
7. REFERENCES
Fang, Y-S., Chen, T-J., Wu, B-F. (1993). « Passive earth pressure with various wall movements,” ASCE Journal of Geotechnical Engineering, Vol. 120 (8), pp. 1307-1323. (1993)
Levy, A. and Sayed, M. (2008). “Numerical simulations of the flow of dilute granular materials around obstacles,” Powder Technology, Vol. 181, pp. 137-148.
Parakash, J. R., and Rao, K. K. (1988). “Steady compressible flow of granular materials through a wedge-shaped hopper: the smooth wall, radial gravity problem,” Chem. Eng. Sci., Vol. 43 , pp. 479-494.
Savage, S.B. (1998). “Analyses of slow high-concentration flows of granular materials, “ J. Fluid Mech., Vol. 377, pp. 1-26.
Schaeffer, D.G. (1987). “Instability in the evolution equations describing incompressible granular flow,” J. Diff. Equ, Vol. 66, pp. 19-50.
Srivastava, A., Sundaresan, S. (2003) “Analysis of a frictional-kinetic model for gas-particle flow,” Powder Technology, Vol. 129 (1-3), pp. 72-85.
Sulsky, D., Zhou, S-J., Schreyer, H.L. (1995). “Application of a particle-in-cell method to solid mechanics,” Computer Physics Communications, Vol. 87, pp. 236-252.
Tardos, G.I. (1997). “A fluid mechanistic approach to slow frictional flow of powders,” Powder Technology, Vol. 92 (1), pp. 61-74.
Z. Wieckowski, The material point method in large strain engineering problems, Comput. Methods Appl. Mech. Engng. 193 (2004) 4417-4438.