Publisher’s version / Version de l'éditeur:
Vous avez des questions? Nous pouvons vous aider. Pour communiquer directement avec un auteur, consultez la
première page de la revue dans laquelle son article a été publié afin de trouver ses coordonnées. Si vous n’arrivez pas à les repérer, communiquez avec nous à PublicationsArchive-ArchivesPublications@nrc-cnrc.gc.ca.
Questions? Contact the NRC Publications Archive team at
PublicationsArchive-ArchivesPublications@nrc-cnrc.gc.ca. If you wish to email the authors directly, please see the first page of the publication for their contact information.
https://publications-cnrc.canada.ca/fra/droits
L’accès à ce site Web et l’utilisation de son contenu sont assujettis aux conditions présentées dans le site LISEZ CES CONDITIONS ATTENTIVEMENT AVANT D’UTILISER CE SITE WEB.
2014 IEEE 11th International Symposium on Biomedical Imaging (ISBI), pp.
101-104, 2014-04
READ THESE TERMS AND CONDITIONS CAREFULLY BEFORE USING THIS WEBSITE. https://nrc-publications.canada.ca/eng/copyright
NRC Publications Archive Record / Notice des Archives des publications du CNRC :
https://nrc-publications.canada.ca/eng/view/object/?id=8d7b88f8-5f56-4f19-b277-fbf8d436a97a
https://publications-cnrc.canada.ca/fra/voir/objet/?id=8d7b88f8-5f56-4f19-b277-fbf8d436a97a
NRC Publications Archive
Archives des publications du CNRC
This publication could be one of several versions: author’s original, accepted manuscript or the publisher’s version. / La version de cette publication peut être l’une des suivantes : la version prépublication de l’auteur, la version acceptée du manuscrit ou la version de l’éditeur.
For the publisher’s version, please access the DOI link below./ Pour consulter la version de l’éditeur, utilisez le lien DOI ci-dessous.
https://doi.org/10.1109/ISBI.2014.6867819
Access and use of this website and the material on it are subject to the Terms and Conditions set forth at
Automatic detection of microaneurysms and haemorrhages in fundus
images using dynamic shape features
Séoud, Lama; Faucon, Timothée; Hurtut, Thomas; Chelbi, Jihed; Cheriet,
Farida; Langlois, J.M. Pierre
AUTOMATIC DETECTION OF MICROANEURYSMS AND HAEMORRHAGES IN FUNDUS
IMAGES USING DYNAMIC SHAPE FEATURES
Lama S´eoud
⋆†, Timoth´ee Faucon
†, Thomas Hurtut
⋆∓, Jihed Chelbi
†, Farida Cheriet
⋆, J.M. Pierre Langlois
⋆⋆
Polytechnique Montr´eal, Canada
†Diagnos Inc., Brossard, Canada
∓Universit´e Paris Descartes, Paris, France
ABSTRACT
This paper presents a novel approach for automatic detec-tion of microaneurysms and haemorrhages in fundus images. First, it begins with a preprocessing stage for shade correc-tion, contrast enhancement and denoising. Second, all re-gional minima with sufficient contrast are extracted and con-sidered as candidates. Third, in an image flooding scheme, a new set of dynamic shape features is computed as a function of intensity. Finally, a Random Forest classifies the candi-dates into lesions and non lesions. A set of 143 fundus im-ages with an average of 2210 pixels in diameter was acquired using different cameras and used for training and testing. The proposed approach achieved a global score over the FROC curve of 0.393, while previous work with images of similar resolution reported a score of 0.233.
Index Terms— Image processing, features extraction, computer aided detection, fundus images.
1. INTRODUCTION
Diabetic retinopathy (DR) is the leading cause of preventable blindness in the working-age population [1]. Early detection, together with appropriate treatment, can help prevent visual impairment. In current diagnostic procedure, a retina special-ist analyzes fundus images and visually identifies lesions such as microaneurysms (MA) and heamorrhages (HM). The grade of DR depends mainly on the location, number and type of le-sions. With the increasing number of diabetic patients, com-puter aided detection systems are becoming essential for DR screening and grading [2]. It adds more objectivity and repro-ducibility to the task and it accelerates the process.
Several methods for red lesions detection are proposed in the literature [3–7]. The most popular approach consists in candidate extraction followed by region classification. Once a candidate is identified, a region growing [4, 5] is performed to find its boundaries. Shape and color features are then com-puted and used for classification. A major limitation is that the features extracted are consequently highly dependent on the edges found by region growing.
Most of the papers focus mainly on the detection of MAs [3–7]. Because of their regular small circular shape, MAs can be detected or at least enhanced using 2D gaussian match filtering [3, 6] or through local rotation cross-section profile analysis [7]. However, even though MAs are considered as a critical component for DR screening, DR grading requires also the detection of HMs. By using the top-hat filter to re-move connected components larger than the structuring ele-ment [4, 5], vessels as well as larger HMs are removed and thus missed in subsequent processing.
Several methods proposed in the literature have been built and validated on a common publicly available dataset, the retinopathy online challenge dataset [8]. The reported scores vary between 0.206 and 0.434 [7] depending on the detec-tion algorithm. Unfortunately, the images of this dataset have a resolution much smaller than the one provided by most of the up-to-date retinographs. According to [9], a resolution of 50 pixels per degree of field of view (FOV) is needed to provide diagnostic power comparable to film-based images. Thus, for a45oFOV, images must have about 2250 pixels on
the diameter of the region of interest (ROI), while images of the retinopathy online challenge only have about 540 pixels. Only Lazar et al. [7] considered images with 2200 pixels in diameter for the validation of their detection algorithm, they reported a score of 0.233.
In this paper, a novel approach for the detection of MAs and HMs in high resolution fundus images is proposed and validated. It introduces a novel set of dynamic shape features used for region classification. It is motivated by the fact that the shape of a candidate region depends highly on the inten-sity threshold for which the region is defined.
2. METHOD
The proposed approach is divided into four steps, each of which will be detailed in the following subsections.
2.1. Image preprocessing
A shade correction is performed to remove variations in the background illumination. A mean filter of size401 × 401 is applied to the input image and the result is then subtracted
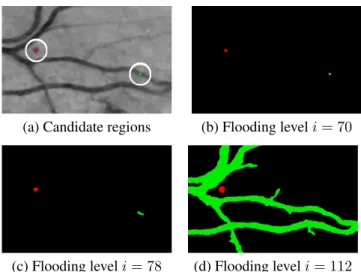
(a) Candidate regions (b) Flooding leveli = 70
(c) Flooding leveli = 78 (d) Flooding leveli = 112 Fig. 1. Morphological flooding of image (a) with 2 can-didate regions encircled in white: R1 (in red) and R2 (in green). Subfigures (b), (c) and (d) show the resulting catch-ment basinsCR1
i (in red) andC R2
i (in green) for i = 70,
i = 78 and i = 112, respectively.
from the image. The resulting image is notedIsc. Contrast
enhancement is achieved by stretching and clipping the green histogram ofIsc on the range µ ± 3σ, where µ and σ are
the mean and standard deviation, respectively, ofIsc’s green
channel. The green channel is considered because of the high contrast it offers around the lesions. Finally, a7 × 7 median filter is applied to remove and attenuate the noise resulting from the acquisition and compression steps. The final prepro-cessed image is notedIp.
2.2. Candidate extraction
To locate potential red lesions, all regional minima ofIpare
identified. A regional minimum is defined as a group of con-nected pixels with same intensityh, such that all its adjacent pixels have strictly higher intensities [10].
Then, two criteria are applied. First, only minima that are darker thanIp’s mean intensity are considered. Second,
only minima with a contrast superior to a thresholdK are retained. In a topographic representation ofIp, the contrast of
a minimumM is defined as the difference in altitude between M and the highest point of the paths reaching a minimum with lower intensity [11]. The advantage of this definition of contrast is that it is independent on the size and shape of the structure. All remaining minima constitute candidate regions. 2.3. Features extraction
Extracted candidates include red lesions, vessel segments and the fovea. A candidate classification step is required to dis-criminate between lesions and non lesions. A new set of fea-tures is thus proposed in this subsection.
In a topographic representation of Ip, each candidate (a
regional minimum) corresponds to a water source, notedRj.
Fig. 2. Solidity curves (in solid lines) for the two candidate regionsR1(in red) andR2 (in green) of Fig. 1. The slopes (0.05 and -1.92) and the intercepts (86 and 206.43) of the lin-ear least-square fits (dashed lines) are examples of DSFs.
A morphological flooding, inspired from the watershed algo-rithm, is applied toIp starting from the lowest water source
and ending when Ip’s mean intensity is reached. At each
flooding leveli, pixels that are adjacent to a water source Rj
and lower than the flooding leveli are added to the catchment basin ofRj, notedC
Rj
i . When two basins merge, they start
to share the same pixels and thus the same attributes. Fig. 1 illustrates three flooding steps with two candidates taken from a single image. The first candidate, notedR1and coloured in red, corresponds to a true MA, and the second one, notedR2and coloured in green, corresponds to a vessel
segment. Throughout the image flooding,R2starts as a small
compact shape, it then turns into an elongated shape, and fi-nally, it merges with adjacent candidate to form the vessel network. Whereas,R1grows more isotropically and remains
isolated from other candidates even for higher flooding levels. At each flooding leveli, for each candidate region Rj, 7
shape attributes are computed on the catchment basinCRj
i :
1. Area: number of pixels in CRj
i , divided by the total
number of pixels in the ROI.
2. Number of collisions: number of catchment basins merged intoCRj
i .
3. Elongation: 1 − W/L with W and L the width and length respectively of the bounding box of CRj
i
ori-ented along its major axis. 4. Excentricity:p(L2− W2)/L2.
5. Circularity: ratio of the area of CRj
i over its squared
perimeter and divided by1/4π.
6. Rectangularity: ratio of the area ofCRj
i over the area
of its bounding box oriented along its major axis. 7. Solidity: ratio of the area of CRj
i over the area of its
convex hull.
For each candidate region, a total of 7 curves are obtained, one for each shape attribute. Each curve corresponds to an
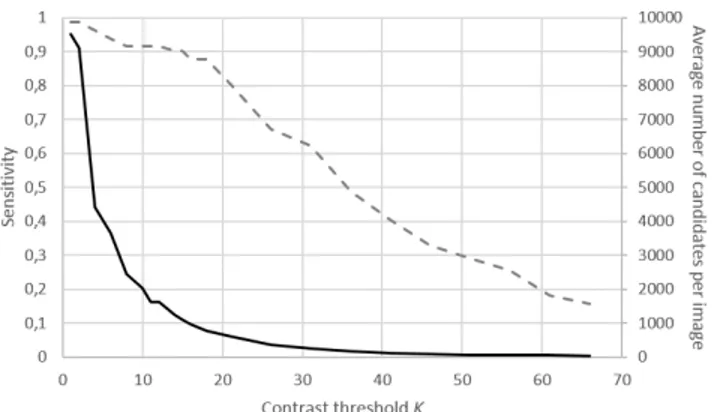
Fig. 3. Sensitivity (dashed line) and average number of candi-dates per image (solid line) as functions of the contrast thresh-oldK.
attribute’s value as a function of the flooding leveli, from the minimum valuehRj toIp’s mean intensity. Fig. 2 shows the
solidity curves obtained for candidatesR1(in red) andR2(in
green) illustrated in Fig. 1. In this example, the image’s mean intensity is 114, andhR1 = 70 and hR2 = 66.
Each curve is then represented as a vector of 5 dynamic shape features (DSF). The first three are the slope, intercept and root mean squared error of a linear least-square fit of the curve. The last two are the mean and median of the attribute’s values along the curve. In total,7 × 5 = 35 DSFs are com-puted for each candidate region. Color information is added to the resulting feature vector as 5 separate static features: the RGB values of the regional minima computed onIsc, its
in-tensityh in Ip, and its contrast inIp, previously calculated
according to [11]. In Fig. 2, the linear least-square fits of the solidity curves are represented as dashed lines and the values of two DSFs (the slope and intercept) are shown.
2.4. Classification
To distinguish between lesions and non lesions, we consid-ered a Random Forest (RF) classifier [12]. It is robust to im-balanced training data and incorporates an implicit features selection step. An RF is a combination ofT decision trees trained independently using T bootstrap samples from the training set. Each node is split using the best ofm features randomly chosen at that node. The output probability of a candidate is given by aggregating the decisions of theT trees. In this study, the RF is made ofT = 500 trees and m = ⌊√M ⌋ = 6, where M = 40 is the number of features.
3. MATERIAL A dataset of 143 fundus images with45o
FOV and an average of 2210 pixels along the ROI diameter is used. Images were acquired in the context of a tele-medecine project, thus us-ing a large variety of retinographs (different models of Zeiss, Topcon, Canon and Centerview). It is saved in JPEG format, the mean compression rate being 14:1.
Fig. 4. FROC curves computed on the test images, before and after OD removal.
All red lesions in the dataset were manually segmented without distinction between MAs and HMs. The segmenta-tion was validated by an ophthalmologist. Among the 143 im-ages, 1515 red lesions were found in a total of 56 imim-ages, the remaining images being red lesions free. The overall dataset was randomly split into a training set made of 73 images (847 lesions) and a test set made of 70 images (668 lesions).
4. RESULTS AND DISCUSSION 4.1. Performance at the candidate extraction step Fig. 3 shows the sensitivity and average number of candi-dates per image for different values of the contrast threshold K. With K = 15, the average number of candidates per im-age is 1115. Over all the manually segmented lesions, only 10% are missed and are not present in the classification step. To the best of our knowledge, only one paper [4] reports the sensitivity at the candidate extraction step. On images with 4 times less pixels in diameter, the sensitivity is 89.8%, for an average of about 300 candidates per image.
4.2. Performance of the RF classifier
To analyze the classification performance of the RF, the ROC curve was computed on the test set and we obtained an area under the curve of 0.932. Considering that only 0.8% of the candidates in the test set correspond to manually seg-mented lesions, the results demonstrate that the RF classifier efficiently overcomes the high imbalance in our dataset. 4.3. Overall performance
To assess the overall performance of the proposed approach, the FROC curve is computed according to [8]. It is shown in blue on Fig. 4. Qualitative analysis of the results revealed first that both MAs and larger HMs are correctly detected by the proposed algorithm (Fig. 5b), as opposed to most of the meth-ods in the literature which focus solely on detection of MAs. Second, most of the false negatives correspond to lesions di-rectly connected to or very close to vessels (about 5 pixels
(a) Original image A (b) Detections in image A
(c) Original image B (d) Detections in image B Fig. 5. Examples of true (green) and false (red) positives.
distance). Third, most of the false positives (FP) are located inside the optic disk (OD) (Fig. 5d) and others correspond to vessel crossings (Fig. 5b).
The second FROC curve, shown in red in Fig. 4, is com-puted after removal of all candidates inside the OD. Auto-matic detection of the OD is achieved by first, identifying the ROI’s subsection with highest variance on a mean filtered ver-sion of the image, second, detecting edges in the original im-age using Canny’s filter, and finally, applying Hough’s trans-form for circle detection. The improved results suggest that OD removal should be used as a preprocessing step.
After OD removal, our system’s sensitivity is 58% and the average number of FPs per image is 7.8, for a probabil-ity threshold of 0.15. The global score of the system, calcu-lated as in [8] over the test set, is 0.367 before OD removal and 0.393 after. Unfortunately, no straightforward compari-son with previously published scores can be done since the dataset is different. However, for a rough comparison, the scores obtained on the low resolution images of the retinopa-thy online challenge vary between 0.206 and 0.434 [7]. The only method [7] that was validated on images with a resolu-tion similar to ours achieved a score of only 0.233 which is lower than ours.
5. CONCLUSION
A novel method for MAs and HMs detection is proposed in this paper. It is developed and validated on images with a resolution similar to the one provided by most state-of-the-art retinographs. The performance of the system is higher than the one proposed in the literature for images of similar
reso-lution. The satisfying preliminary results demonstrate that the new DSFs are highly efficient in discriminating lesions from other candidate regions.
6. REFERENCES
[1] N. Cheung, P. Mitchell, and T. Y. Wong, “Diabetic retinopathy.” Lancet, vol. 376, pp. 124–36, Jul. 2010. [2] M. D. Abramoff, M. K. Garvin, and M. Sonka, “Retinal
Imaging and Image Analysis,” IEEE Rev. Biomed. Eng., vol. 3, pp. 169–208, 2010.
[3] M. Cree, J. Olson, K. McHardy, P. Sharp, and J. Forrester, “A Fully Automated Comparative Microa-neurysm Digital Detection System,” Eye, vol. 11, pp. 622–628, 1997.
[4] M. Niemeijer, B. van Ginneken, J. Staal, M. Suttorp-Schulten, and M. D. Abr`amoff, “Automatic detection of red lesions in digital color fundus photographs.” IEEE Trans. Med. Imag., vol. 24, pp. 584–92, May 2005. [5] A. Fleming, S. Philip, K. Goatman, J. Olson, and
P. Sharp, “Automated microaneurysm detection using local contrast normalization and local vessel detection.” IEEE Trans. Med. Imag., vol. 25, pp. 1223–32, Sep. 2006.
[6] G. Quellec, M. Lamard, P. M. Josselin, G. Cazuguel, B. Cochener, and C. Roux, “Detection of lesions in retina photographs based on the wavelet transform.” in IEEE EMBS Conf., vol. 1, Jan. 2006, pp. 2618–21. [7] I. Lazar and A. Hajdu, “Retinal microaneurysm
detec-tion through local rotating cross-secdetec-tion profile analy-sis,” IEEE Trans. Med. Imag., vol. 32, pp. 400–7, Feb. 2013.
[8] M. Niemeijer, B. van Ginneken, M. J. Cree, A. Mizu-tani, G. Quellec, C. I. Sanchez, B. Zhang, R. Hornero, M. Lamard, C. Muramatsu, X. Wu, G. Cazuguel, J. You, A. Mayo, Q. Li, Y. Hatanaka, B. Cochener, C. Roux, F. Karray, M. Garcia, H. Fujita, and M. D. Abramoff, “Retinopathy online challenge: automatic detection of microaneurysms in digital color fundus photographs.” IEEE Trans. Med. Imag., vol. 29, pp. 185–95, Jan. 2010. [9] R. Bernardes, P. Serranho, and C. Lobo, “Digital ocular fundus imaging: a review.” Ophthalmologica, vol. 226, pp. 161–81, Jan. 2011.
[10] L. Vincent, “Morphological grayscale reconstruction in image analysis: applications and efficient algorithms,” IEEE Trans. Image Process., vol. 2, pp. 176–201, Apr. 1993.
[11] M. Grimaud, “A new measure of contrast: the dynam-ics,” in SPIE Image Alg. and Morpho. Image Process., vol. 1769, 1992, pp. 292–305.
[12] L. Breiman, “Random Forests,” Mach. Learn., vol. 45, pp. 5–32, Oct. 2001.