Publisher’s version / Version de l'éditeur:
Proceedings of the 13th CASI Aeronautics Conference, 2009, 2009-05-07
READ THESE TERMS AND CONDITIONS CAREFULLY BEFORE USING THIS WEBSITE. https://nrc-publications.canada.ca/eng/copyright
Vous avez des questions? Nous pouvons vous aider. Pour communiquer directement avec un auteur, consultez la première page de la revue dans laquelle son article a été publié afin de trouver ses coordonnées. Si vous n’arrivez pas à les repérer, communiquez avec nous à [email protected].
Questions? Contact the NRC Publications Archive team at
[email protected]. If you wish to email the authors directly, please see the first page of the publication for their contact information.
NRC Publications Archive
Archives des publications du CNRC
This publication could be one of several versions: author’s original, accepted manuscript or the publisher’s version. / La version de cette publication peut être l’une des suivantes : la version prépublication de l’auteur, la version acceptée du manuscrit ou la version de l’éditeur.
Access and use of this website and the material on it are subject to the Terms and Conditions set forth at
Data Mining-based Prognostics for CF-18 Aircraft Components
Zaluski, Marvin; Létourneau, Sylvain; Yang, Chunsheng
https://publications-cnrc.canada.ca/fra/droits
L’accès à ce site Web et l’utilisation de son contenu sont assujettis aux conditions présentées dans le site LISEZ CES CONDITIONS ATTENTIVEMENT AVANT D’UTILISER CE SITE WEB.
NRC Publications Record / Notice d'Archives des publications de CNRC:
https://nrc-publications.canada.ca/eng/view/object/?id=5342ee5f-4a04-44e9-80a4-b0c4cfd97d21 https://publications-cnrc.canada.ca/fra/voir/objet/?id=5342ee5f-4a04-44e9-80a4-b0c4cfd97d21
Canadian Aeronautics and Space Institute AERO’09 Conference Propulsion Symposium
Data Mining-Based Prognostics for CF-18 Aircraft Components
Marvin Zaluski, Sylvain Létourneau, and Chunsheng Yang
Institute for Information TechnologyNational Research Council Canada, Ottawa, Canada
[email protected] Sylvain.Lé[email protected] [email protected]
ABSTRACT
The CF-18 aircraft is a complex system for which a variety of data is systematically being recorded: operational flight data from sensors and Built-In Test Equipment (BITE) and maintenance activities recorded by personnel. This data is stored within the operating organization but new analytical and statistical techniques and tools are being developed that could be applied to this data to benefit the organization. This paper investigates the utility of readily available CF-18 data to develop prognostic models for prognostics and health management (PHM) systems. We introduce a generic data mining methodology developed to build prognostic models from operational and maintenance data and elaborate on challenges specific to the use of CF-18 data from the Canadian Air Force. We focus on a number of key data mining tasks including: data gathering, information fusion, data pre-processing, model building, and evaluation. The solutions developed to address these areas are described. A software tool developed to automate the model development process is also presented. Finally, the paper discusses preliminary results on the creation of models to predict F404 No. 4 bearing failures on the CF-18.
INTRODUCTION
The CF-18 has been in service with the Canadian Air Force (CAF) since the early 1980’s. The first aircraft was delivered on October 1982 and Canada’s fleet logged more than 500,000 flying hours by 2002. At the time, the CF-18 was considered one of the most advanced platforms for diagnostics and the CAF further improved the data acquisition capabilities over the years. Aircraft operating parameters such as altitude, engine exhaust temperatures, shaft speeds, and airspeeds are recorded throughout the flight and some parameters such as vibrations and pressures are recorded during a diagnostic event generated by onboard BITE equipment. This operational data has been systematically archived by the CAF and is available for diagnostic/prognostic purposes. In addition, a comprehensive database describing all maintenance actions performed by the personnel on the CF-18 is also available. GasTops and the Canadian Forces exploited some of this data to develop an advanced troubleshooting and performance monitoring tool[1]. In this paper, we investigate the potential usefulness of the available operational and maintenance CF18 data for prognostics.
The CF-18 maintenance database tracks over 2,300 different components and each could be a suitable candidate for building data mining models for diagnostics/prognostics. The initial investigation presented in this paper focuses on the No.4 Bearing on the F404. The No.4 Bearing is a critical component on the engine since its failure can result in delays, cancellation of missions, and even possible loss of an engine or aircraft. Each of these outcomes has a negative effect on the operation of the CF-18 within the Canadian Air Force. A prognostic model for the No.4 Bearing would allow preventive maintenance, which could be highly beneficial. The objective is to build on previous experiences with the application of data mining techniques for prognostics with 18 aircraft components and to determine if the available CF-18 data could be used to build such a prognostic model.
The next section offers a brief overview on our generic data mining-based approach to develop prognostic models for Prognostics and Health Management (PHM) systems and introduces a data mining tool that we are developing to automate and streamline the data mining process. We then elaborate on challenges specific to the development of prognostic models for the No.4 Bearing and detail the data mining experimentation performed. The paper presents preliminary results along with the evaluation criteria and some discussions.
GENERIC DATA MINING-BASED METHODOLOGY
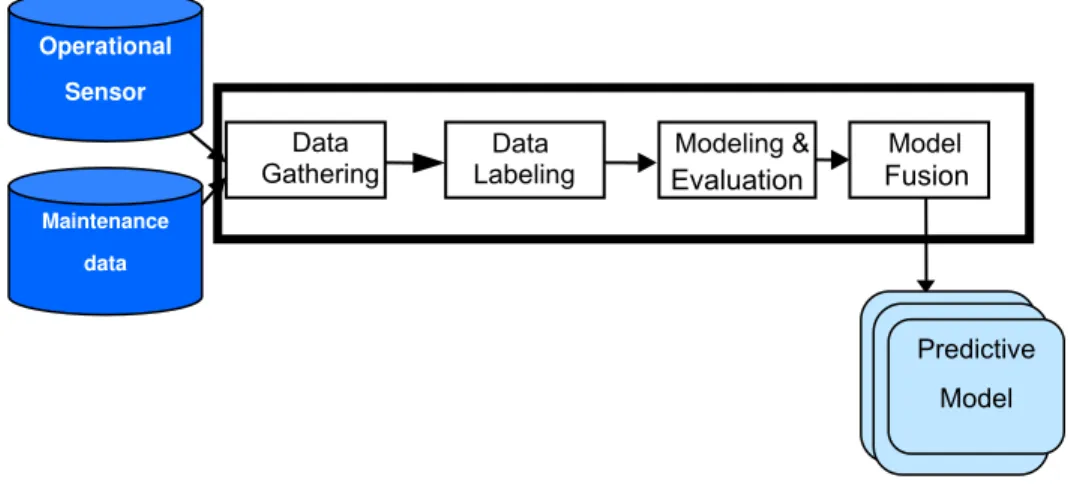
Data mining-based prognostic is an emerging application of data mining to real-world problems. The objective is to use data mining and machine learning techniques to build predictive models from readily available maintenance and operational databases. After validation, these models can be integrated in PHM systems which would monitor equipment health and predict component failures before such events disrupt operations. Figure 1 illustrates the generic data mining
methodology that we have developed to build prognostics models for complex systems such as trains[3] and aircraft[4]. This methodology consists of four steps: data gathering, data labeling, model evaluation, and model fusion.
Data Gathering Data Labeling Modeling & Evaluation Model Fusion Predictive Model Predictive Model Predictive Model Operational Sensor Maintenance data
Figure 1: Overview of Data Mining-Based Methodology
1) Data Gathering: Most data mining algorithms require a dataset as input, which contains examples consisting of vectors of attribute values. Modern machinery often generates many such datasets. Our first problem is to select the dataset(s) to use to build models for a particular component. Advice from subject matter experts and reliable documentation can simplify this choice and help avoid a lengthy trial and error process. Not only must we select a dataset, we must also select a subset of instances to use in the analysis. The datasets are typically very large so it is inefficient to build models using all instances. Simple solutions, such as random sampling, are also inappropriate. To build the desired predictive models, we must be much more focused. We base our analysis on data generated around each occurrence of failure (component replacement). We first identify when replacements occurred and then retrieve instances around the time of these occurrences. Once we have the date and the part identifier for each replacement of a component, we retrieve the relevant instances from the selected sensor datasets. For each dataset and replacement, we retrieve the data obtained between m operating hours prior to the replacement and n operating hours after. The numbers m and n depend on the dataset and the component.
2) Data Labeling: In order to use supervised learning algorithms, we need to add a class attribute (or label) to the selected sensor data. We propose an automated labeling approach. This approach labels as positive (“1”) for all instances that fall in a pre-determined target window before the occurrence of a component failure and as negative (“0”) for all other instances. This labeling scheme allows us to build a classifier that generates an alert whenever the patterns in the data are similar to the ones observed near a failure. In practice, we define the length of the target window by taking into account the optimal period for the end users to receive the alerts and the balance between positive and negative instances.
3) Modeling and Evaluating Models: The modeling and evaluation stage starts with a systematic investigation of data representation changes that can be used to improve the initial representation. This is done by augmenting the initial representation with new features created using methods from signal processing, time-series analysis, and constructive induction. Feature selection is also applied on the augmented data representation to automatically remove redundant or irrelevant features [5][6]. After updating the initial dataset with the class attribute and incorporating data representation enhancements, we use supervised learning algorithms to learn the prognostic models. We use data from a subset of all failures for learning the models and keep the remaining data for testing. Any supervised learning algorithm can be used. In early experiments, we tend to prefer simple algorithms such as decision trees and naive-Bayes over more complex ones because of their efficiency and because they produce models that we can easily explain to the end users. We apply the same algorithm several times with varying attribute subsets and cost information. To compare the models obtained, we apply a score-based approach [2] that we have developed to evaluate models for prognostic systems.
4) Model Fusion: Model fusion can be used for two reasons. First, when more than one data set is relevant for a given component, we can build a model for each dataset and then use model fusion to combine predictions from the various models. Second, we can apply model fusion for performance optimization regardless of the number of datasets selected. In this case, we learn various models using various techniques or parameter settings and combine them to obtain better performance than using any single model. Bagging and boosting [7] are two popular techniques to combine models but they are only applicable when there is a single data set and one kind of model (a single learning algorithm). For heterogeneous models or multiple data sets, we apply methods based on voting or stacking strategy [8]. These techniques are globally referred to as multiple classifier systems [9].
AUTOMATING THE PROCESSES OF DATA MINING
In order to obtain accurate prognostic models, we often need to iterate over many of the steps in the data mining-based methodology presented above. For instance, in most experiments, we need to repeat the execution of the same software module with different configuration or input parameters. To facilitate the process, we have developed an automated data mining system named EBM3 (Environment for Building Models for Machinery Maintenance). In addition to speeding up the execution, the EBM3 system allows the research team to maximize reuse of software components and experimental methodologies between applications.
EBM3 provides a simple user interface that the researchers use to define the overall data mining experiment that needs to be executed in order to build the desired prognostic models. As mentioned above, this experiment involved a number of tasks such as data pre-processing, modeling, evaluation, and model fusion. For each of these tasks, the researcher specifies the input, output, task specific parameters, and the actual software component that will perform the required computation. Theses software components could be written in various languages including Java, Perl, SAS, R, C/C++, Jython, Jess, and Matlab. They can also be written for a specific operating system (Windows or Linux) or specified to run on a given computer. During the execution, the EBM3 system automatically launches the various software components. As needed, it silently connects to the specified computers (using the provided computer IP and login information). The data is automatically transferred from one step to the following one with transparent data format conversions as required. Mechanisms to monitor the execution and to handle run-time errors are also implemented within EBM3.
EBM3 supports the concept of iterations to allow a systematic exploration of parameter values as well as repetitions for various data sets and learning algorithms. Iterations can be defined over a list of discrete values (e.g., algorithm and data set names) or with a numeric range with predetermined increments. This functionality is particularly useful when exploring the potential of various learning algorithms and data transformations. The EBM3 system stores the results for all iterations which allow detailed analysis of the results.
Another important feature of EBM3 is its ability to automatically deploy the predictive models built. After the desired model(s) are developed, EBM3 encapsulates all the required software and configuration information into a package that is ready to be deployed within the J2EE infrastructure that we are using to implement delivery of real-time PHM functionalities. This provides seamless integration between building and deploying models in developing PHM systems. In sum, the EBM3 system provides a structured framework for the definition and execution of complex data mining processes where each step can be implemented independently with extreme flexibility in the choice of programming languages, tools, and computer environments. Advanced features allow efficient execution of repetitive tasks and deployment of the models built. As discussed throughout the paper, the EBM3 system has been used extensively to investigate the potential use of CF-18 sensor and maintenance data for prognostics.
CHALLENGES
Some challenges were identified in order to implement the generic data mining methodology for the CF-18. The first group of challenges is related to transforming the initial sensor measurements into a format that can be used for data mining. Specific difficulties include data selection, feature selection, handling of missing data, different recording frequencies, and conversion of the operational data to useable formats. Another group of challenges is related to implementing the generic data mining methodology. These challenges include algorithm selection, feature data set selection, evaluation criteria, and adapting these tools and processes into an automated EBM3 data mining environment. Since the objective was not to find an optimal solution, we only considered a limited number of approaches in this initial investigation.
The CF-18 data made available for this research consists of five years of operational sensor data (from 1999 to 2004) and over ten years of maintenance data. The sensor data was stored in over 25,000 binary flat files call Aircraft Data Files (ADF) while the maintenance data was in an Oracle database format. An analysis of the maintenance database revealed 1280 cases of No.4 Bearing replacements. The maintenance database established that a bearing is no longer useful when its inventory status is set to scrapped or no longer serviceable. The paper only considers bearing replacements that occurred during the time for which operational data was available (1999-2004). Also, to remove some variability related to aircraft configuration, we only retained replacements that stayed on the same engine, same aircraft, and same position for all their life. We obtained 42 examples of No.4 replacements that satisfy these restrictions.
The engine, aircraft, and position information was not explicitly recorded in the maintenance database, but this information could be traced by joining related engine and aircraft maintenance actions to the bearing replacement. A special application was developed and integrated in EBM3 to perform this analysis as part of the data gathering task in the data mining experimentation described below. An example of this integration of maintenance information is described for Bearing SBBOH798 using date information and next higher component information stored with each maintenance record. Bearing SBBOH798 was initially installed in October 2000 in High Pressure Turbine (HPT) MH381108. This HPT was
installed on engine 376285 in December 2000. This engine was then installed in the left engine bay on aircraft 725 in February 2001 and the operational data recorded after this date will be used in the data mining experiment. A similar verification is done for the last removal of Bearing SBBOH798 to ensure the same configuration, HPT, engine aircraft, position, was maintained.
The operational data collected on the CF-18 aircraft is organized into 65 different message groupings. We focused on four of these to retrieve relevant sensor measurements and flight information. One problem was establishing when a flight started and ended so that the information could be gathered. Another problem was the differences in recording frequencies between parameters; some parameters were recorded every second while others every five seconds during flight. Examples of such parameters are indicated air speed, low pressure rotor speeds, and exhaust gas temperatures. Other parameters, such as oil pressures and broadband vibration, are recorded at once per second for 15 seconds during a thrust check. These parameters are also recorded once per second for 35 seconds after a diagnostic event is triggered by the Built In Test Equipment (BITE). It was important to summarize this differing operational data recording and frequency into a single value to be used in model development because all these parametric values will be considered in building prognostic models for the component. Since there are many components and symptoms that could be modeled using our data mining techniques, we wanted to focus on low level assembly components tracked in the maintenance data where no more remaining useful life for the component could be easily established. For these and other reasons, we selected the No.4 Bearing component for generating prognostic data mining models for PHM. By building prognostic models for this component, we hope to predict failure/replacement of the No.4 bearing before it actually fails and causes an unexpected disruption and/or cost to the operator. If this impending failure/replacement can be predicted, this would allow the CAF to perform more opportunistic maintenance and improve overall CF-18 fleet readiness.
NO.4 BEARING DATA MINING MODEL DEVELOPMENT
This section presents the experiments for developing prognostic models for No. 4 Bearing replacements from the collected CF18 operational and maintenance data. The experiments were conducted following the generic methodology with the EBM3 system. This section describes the details for each of the different stages in the methodology and how the above challenges are addressed.
EXPERIMENT
The data mining experimentation used the EBM3 functionality to implement the generic data mining methodology. EBM3 uses eXtensible Markup Language (XML) to design and store data mining experiments and integrates external applications. These external applications are called blackboxes, which are developed to execute an independent data mining task in specific environment or platform. The No.4 Bearing experimentation used over 30 external applications or blackboxes from EBM3 to perform the different tasks required in each stage of the generic data mining methodology. There were also around 85 XML experiment files created to separate and balance the computing load for building data sets and models. The experiment benefited from EBM3’s ability to iterate over different feature sets and machine learning algorithms. The other XML experimentation files processed the results from the evaluation stage by generating summary HTML files. The CF-18 No.4 bearing experimentation used three of the four stages in the generic data mining methodology and they are further explained below. In this work, we have not conducted any experimentation related to the last stage: model fusion.
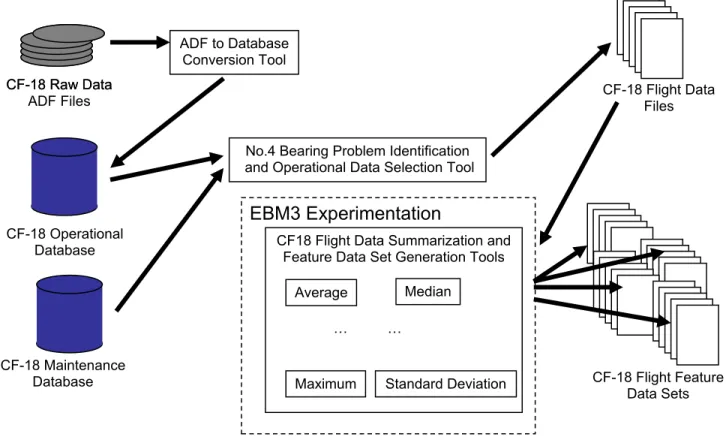
Data Gathering and Labeling
The data gathering and labeling processes transform the initial sensor measurements into a format that a machine learning algorithm can use to build a data mining model. Figure 2 describes the processes involved in generating the data set files from the raw sensor data. The original format of the operational data was binary flat file that was processed by a Java application into an Oracle database, which allows for easy retrieval. The next step is identification of the appropriate operational data using the No.4 Bearing replacement data from the maintenance database. A Java application retrieves the information for initial installation and final removal from the maintenance database. This maintenance information is used to collect the operational data and the same Java application transforms it into a text flat file with raw operational data. This flat file also has each observation labeled as normal operation and alert situation added to it. Normal operation is defined as flights that occur after the initial installation of the No.4 Bearing and an alert situation occurs in the last 20 flights before the bearing was removed and scrapped. Each No.4 Bearing replacement generated a flight data file and 42 Flight Data files were generated in this process.
The next step involves 21 different Java applications to summarize the numerous data points for a single flight into one statistical value for the flight. Examples of statistical values are average, median, standard deviation, and quantiles. This results in 21 different data sets with summarized CF-18 operational flight data for the different statistical measures. Some of the features inside the CF-18 operational flight data sets must be filtered out in order not to add noise or bias the machine learning algorithm. An EBM3 Experiment was created to filter out such attributes as flight number, date
information, and aircraft configuration information. Finally the same EBM3 Experiment separates the CF-18 operational flight data sets into training and testing data sets. The No.4 Bearing replacements were ordered chronologically and the first 33 replacements were placed in a training data set. The remaining 9 No.4 Bearing replacements were used to create a testing data set. The end of the data gathering and labeling phase results in 21 training and 21 testing data sets, one for each statistical summary feature, that can be used in the model building and testing process.
CF-18 Raw Data CF-18 Raw Data ADF to Database Conversion Tool CF-18 Flight Data Files
Figure 2: Data Gathering and Labeling Processes in EBM3
Model Building
EBM3 integrates the Weka suite of machine learning algorithms. The Weka suite of machine learning algorithms contains many different machine learning algorithms for classification [10] and EBM3 integrates each of these algorithms into its data mining environment. In the CF-18 No.4 Bearing data mining experiment, four different types of classification algorithms were used. These groups and the individual algorithms used are outlined in Table 1. Not all algorithms were successful in creating data mining models and those which were successful in generating a model are also identified in the table below.
Algorithm Type Algorithm Implementations Model Built
Bayes Learners AODE X
ComplementNaiveBayes √
NaiveBayes √
Lazy Learners Ibk √
Kstar √
Rule Learners ConjunctiveRule √
Jrip √ M5Rules X Nnge √ OneR √ Prism X Ridor √ ZeroR √ Tree Learners J48 √ ADTree √ DecisionStump √ Id3 X M5P X NBTree √ RandomForest √
EBM3 Experimentation
ADF Files CF-18 Operational Database CF-18 Maintenance DatabaseNo.4 Bearing Problem Identification and Operational Data Selection Tool
… …
CF18 Flight Data Summarization and Feature Data Set Generation Tools
Average Median
Maximum Standard Deviation CF-18 Flight Feature
RandomTree √
REPTree √
Note: X means that no model was built
Table 1: Four Types of Machine Learning Algorithms
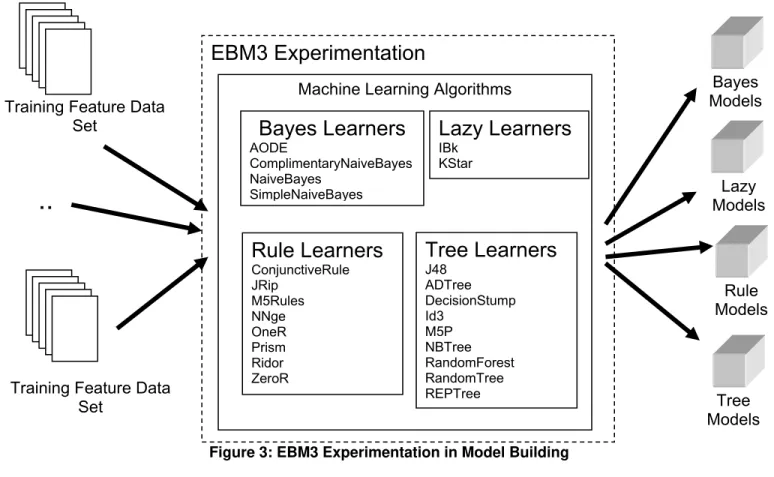
EBM3 Experiments were developed to generate models from the 21 different training data sets from the four types of machine learning algorithms. Figure 3 below outlines the EBM3 experiments and the models that were generated. A total of 357 models were created after executing the EBM3 experimentation.
Figure 3: EBM3 Experimentation in Model Building
Training Feature Data Set
Training Feature Data Set
EBM3 Experimentation
Model Evaluation
There were many different processes involved in calculating and displaying the results of model evaluation. An EBM3 experiment was created to integrate these different processes and further automate the model evaluation phase. The first process calculates the different evaluation measures and creates a flat text file. This flat text file is used to create HTML pages and supporting graphics that display the results. These processes are described in Figure 4 below.
Figure 4: EBM3 Experimentation Model Evaluation
Model s
Testing Feature Data Sets EBM3 Experimentation Classification Results HTML Results Classification Evaluation HTML Presentation
..
Bayes Models Lazy Models Rule Models Tree Models Machine Learning AlgorithmsBayes Learners
AODE ComplimentaryNaiveBayes NaiveBayes SimLazy Learners
IBk KStar pleNaiveBayesTree Learners
J48 ADTree DecisionStump Id3 M5P NBTree RandomForest RandomTree REPTreeRule Learners
ConjunctiveRule JRip M5Rules NNge OneR Prism Ridor ZeroREXPERIMENTAL RESULTS
EVALUATION CRITERIA
Two different types of evaluation criteria are used to evaluate the models built. The first evaluation criteria used are traditional techniques for evaluating data mining models. Precision and recall are two measures used to assess the performance of a model [11]. Precision is calculated using the formula below and is the total number of correct predictions over the total number of observations. Recall is the total number of correctly predicted positive instances over the total number of positive instances. The formula is also seen below. These two evaluation criteria can assess the accuracy and recall, but sometimes these are not enough. The second type of evaluation criteria is custom functions and measures that assess the data mining models with a different perspective.
Precision = Number of Correct Predictions Total Number Of Instances
Figure 5: Precision Formula
Recall = Number of Correct Positive Predictions Total Number Of Positive Instances
Figure 6: Recall Formula
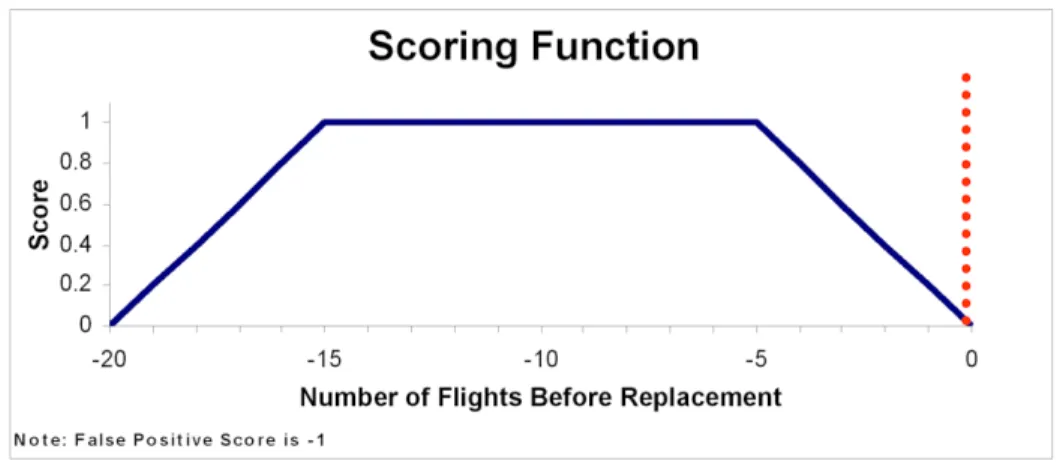
Two custom functions were developed to assess the predictive capabilities of the data mining models for the CF-18 No.4 Bearing replacement. The first function determines the detection of the problem during the period of time where a problem should be detected. The second custom function is an adaptation of a similar scoring functions used in the APU and train wheel experimentation [2]. The figure below outlines the scoring function and the values assigned for each prediction. Each prediction is given a score according to the scoring functions and the prediction scores are summed to give a total score for all examples in the testing data set.
Figure 7 Scoring Function
These four evaluation measures are applied to the predictions from the models generated for CF-18 No.4 Bearing replacement.
EVALUATION
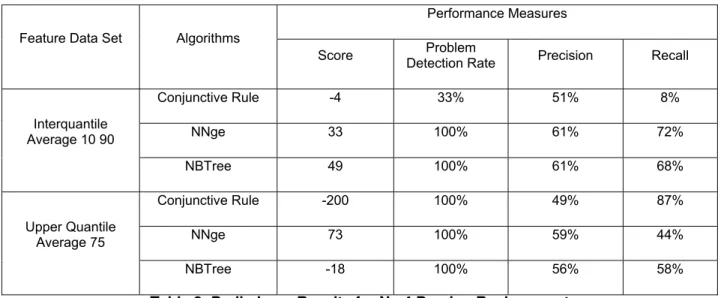
The testing data set contains 9 different No.4 Bearing replacements that are not used in training the data mining models and data mining model predictions for the test data are stored in a flat file. There were 357 different prediction files, one for each of the different algorithms and feature sets. The same flat file was used to calculate the four different evaluation measures. The test data set has an equal number of normal and alerting situation examples and if one were to classify all as normal operation, the following evaluation measures can be calculated. Since half of the testing data consists of normal operating observations, the precision can be calculated as 50%. Table 2 outlines the results of these calculations for the best performing algorithms and feature data sets. Three different algorithm results are presented in the tables
below, they are: Conjunctive Rule, Nearest Neighbor generalized exampler (NNge), and Naïve Bayes Decision Tree (NBTree). The Interquantile Average 10 90 feature data set is the calculation of the average between the 10th and 90th quantile and the Upper Quantile Average 75 is the average of the values above the 75th quantile.
Feature Data Set Algorithms
Performance Measures
Score Detection Rate Problem Precision Recall
Interquantile Average 10 90 Conjunctive Rule -4 33% 51% 8% NNge 33 100% 61% 72% NBTree 49 100% 61% 68% Upper Quantile Average 75 Conjunctive Rule -200 100% 49% 87% NNge 73 100% 59% 44% NBTree -18 100% 56% 58%
Table 2: Preliminary Results for No.4 Bearing Replacement
The data mining models detected all the No.4 Bearing replacement except for the Conjunctive Rule algorithm on the Interquantile Average 10 90 data set. The best custom scoring function score is 73 for NNge on the Upper Quantile Average 75 data set where the best score is 675. NBTree and NNge have the highest precision, 61%, on the Interquantile Average 10 90 data set. Finally, the best recall is achieved with the ConjunctiveRule on the Upper Quantile Average 75 data set.
DISCUSSION
The decision of which data mining algorithm to implement in a PHM system would depend on which of the four evaluation criteria are deemed most important. The above results show that there is no single data mining model that performs better than all other models in all the evaluation criteria. Some models like NNge on the Interquantile Average 10 90 data have a high precision, 61%, but a low custom scoring function score, 33. Meanwhile, a lower precision score, 59%, for NNge on the Upper Quantile Average 75 data set yielded a higher custom scoring function score of 73. One possible reason for this would be that the algorithm did well in predicting alerting events while not compromising false alerts during the normal operation period. Also, the increase in a score of an evaluation metric could negatively impact the score from another evaluation metric. For instance, a better recall score will usually result in a lower precision. Generation of a model that yields a maximum score for all the above evaluation criteria is highly unlikely. Therefore, a compromise must be reached that would best suite the constraints for the maintenance organization and the models that perform well against those evaluation criteria should be deployed in the PHM system.
EBM3 allows the data mining experiments to be easily configured and replicated so they can be shared with all team members. The XML file for the data mining experiment can be transferred to another member of the team where they can modify it and execute the experiment on a different computer. Also, the data model building process in EBM3 is flexible and extendable. Accordingly, other machine learning algorithms and feature sets could be incorporated into the existing experimentation. If a new algorithm is identified, it can be integrated into EBM3 through an XML configuration and the existing experimentation can be easily modified to apply the new algorithm to the different feature sets. Similarly, new feature sets must be integrated into existing EBM3 experimentations as they are created. Due to the large number of combinations of algorithms and data sets, EBM3 can run data mining experiments on a cluster computer with a process scheduler. This makes the model building process more efficient by executing some of the data mining steps in parallel.
CONCLUSION AND FUTURE WORK
This paper describes a generic data mining methodology and how it is applied to predicting replacement of the No.4 Bearing on the CF-18. The already available maintenance and operational data resources are used with the methodology to build and evaluate predictive data mining models, which can be used in a PHM system. The preliminary results show
that the developed prognostic models are able to predict a significant proportion of No.4 Bearing failures using data resources readily available within the Canadian Air Force. Other potential areas of future work could be feature selection, model fusion and more accurate predictions of remaining useful life. These and other types of experimentation are ongoing and will hopefully have a positive affect on the evaluation criteria with better scoring. Finally, we intend to implement a demonstration PHM system with selected data mining models to help further assess the potential benefits of PHM for the CF-18.
ACKNOWLEDGMENTS
This work was made possible with the collaboration and contributions from Canadian Department of National Defense and Defense Research and Development Canada.
Many people at the National Research Council have contributed to this project. Special thanks go to Bob Orchard, Chris Drummond, Elizabeth Scarlett, Richard Liu, George Forester, Jeff Bird for their support, valuable discussions, and suggestions. We also would like to extend out special thanks to Kyle Mulligan.
REFERENCES
1. Cue, R. W. and Muir, D. E., “Engine Performance Monitoring and Troubleshooting Techniques for the CF-18 Aircraft”, Journal of Engineering for Gas Turbines and Power, vol. 113, pp. 11-19, January 1991.
2. S. Létourneau, C. Yang, C. Drummond, E. Scarlett, J. Valdes, and M. Zaluski, “A domain independent data mining methodology for prognostics,” in Proceedings of the 59th Meeting of the Society for Machine Failure Prevention Technology, MFPT ’05, Virginia Beach, Virginia, USA, April 2005.
3. C. Yang and S. Létourneau, “Learning to predict train wheel failures” in Proceedings of the 11th ACM SIGKDD International Conference on Knowledge Discovery and Data Mining (KDD2005), Chicago, USA, August 2005, pp. 516–525.
4. S. Létourneau, A. F. Famili, and S. Matwin, “Data mining for prediction of aircraft component replacement,” IEEE Intelligent Systems and their Applications, vol. 14, no. 6, pp. 59–66, 1999.
5. M. Hall, “Correlation-based feature selection for discrete and numeric class machine learning,” in Proceedings of the 17th International Conference on Machine Learning, A 2000, pp. 359–366.
6. K. Kira and L. Rendell, “A practical approach to feature selection,” in Proceedings of the 9th International Conference on Machine Learning, 1992, pp. 249–256.
7. T. Dietterich, “An experimental comparison of three methods for constructing ensembles of decision trees: Bagging, boosting and randomization,” IEEE Intelligent Systems and their Applications, vol. 40, pp. 139–158, 2000.
8. I. K. G. Tsoumakas and I. Blahavas, “Effective voting of heterogeneous classifiers,” in Proceedings of the 15th European Conference on Machine Learning (MCML2004), 2004, pp. 465–476.
9. S. Dzeroski and B. Zenko, “Stacking with multi-response model trees,” in The Proceeding of International Workshop in Multiple Classifier Systems (MCS2002), 2002, pp. 201–211
10. Ian H. Witten and Eibe Frank (2005) "Data Mining: Practical machine learning tools and techniques", 2nd Edition, Morgan Kaufmann, San Francisco, 2005.
11. Makhoul, J., Kubala, F., Schwartz, R., and Weischedel, R. (1999). Performance Measures for Information Extraction. In Proceedings of the DARPA Broadcast News Workshop, Herndon, USA, February 28 – March 3, 1999.