Publisher’s version / Version de l'éditeur:
Vous avez des questions? Nous pouvons vous aider. Pour communiquer directement avec un auteur, consultez la
première page de la revue dans laquelle son article a été publié afin de trouver ses coordonnées. Si vous n’arrivez pas à les repérer, communiquez avec nous à [email protected].
Questions? Contact the NRC Publications Archive team at
[email protected]. If you wish to email the authors directly, please see the first page of the publication for their contact information.
https://publications-cnrc.canada.ca/fra/droits
L’accès à ce site Web et l’utilisation de son contenu sont assujettis aux conditions présentées dans le site LISEZ CES CONDITIONS ATTENTIVEMENT AVANT D’UTILISER CE SITE WEB.
8th Nordic Symposium on Building Physics [Proceedings], pp. 1-8, 2008-06-15
READ THESE TERMS AND CONDITIONS CAREFULLY BEFORE USING THIS WEBSITE.
https://nrc-publications.canada.ca/eng/copyright
NRC Publications Archive Record / Notice des Archives des publications du CNRC :
https://nrc-publications.canada.ca/eng/view/object/?id=40ce1d81-ba67-488c-b7bb-0a372ab719c0 https://publications-cnrc.canada.ca/fra/voir/objet/?id=40ce1d81-ba67-488c-b7bb-0a372ab719c0
NRC Publications Archive
Archives des publications du CNRC
This publication could be one of several versions: author’s original, accepted manuscript or the publisher’s version. / La version de cette publication peut être l’une des suivantes : la version prépublication de l’auteur, la version acceptée du manuscrit ou la version de l’éditeur.
Access and use of this website and the material on it are subject to the Terms and Conditions set forth at
Moisture performance assessment of wood-frame exterior building
envelope construction in China
Mukhopadhyaya, P.; van Reenen, D.; Kumaran, M. K.; Copeland, C.;
Newman, P. J.; El Khanagry, R.; Zalok, E.
http://irc.nrc-cnrc.gc.ca
M o i s t u r e p e r f o r m a n c e a s s e s s m e n t o f w o o d
-f r a m e e x t e r i o r b u i l d i n g e n v e l o p e c o n s t r u c t i o n
i n C h i n a
N R C C - 5 0 5 8 0
M u k h o p a d h y a y a , P . ; v a n R e e n e n , D . ; K u m a r a n ,
K . ; C o p e l a n d , C . ; N e w m a n , P . J . ; E l K h a n a g r y ,
R . ; Z a l o k , E .
A version of this document is published in / Une version de ce document se trouve dans: 8th Nordic Symposium on Building Physics, Copenhagen, June 15-18, 2008, pp. 1-8
The material in this document is covered by the provisions of the Copyright Act, by Canadian laws, policies, regulations and international agreements. Such provisions serve to identify the information source and, in specific instances, to prohibit reproduction of materials without written permission. For more information visit http://laws.justice.gc.ca/en/showtdm/cs/C-42
Les renseignements dans ce document sont protégés par la Loi sur le droit d'auteur, par les lois, les politiques et les règlements du Canada et des accords internationaux. Ces dispositions permettent d'identifier la source de l'information et, dans certains cas, d'interdire la copie de documents sans permission écrite. Pour obtenir de plus amples renseignements : http://lois.justice.gc.ca/fr/showtdm/cs/C-42
Moisture Performance Assessment of Wood-frame Exterior
Building Envelope Construction in China
Phalguni Mukhopadhyaya, Dr,
Institute for Research in Construction, NRC Canada, Ottawa, Ontario, Canada. [email protected], www.nrc.ca
David van Reenen, Mr,
Institute for Research in Construction, NRC Canada, Ottawa, Ontario, Canada. [email protected], www.nrc.ca
Kumar Kumaran, Dr,
Institute for Research in Construction, NRC Canada, Ottawa, Ontario, Canada. [email protected], www.nrc.ca
Curt Copeland, Mr,
Special Advisor and Building Specialist, Canada Wood Group and Council of Forest Industries, Canada [email protected], www.cofi.org
Paul J. Newman, Mr,
Executive Director, Market Access and Trade, Council of Forest Industries, Canada, and Canada Wood [email protected], www.cofi.org
Ramez El Khanagry, Mr,
Graduate Student, Carleton University, Canada [email protected], www.carleton.ca Ehab Zalok, Dr,
Professor, Carleton University, Canada [email protected], www.carleton.ca
KEYWORDS: wood-frame, exterior building envelopes, Shanghai (China), hygrothermal. SUMMARY:
This paper presents some of the results from a research project that investigates the hygrothermal (i.e. thermal and moisture) performance of the Canadian wood-frame exterior building envelope construction practices in the cities of Shanghai and Beijing (China) and Taichung (Taiwan). This study has been done using a two-dimensional hygrothermal simulation tool, hygIRC-2D. In this paper, four exterior walls and two roof constructions are exposed to the exterior climatic conditions of Shanghai. The first set of simulations is conducted with wall constructions that have no air leakage. Thereafter, two wall constructions are also simulated with various levels of air leakage through the wall assembly. The outputs from the simulations have been analyzed with the help of a moisture response indicator called RHT index. Simulation results indicate the relative performances and suitability of the different wall and roof assemblies in Shanghai. The results of this study, including those presented in this paper, have helped to develop moisture and thermal (i.e. hygrothermal) design guidelines for Canadian style wood-frame building envelope construction in China.
1. Introduction
In Canada and other parts of North America, traditional wood frame exterior building envelope construction is widely used and its ability to manage the exterior and interior moisture and thermal (i.e. hygrothermal) loads is well known from the field performance observations over the years. However, this type of building envelope construction is not traditionally used in China. Currently, Canada Wood, an association of Canadian forest industry partners including the Council of Forest Industries (COFI), is working with various levels of government and the construction sector in China to improve quality design and construction of wood-frame
buildings, including the building envelope. COFI leads in Asia on behalf of Canada Wood. The ultimate objective is to develop growing and sustained markets for Canadian wood products in Asia, particularly China. However, quality assurance is not possible without knowing the consequences and the ability of the wood frame building envelope assemblies to manage the hygrothermal loads in the climatic conditions of China. This long-term performance issue becomes even harder to resolve when there is no comprehensive field performance data, as in this case.
In the absence of any credible field performance data, the National Research Council (NRC) of Canada and Canada Wood initiated a joint research project to investigate the long-term performance of alternative designs of wood-frame building envelope assemblies (walls and roofs) in Shanghai and Beijing (China) and Taichung (Taiwan) using a hygrothermal simulation tool, hygIRC-2D. In recent years hygrothermal simulation tools have been widely used for the evaluation of the thermal and moisture response of the building envelopes (Mukhopadhyaya et. al.2003; Djebbar et. al. 2002, Vinha 2007). The benchmarked two-dimensional hygrothermal simulation tool, hygIRC-2D (Maref et al. 2002; Hagentoft et al. 2004), was developed at the Institute for Research in Construction of the National Research Council Canada. Some of the simulation results for Shanghai are presented in the following sections.
1.1 Research objectives and scope
The purpose of this study is to evaluate the hygrothermal performance of alternative wood-frame building envelope designs in Shanghai (China) using the hygrothermal simulation tool hygIRC-2D. The numerical simulations were done on four types of exterior walls and two types of unvented roof assemblies. Initially, the roof and wall constructions were simulated assuming no air leakage through the assemblies. Subsequently, simulations with air leakage were conducted on two of the wall constructions under three assumptions of air leakage. As a result, the effects of vapour diffusion could be assessed independently of air leakage. Varying the rates of air leakage helps explain the relationship between air leakage rates and hygrothermal response.
2. . Simulation tool hygIRC-2D
The hygrothermal simulation tool used in this study is a computer aided numerical model, hygIRC-2D, that can predict the moisture response of building envelopes (Hens 1996). hygIRC-2D is continuously evolving as a research tool, developed by a group of researchers at the Institute for Research in Construction (IRC) of the National Research Council (NRC), Canada. Interested readers can refer to the publications by Karagiozis (1997) and Djebbar et al., (2002) for further details. These documents outline the formulation of the combined heat, air and moisture transport equations used in hygIRC-2D and the techniques used to solve them numerically. The reliability of hygIRC-2D outputs has been established through laboratory measurements and benchmarking exercises (Maref et al. 2002; Hagentoft et al. 2004). The effective use of hygIRC-2D to analyze and obtain meaningful results, however, demands a proper physical understanding of the problem, an appropriate definition of input parameters and the ability to judiciously interpret the outputs from the simulation tool (Mukhopadhyaya
and Kumaran, 2001; Mukhopadhyaya et al. 2001; Kumaran et al. 2003).
2.1 Basic inputs and assumptions for modeling
2.1.1 Construction details
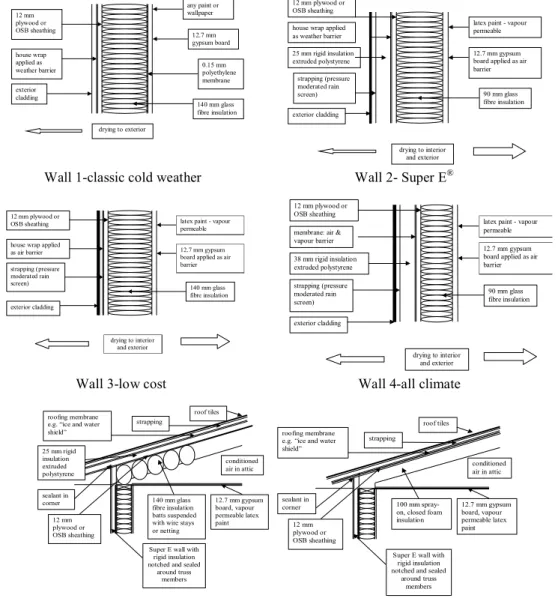
Several different wall and roof designs (Figure 1) were evaluated to compare their hygrothermal performance. Canada Wood submitted these designs, with construction details, to the IRC researchers for hygrothermal performance evaluation under Shanghai weather conditions. As mentioned earlier, simulations were first conducted with no air leakage. These include the following exterior wall designs: (i) Wall 1 – Classic cold weather wall; (ii) Wall 2 – Super E® wall; (iii) Wall 3 – Low-cost wall; (iv) Wall 4 – All climate wall; and roof designs: (v) Roof 1 – unvented truss roof with XPS and glass fibre insulation; (vi) Roof 2 – unvented truss roof with spray-on foam insulation.
2.1.2 Air leakage
To understand the effects of imperfect air barriers in the wall constructions, air leakage was introduced in the Super E® and low cost walls. An air leakage path was created through each of the wall assemblies. The air would enter/exit, depending on the nature of indoor and outdoor pressure, along a crack at the exterior top of the
wood-framed wall and then travel through the insulation cavity and exit/enter at the interior bottom of the wall (Figure 2). The size of the crack was varied to simulate various levels of air leakage. This size was based on the normalized leakage area (NLA), which is the area of the crack in cm2 divided by the area of the wall in m2. Three levels of air leakage were examined: 0.3, 0.7, and 1.5 NLA.
The following wall and roof constructions were examined with air leakage: Wall 2 – Super E® Wall – 0.3, 0.7, and 1.5 NLA •
• Wall 3 – Low cost wall – 0.3, 0.7, and 1.5 NLA
2.1.3 Material properties
hygIRC-2D simulation requires eight sets of material properties. These properties are air permeability, thermal
conductivity, dry density, heat capacity, sorption characteristics, suction pressure, liquid diffusivity and water vapour permeability. These materials properties were obtained from the IRC/NRC's hygrothermal materials properties database (Kumaran et al (2002); Kumaran et al (2004); Mukhopadhyaya et al (2004)) and were determined in the IRC's Thermal Insulation and Moisture Performance Laboratory.
12.7 mm gypsum board 0.15 mm polyethylene membrane 140 mm glass fibre insulation 12 mm plywood or OSB sheathing house wrap applied as weather barrier exterior cladding drying to exterior any paint or wallpaper
Wall 1-classic cold weather
12.7 mm gypsum board applied as air barrier 25 mm rigid insulation extruded polystyrene 90 mm glass fibre insulation 12 mm plywood or OSB sheathing house wrap applied as weather barrier exterior cladding drying to interior and exterior strapping (pressure moderated rain screen)
latex paint - vapour permeable
Wall 2- Super E®
12.7 mm gypsum board applied as air barrier
140 mm glass fibre insulation 12 mm plywood or
OSB sheathing house wrap applied as air barrier exterior cladding drying to interior and exterior strapping (pressure moderated rain screen)
latex paint - vapour permeable
Wall 3-low cost
12.7 mm gypsum board applied as air barrier 38 mm rigid insulation extruded polystyrene 90 mm glass fibre insulation 12 mm plywood or OSB sheathing membrane: air & vapour barrier exterior cladding drying to interior and exterior strapping (pressure moderated rain screen)
latex paint - vapour permeable
Wall 4-all climate
12.7 mm gypsum board, vapour permeable latex paint sealant in corner 140 mm glass fibre insulation batts suspended with wire stays or netting 12 mm plywood or OSB sheathing 25 mm rigid insulation extruded polystyrene roofing membrane e.g. “ice and water shield”
Super E wall with rigid insulation notched and sealed
around truss members conditioned air in attic strapping roof tiles 12.7 mm gypsum board, vapour permeable latex paint sealant in corner 100 mm spray-on, closed foam insulation 12 mm
plywood or OSB sheathing roofing membrane e.g. “ice and water shield”
Super E wall with rigid insulation notched and sealed
around truss members conditioned air in attic strapping roof tiles
Roof 1-unvented: XPS and glass fibre insulation
Roof 2-unvented: spray-on foam insulation
FIG 1: Walls and roofs construction details.
Air flow path
Shea thi n g Boa rd G la ss F ib re In su la ti on Gy p su m B o a rd
FIG 2: Schematic airflow path. 2.1.4 Environmental conditions
Hourly recorded Shanghai weather data was used as outdoor/external boundary conditions. hygIRC-2D requires the following hourly recorded weather components: temperature, relative humidity, wind velocity, wind direction, rainfall, solar radiation and cloud index. Weather data for the year 2003 was obtained from the weather bureau of China. Table 1 provides general climatic conditions for Shanghai.
TABLE 1: Climate+ summary of Shanghai
HDD18 1691 Extreme Mean Maximum 37° C
CDD26 164 RH Mean Coldest Month 75%
Mean Annual Temperature 16° C RH Mean Hottest Month 83% Extreme Minimum Temperature -10° C Annual Precipitation 119 cm Extreme Maximum Temperature 39° C Mean for Dominant Wind 3.8 m/s Extreme Mean Minimum Temperature -7° C Maximum Depth of Frost 8 cm
+ Based on data from 1951 to 1980
The indoor conditions (temperature and relative humidity) used in the simulations were for a controlled indoor environment based on summer and winter seasons, identified according to the criteria specified in the ’Specifications to National (Canada) Energy Code for Houses, (Swinton and Sander, 1994)’. If the monthly average outdoor temperature was below 11 °C it was considered winter. If the monthly average temperature was above 11 °C it was considered summer. Indoor conditions in Shanghai were developed based on conversations with building science professionals who had knowledge of building practises in China. In the summer the indoor conditions were 25 °C temperature and 65% relative humidity. In the winter the indoor conditions were 18 °C temperature and 40% relative humidity.
3. Simulation results
A significant amount of data was generated by hygIRC-2D simulations and subsequently post-processed for the detailed evaluation of the hygrothermal response of the building envelopes (Mukhopadhyaya and van Reenen
2007). For relative comparison of hygrothermal performance of the building envelope assembly, a novel
hygrothermal performance indicator was used in this study as described in the following paragraphs.
3.1 RHT index – hygrothermal performance indicator
It is widely accepted that building materials are subject to deterioration under the combined effects of temperature and moisture. The most deleterious conditions are those in which moderate or high temperature is coupled with high humidity for extended periods (Nofal and Morris 2003). This study uses a novel long-term hygrothermal response indicator, called the RHT index, derived from the relative humidity (RH) and temperature (T) conditions inside the building envelope cross section over a period of time for any specific area of the cross-section. The RHT index is an indicator used to quantify and compare the hygrothermal response of the wall assembly. This index captures the duration of moisture and thermal conditions coexisting above threshold RH
and T levels. RH and T are given linear weight in the RHT index. It is to be noted that for many materials this may not always be the case when assessing their long-term performance while subjected to varying and elevated moisture conditions. A different weighting for RH and T can be determined only through controlled long-term experiments. The RHT index as defined in this study is:
Cumulative RHT=∑ (RH-RHX)×(T-TX) (1)
for RH>RHX% and T>TX°C at every hour of the simulation.
Where, RHX and TX are the threshold values for relative humidity and temperature respectively.
In this set of simulations two sets of threshold levels were used. The first set was with an RH of 80% at 0 °C temperature, hereafter referred as RHT80. The second set was with an RH of 95% at 0 °C temperature, hereafter referred as RHT95. The cumulative RHT was a summation done on an hourly basis for the final two years of the simulation.
During any time step when either or both RH ≤ RHX % and T ≤ TX °C, the RHT value for that time step is zero.
A schematic diagram for the generation of RHT index value is shown in Figure 3. The results presented in the following section use the cumulative two-year RHT index as a single-value hygrothermal response indicator. A higher value of RHT index indicates a greater potential for moisture-related deterioration. It is to be noted here that two different walls with similar cumulative RHT values can still have very different hygrothermal responses. At the same time, climates or conditions that seem intuitively to be quite different can produce similar cumulative RHT values. It is also to be mentioned here that the threshold RHT index value that borders a safe and unsafe hygrothermal design of a wall system is yet to be defined. IRC researchers will work on this issue in the coming days.
4. Discussion
Computer simulations for each assembly design were subsequently processed to produce the following graphical displays: (i) RHT Analysis for 80% RH and 0°C; (ii) RHT Analysis for 95% RH and 0°C; (iii) moisture accumulation in each product or material component over the review period; (iv) total moisture and moisture content (%) in the wood components over the review period; (v) temperature and relative humidity in the wood components over the review period. Because it is impossible to present all the analytical information in this paper, only brief discussion on significant observations is presented in the following paragraphs. Readers may wish to refer to the publication (Mukhopadhyaya and van Reenen 2007) for the entire information.
4.1 Walls with no air leakage
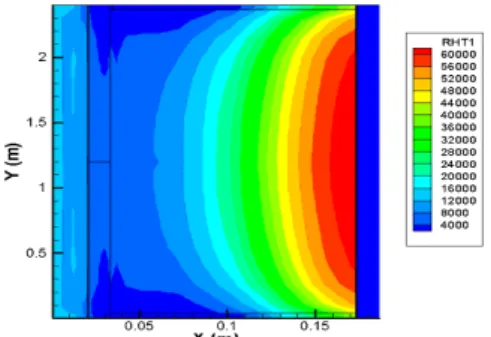
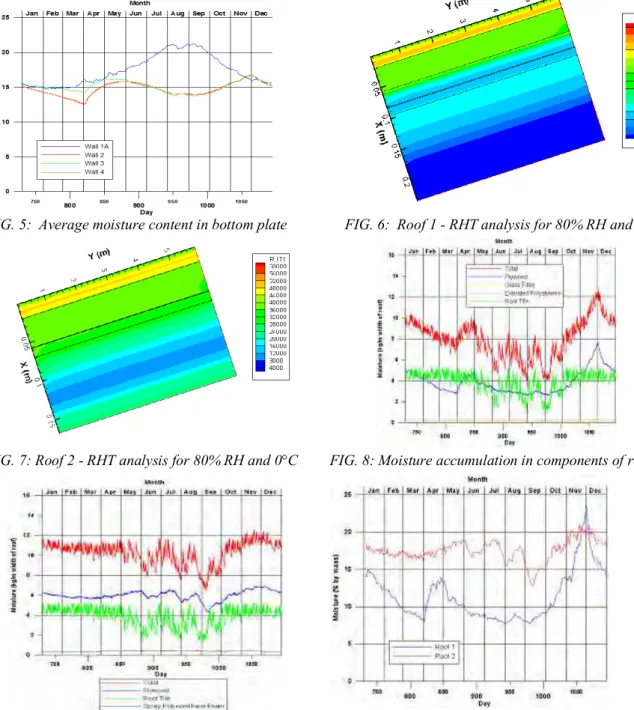
The hygrothermal simulations of the wall assemblies with hygIRC-2D indicate that Wall 1 (classic cold weather) has an area of intense hygrothermal loading (i.e. higher RHT index values) along the interior side of the poly sheet (Figure 4). The moisture contents in the top and bottom plates are higher than the other three wall types. The maximum moisture content in the bottom plate reaches a value of approximately 21% and remains at this level for several months during the summer (Figure 5). The other wall cross-sections remain near 15 % moisture content, reaching a maximum of 17%. The higher RHT values and moisture content in the top and bottom plates indicate a higher potential of moisture related damage to this Wall 1 cross-section.
RH-RHx T Tx Time (2 years) T1 - T x T 2 - T x T 3 - T x T4 - T x RH1-RHx RH2-RHx RH3-RHx RH4-RHx RHT Index =∑RHT=∑ (RH-RHX)×(T-TX) RHT RHT RHT RHT
FIG 3: Schematic diagram to explain FIG. 4: Wall 1 - RHT analysis for 80% RH and 0 °C RHT Index calculation.
4.2 Roofs
Two unvented roofs (Figure 1) examined here are Roof 1 (traditional truss with rigid, XPS foam over and glass fibre insulation under sheathing) and Roof 2 (traditional truss with spray-on foam insulation under sheathing). The hygrothermal analyses, using hygIRC-2D, compares the two roofs. Whilst the highest values of RHT indices in both roofs are in the roof tiles, roof 2 shows a higher RHT index in the area of the plywood sheathing and immediately below the sheathing (Figures 6 and 7).
When looking at the total moisture content in the two roofs, Roof 2 has a higher total value of moisture accumulation for most of the year under consideration (Figures 8 and 9). Roof 2 shows significantly higher moisture content in the wood components of the roof, i.e., plywood sheathing and upper truss chords (Figures 10 and 11). The plywood, moisture content in Roof 1 generally varies between 8% and 14% while in Roof 2 it is approximately 5% higher for most of the year, (Figure 10). An estimate of the moisture content in the truss chords was derived from the relative humidity in the insulated space (Figure 11).
FIG. 5: Average moisture content in bottom plate FIG. 6: Roof 1 - RHT analysis for 80% RH and 0°C
FIG. 7: Roof 2 - RHT analysis for 80% RH and 0°C FIG. 8: Moisture accumulation in components of roof 1
4.3 Walls with air leakage
- 7 -
FIG. 11: Roofs - estimate of moisture content in rafters FIG. 12: Wall 3 - 0.3 NLA X ( m ) Y( m ) 0.0 5 0.1 0 .15 0 .2 0 .5 1 1 .5 2 R H T 1 6 00 00 5 60 00 5 20 00 4 80 00 4 40 00 4 00 00 3 60 00 3 20 00 2 80 00 2 40 00 2 00 00 1 60 00 1 20 00 8 00 0 4 00 0 X ( m ) Y( m ) 0 .0 5 0.1 0 .15 0 .2 0 .5 1 1 .5 2 RH T1 6 00 00 5 60 00 5 20 00 4 80 00 4 40 00 4 00 00 3 60 00 3 20 00 2 80 00 2 40 00 2 00 00 1 60 00 1 20 00 8 00 0 4 00 0
FIG. 13: Wall 3 - 0.7 NLA FIG. 14: Wall 3 - 1.5 NLA
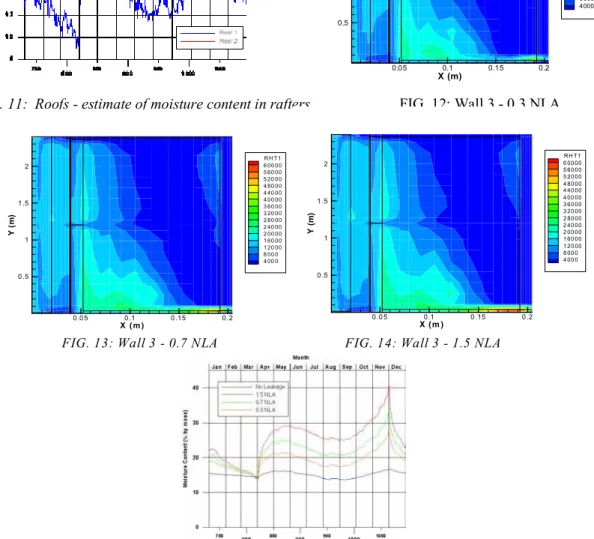
Three levels of air leakage (0.3, 0.7, and 1.5 NLA) were examined on Wall 2 and Wall 3. The RHT analyses from hygrothermal simulations show interesting results for Wall 3 (Figures 12, 13 and 14). There is an area of high hygrothermal loading (i.e. high RHT index) on the interior side of the bottom plate for all three levels of leakage. This area of high hygrothermal loading becomes larger as the level of the air leakage increases. The moisture content in the bottom plate reaches the highest level, and increases with more air leakage (Figure 15).
X (m) Y( m ) 0.05 0.1 0.15 0.2 0.5 1 1.5 2 RHT1 60000 56000 52000 48000 44000 40000 36000 32000 28000 24000 20000 16000 12000 8000 4000
FIG. 15: Wall 3 - Average moisture content in bottom plate
5. Conclusions
• Under conditions with no air leakage, the hygrothermal simulation with hygIRC-2D indicates that the classic cold weather wall, as constructed in Canada, has the highest intensity of overall hygrothermal response.
• Air leakage condition has been simulated in both the Super E®
wall, and the low cost wall. These simulations show increasing the air leakage through the wall assembly results in higher levels of moisture in the bottom plate.
• The unvented roof simulations show that roof tile is the most vulnerable to high temperatures and moisture levels. The roof with rigid, XPS foam over and glass fibre insulation under the sheathing has resulted in lower moisture contents in the wood components of the construction.
6. References
Djebbar, R., Kumaran, M.K., Van Reenen, D. and Tariku, F. (2002). Hygrothermal Modelling of Building Envelope Retrofit Measures in Multi-unit Residential and Commercial Office Buildings. IRC/NRC,
National Research Council, Ottawa, Canada, Client Final Report B-1110.3, pp. 187.
Hagentoft, C-E., Adan, O., Adl-Zarrabi, B., Becker, R.; Brocken, H., Carmeliet, J., Djebbar, R., Funk, M., Grunewald, J., Hens, H., Kumaran, M.K., Roels, S., Kalagasidis, A.S., Shamir, D. (2004). Assessment Method of Numerical Prediction Models for Combined Heat, Air and Moisture Transfer in Building Components: Benchmarks for One-dimensional Cases. Journal of Thermal Envelope and Building
Science, v. 27, no. 4, April 2004, pp. 327-352.
Hens, H. (1996). Heat, air and moisture transport, Final Report, Vol. 1, Task 1: Modelling, International Energy
Agency, Annex 24, Laboratorium Bouwfysica, K. U.-Leuven, Belgium.
Karagiozis, A. (1997). Analysis of the Hygrothermal Behaviour of Residential High-rise Building Components. Client Report A-3052.4, IRC/NRC, National Research Council Canada, Ottawa.
Kumaran, K., Lackey, J., Normandin, N., Tariku, F and van Reenen, D. (2004). A Thermal and Moisture Transport Property Database for Common Building and Insulating Materials, Final Report from ASHRAE
Research Project 1018-RP, pp. 1-229.
Kumaran, K., Lackey, J., Normandin, N., van Reenen, D. and Tariku, F. (2002). Summary report from Task 3 of MEWS project. Institute for Research in Construction, National Research Council, Ottawa, Canada, (NRCC-45369), pp. 1-68.
Kumaran M. K., Mukhopadhyaya P., Cornick S. M., Lacasse, M. A., Maref W., Rousseau M., Nofal M., Quirt J. D. & Dalgliesh W. A. (2003). An Integrated Methodology to Develop Moisture Management Strategies for Exterior Wall Systems. 9th Conference on Building Science and Technology, Vancouver, Canada, pp. 16.
Maref, W., Kumaran, M. K., Lacasse, M. A. Swinton, M. C. and van Reenen, D. (2002). Advanced Hygrothermal Model hygIRC: Laboratory Measurements and Benchmarking. 12th International Heat
Transfer Conference, Grenoble, France, pp. 1-6.
Mukhopadhyaya, P., Lackey J., Normandin N., Tariku F., and van Reenen, D. (2004). Hygrothermal Performance of Building Envelope Retrofit Options: Task 1 - A Thermal and Moisture Transport Property Database, IRC/NRC, National Research Council Canada, Ottawa, Client Final Report, pp. 1-37, (B-1137.5).
Mukhopadhyaya, P. and Kumaran, M. K. (2001). Prediction of Moisture Response of Wood Frame Walls Using IRC’s Advanced Hygrothermal Model (hygIRC). 2nd Annual Conference on Durability and Disaster
Mitigation in Wood-Frame Housing, pp. 221-226.
Mukhopadhyaya, P. Kumaran, M. K. van Reenen, D. and Tariku F. (2001). Influence of Sheathing Membrane and Vapour Barrier on Hygrothermal Response of Stucco Walls, International Conference on Building
Envelope Systems and Technologies (ICBEST), Vol. 1, pp. 269-274.
Mukhopadhyaya, P., Kumaran, K., Rousseau, M., Tariku, F. van Reenen, D., and Dalgliesh, W.A. (2003). Application of Hygrothermal Analyses to Optimise Exterior Wall Design, Research in Building Physics, Sept. 14-18, Lueven, Belgium, pp. 417-426.
Mukhopadhyaya, P., and van Reenen, D. (2007). Assessment of Moisture Performance of Wood-frame Walls in China and Taiwan, IRC/NRC, National Research Council Canada, Ottawa, Client Final Report, pp. 1-176, (B1083.1).
Nofal, M. and Morris, P.I. (2003). Criteria for Unacceptable Damage on Wood Systems, Japan-Canada
Conference on Building Envelope, Vancouver, Canada, 6/4/2003, pp. 1-14.
Swinton, M.C.; Sander, D.M., 1994. "Trade-off Compliance for Houses: Specifications for Calculation Procedures for Demonstrating Compliance to the National Energy Code for Houses using Trade-offs”, pp. 46, March 01,(NRCC-39861).
Vinha, J. 2007, Hygrothermal Performance of Timber-Framed External Walls in Finnish Climatic Conditions: A Method for Determining the sufficient Water Vapour Resistance of the Interior Lining of a Wall Assembly, Ph.D. Thesis, Tampere University of Technology.