Publisher’s version / Version de l'éditeur:
ASHRAE Transactions, 117, 2, pp. 1-10, 2011-09-01
READ THESE TERMS AND CONDITIONS CAREFULLY BEFORE USING THIS WEBSITE. https://nrc-publications.canada.ca/eng/copyright
Vous avez des questions? Nous pouvons vous aider. Pour communiquer directement avec un auteur, consultez la première page de la revue dans laquelle son article a été publié afin de trouver ses coordonnées. Si vous n’arrivez pas à les repérer, communiquez avec nous à [email protected].
Questions? Contact the NRC Publications Archive team at
[email protected]. If you wish to email the authors directly, please see the first page of the publication for their contact information.
NRC Publications Archive
Archives des publications du CNRC
This publication could be one of several versions: author’s original, accepted manuscript or the publisher’s version. / La version de cette publication peut être l’une des suivantes : la version prépublication de l’auteur, la version acceptée du manuscrit ou la version de l’éditeur.
Access and use of this website and the material on it are subject to the Terms and Conditions set forth at
Comparison of energy model abstractions for stratified air distribution
systems
Macdonald, I. A.; Rimmer, J.
https://publications-cnrc.canada.ca/fra/droits
L’accès à ce site Web et l’utilisation de son contenu sont assujettis aux conditions présentées dans le site LISEZ CES CONDITIONS ATTENTIVEMENT AVANT D’UTILISER CE SITE WEB.
NRC Publications Record / Notice d'Archives des publications de CNRC:
https://nrc-publications.canada.ca/eng/view/object/?id=270c65c9-127d-4db0-93ff-b2d1e44e56ae https://publications-cnrc.canada.ca/fra/voir/objet/?id=270c65c9-127d-4db0-93ff-b2d1e44e56ae
Com pa rison of e ne rgy m ode l a bst ra c t ions for st ra t ifie d a ir
dist ribut ion syst e m s
N R C C - 5 4 5 0 5
M a c d o n a l d , I . A . ; R i m m e r , J .
S e p t e m b e r 2 0 1 1
A version of this document is published in / Une version de ce document se trouve dans:
ASHRAE Transactions,
117, (2), pp. 1-10, September-01-11
http://www.nrc-cnrc.gc.ca/irc
The material in this document is covered by the provisions of the Copyright Act, by Canadian laws, policies, regulations and international agreements. Such provisions serve to identify the information source and, in specific instances, to prohibit reproduction of materials without written permission. For more information visit http://laws.justice.gc.ca/en/showtdm/cs/C-42
Les renseignements dans ce document sont protégés par la Loi sur le droit d'auteur, par les lois, les politiques et les règlements du Canada et des accords internationaux. Ces dispositions permettent d'identifier la source de l'information et, dans certains cas, d'interdire la copie de documents sans permission écrite. Pour obtenir de plus amples renseignements : http://lois.justice.gc.ca/fr/showtdm/cs/C-42
Iain A Macdonald is a Research Officer for the National Research Council Canada ([email protected]). Julian Rimmer is a Senior Product Manager for Price Industries.
Comparison of Energy Model
Abstractions for Stratified Air
Distribution Systems
Iain Macdonald, PhD
Julian Rimmer, PE
Member ASHRAE Member ASHRAE
ABSTRACT
Stratified air distribution systems are increasingly being installed in Canadian buildings. Field studies have shown that existing guidelines for their design are often not followed leading to oversizing of systems. Simulation offers a design mechanism whereby the performance of a system can be predicted. This reduces the uncertainty over performance and increases the likelihood that the designed system will perform as intended and be correctly sized.
In recent years several approaches and models have been developed to model stratified air distribution systems (UFAD or Displacement) in energy simulation programs. While models for UFAD are well advanced those for displacement have attracted less attention. In addition much of the research has focussed on cooling season performance, rather than heating season. The focus of this paper is displacement ventilation modelling in heating season.
In the current study predictions are compared to the output from a CFD model. The results show surprisingly little variation between the different energy models in terms of temperature predictions, but a large variation in energy demands. Future work will compare these results to measured data.
INTRODUCTION
The use of stratified air distribution systems has received increased attention recently due to the claims of improved indoor air quality and reduced energy use. Much work originated in Europe [Skistad et al 2004] and since then ASHRAE funded two major projects [Chen and Glicksman 2003, Bauman and Webster 2003]. This work has focussed on the use of stratified systems in a cooling context, and the concepts and predictive tools have been shown to produce acceptable results [Bauman 2007, de Graca and Linden 2004]. Limited research has been undertaken looking at the use of stratified systems in cold climates: can the same advantages as claimed above (improved IAQ and reduced energy use) be achieved compared to overhead ventilation?
correct design procedures for stratified ventilation systems in Canada [Tardif et al 2008]. This research is also showing that although contaminant removal efficiency may be high thermal comfort is not always maintained [Bérubé Dufour et al 2009]. This is primarily due to the perimeter zone heating requirements in Canadian buildings.
Considering a typical office or school building a perimeter zone and core zone can be defined. Typically a perimeter heating system is required to offset the heat loss through the building envelope. In the core zone heating is not required making stratified air distribution an attractive solution (compared to overhead) if the perimeter zone can be successfully decoupled.
REHVA [Skistad et al 2004] list suitable combinations of systems to provide a comfortable environment while maintaining the benefits of a stratified air distribution system. One such combination is low-level perimeter heating (baseboards) with stratified ventilation in the core area. However, little guidance exists on how to match the loads to the systems, how to size the systems correctly and control them. For instance if the core area is overcooled compared to the perimeter zone then the warmer air in the perimeter zone will draw air from the core area; this will have two effects: an increased load on the perimeter system (as envelope losses will be augmented by the advective loss from the core) which will increase the strength of the thermal plumes (from the baseboard heaters) in the perimeter zone leading to the ventilation air being drawn away from the occupants (as the distribution of the ventilation air is driven by the dominant plumes).
Ongoing research aims to examine objectively and subjectively the performance of a stratified ventilation system in combination with electric baseboard heaters in an office environment. Physical measures will be taken to evaluate the thermal comfort, energy use, contaminant removal efficiency and air change effectiveness. These experiments will be followed with subjective analysis using human subjects and questionnaires to evaluate the occupant’s perception of the stratified system compared to typical overhead ventilation. In addition to this simulation and lab work field studies are being conducted to evaluate performance in practice.
This paper describes the modelling work undertaken to date. The focus of the modelling work has been on the subdivision of the space into more representative sub-zones. For the energy modelling a first principles approach has been taken with the open source simulation tool ESP-r (ESRU 2010). In addition the space was modelled using a commercially available CFD tool (CFX [Ansys]). The paper describes the modelling approaches, the results from these models and discusses key differences in the predictions.
METHOD
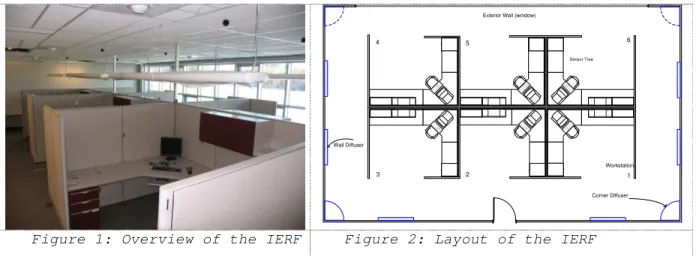
Experimental work will be undertaken at in the Indoor Environment Research Facility (IERF) at the National Research Council Canada, Institute for Research in Construction (NRC-IRC), see Figure 1.
Figure 1: Overview of the IERF Figure 2: Layout of the IERF
The IERF represents a typical office environment with a set of six cubicles (three perimeter and three core). The external wall is a curtain wall system and faces west; all other walls, the floor and ceiling are internal. To facilitate this research the IERF has been retrofitted with a displacement ventilation system. Figure 2 shows the layout of the IERF and the location of the supply diffusers: note that for this study only the wall diffusers were considered. The return air is fully ducted from nine ceiling grills (four parallel to and 1 m from the exterior wall, four parallel to and 1 m from the wall with the door and one central). Baseboard heaters are located along the exterior wall at floor level.
To design the system the heat gains and losses were tabulated. Table 1 shows the heat gains defined for the IERF. Computers and occupants are located in each of the six cubicles, with the computer and monitor on the desk for this analysis. Lighting is provided by a mixture of suspended luminaries (576 W) and ceiling recessed luminaries (448 W). The exterior wall has a U-value of 0.25 W/m2K and area of 12.6 m and the curtain wall 1.4 W/m2K, area 20.8 leading to an overall UA of 32.3 W/K. Outdoor air requirements were set at 51 L/s (ASHRAE 62.1:2004).
Table 1: IERF internal heat gains (W).
Type Convective Radiant Total
Occupants 225 225 450
Equipment 588 252 840
Lighting 512 512 1024
SIMULATIONS
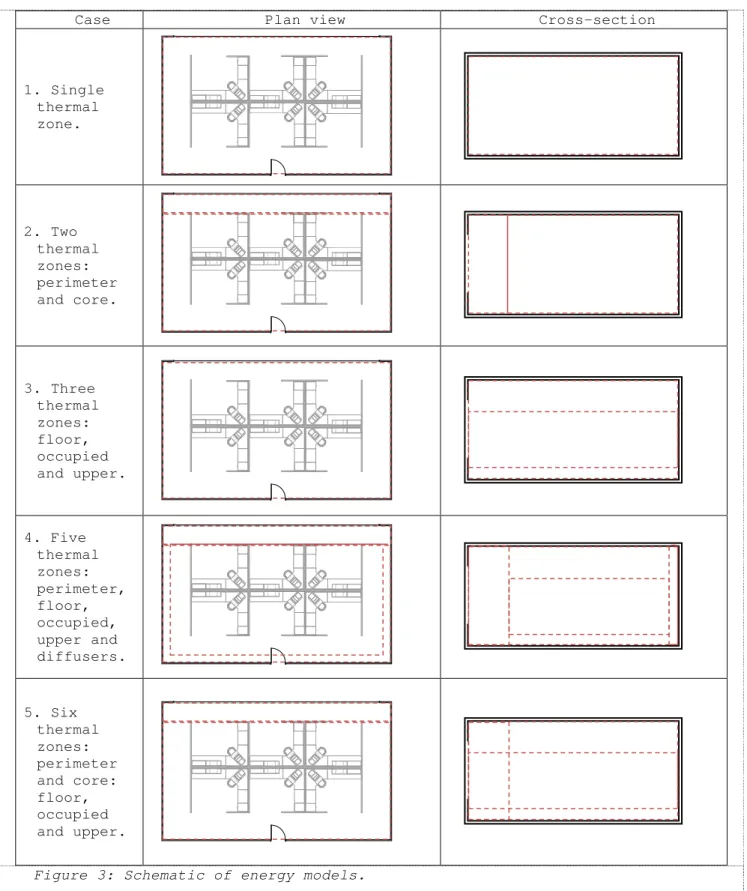
Two simulation approaches have been adopted: CFD and energy simulation. In this study the CFD results will be used as the true results and the output from the energy simulation program tested against them. Full validation will be reported in the future after experiments have been completed. Several abstraction approaches were tested in the use of the energy simulation program (see Figure 3):
1. Model the IERF as a single thermal zone. This should represent the case of overhead ventilation well and overestimate the energy required for the displacement system.
2. Model the IERF as two zones (vertical split): perimeter and core. It is
1 2 3 4 5 6 Corner Diffuser Wall Diffuser Workstation Sensor Tree
expected that this will show the effect of the perimeter heating, but will not improve the displacement model. The depth of the perimeter zone was selected as the width of the circulation space, future work may test this assumption in more detail.
3. Model the IERF as three zones (horizontal split): floor, occupied and above head. It is expected that this approach will capture the performance of the displacement system better that the previous two approaches.
4. Model the IERF as five zones: a single perimeter zone; and adjacent to diffuser, floor, occupied and above head for the core area. It is expected that this model will be close to the performance predicted by the CFD model.
5. Model the IERF as six zones: combination of case 2 and 3. It is expected that this model will be close to the performance predicted by the CFD model.
Energy model
The five models were simulated for a two month period from January to mid-March using a typical Canadian climate (Ottawa, ON) to quantify the energy demands over the winter period. In addition temperature performance characteristics were extracted to examine the suitability of the abstractions for modelling the IERF.
The multi-zone abstractions use three modelling approaches to ensure that they are representative:
1. Heat gains are distributed based on the source’s location.
2. Surfaces between sub zones are set to transmit radiation (long- and short-wave) and not participate in the convection calculations:the convective heat transfer coefficient is set to its minimum allowed value of 0.01 W/m2K and the surface defined as transparent with a high visible transmission and long-wave emissivity (thus solar gains are transmitted by the surface and long-wave is absorbed and re-radiated to the real surfaces).
3. Air is permitted to move between sub zones using a pressure based mass balance calculation. This resolves the stack effect but does not consider momentum effects from plumes (as would be the case with CFD).
Design condition
The morning of January 15th was selected as the design condition for the IERF. Detailed results from the energy model were extracted for this time and used for a CFD simulation of the IERF. The CFD model of the IERF was simulated for these design conditions only. The temperature, velocity and air distribution effectiveness (Ez) values were calculated at critical locations. The air temperature results from the energy model will be compared to the CFD results for this time to judge the suitability of the energy model in predicting key thermal performance indicators.
Case Plan view Cross-section 1. Single thermal zone. 2. Two thermal zones: perimeter and core. 3. Three thermal zones: floor, occupied and upper. 4. Five thermal zones: perimeter, floor, occupied, upper and diffusers. 5. Six thermal zones: perimeter and core: floor, occupied and upper.
Control
Research is showing that effective control is required for successful UFAD/DV use [Bérubé Dufour et al 2009]. It is expected that this will be more critical in this case given the interaction between the perimeter heating and the core area: too much heat in the perimeter will create a dominant thermal plume (drawing supply air away from the occupants), too little and the occupants will not be thermally satisfied.
The approach adopted in this study was to calculate the steady state heat loss through the exterior wall and compensate for this by using low level convective heaters. To satisfy this heat loss a 2 kW capacity heat supply is required, which was supplied by electric baseboard (convective) heaters. In the energy model the heaters are controlled based on the perimeter zone air temperature (set point 21°C), specifically the air temperature was sensed: for case 1 in the single zone; case 2 in the perimeter zone; case 3 in the lower zone; case 4 in the perimeter zone and for case 5 in the lower perimeter zone.
The supply temperature of the displacement system is maintained at a constant 19°C. This is higher than for typical stratified ventilation designs on the basis that the current study is concerned with heating season performance and, as previously mentioned, a balance is required between the perimeter and core control. RESULTS
CFD Model
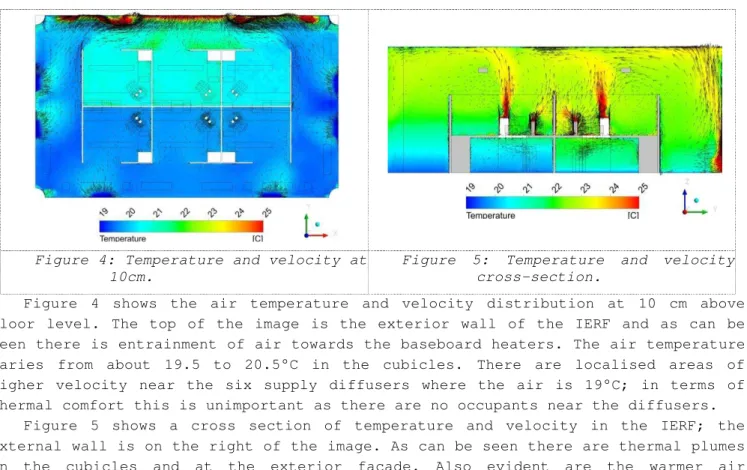
Figure 4: Temperature and velocity at 10cm.
Figure 5: Temperature and velocity cross-section.
Figure 4 shows the air temperature and velocity distribution at 10 cm above floor level. The top of the image is the exterior wall of the IERF and as can be seen there is entrainment of air towards the baseboard heaters. The air temperature varies from about 19.5 to 20.5°C in the cubicles. There are localised areas of higher velocity near the six supply diffusers where the air is 19°C; in terms of thermal comfort this is unimportant as there are no occupants near the diffusers.
Figure 5 shows a cross section of temperature and velocity in the IERF; the external wall is on the right of the image. As can be seen there are thermal plumes in the cubicles and at the exterior façade. Also evident are the warmer air
temperatures in the perimeter cubicles compared to the core cubicles. Taken together this would indicate that the perimeter heating is creating a significant plume, drawing supply air away from the occupants. There is also some recirculation from the upper levels back towards the occupants at the perimeter; thus stratification is not maintained in the perimeter zone with the 2 kW perimeter heating. This demonstrates the difficulty in achieving a balance between perimeter and core space conditioning.
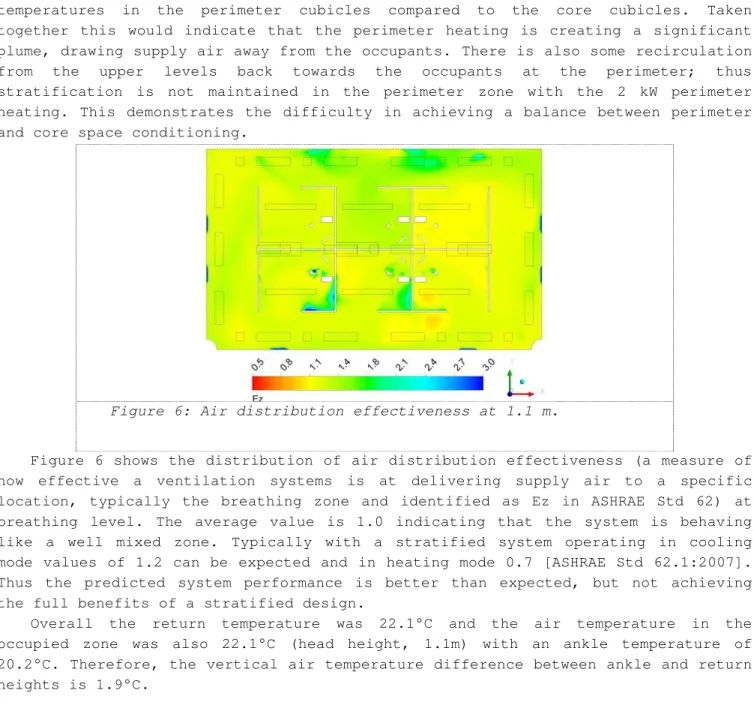
Figure 6: Air distribution effectiveness at 1.1 m.
Figure 6 shows the distribution of air distribution effectiveness (a measure of how effective a ventilation systems is at delivering supply air to a specific location, typically the breathing zone and identified as Ez in ASHRAE Std 62) at breathing level. The average value is 1.0 indicating that the system is behaving like a well mixed zone. Typically with a stratified system operating in cooling mode values of 1.2 can be expected and in heating mode 0.7 [ASHRAE Std 62.1:2007]. Thus the predicted system performance is better than expected, but not achieving the full benefits of a stratified design.
Overall the return temperature was 22.1°C and the air temperature in the occupied zone was also 22.1°C (head height, 1.1m) with an ankle temperature of 20.2°C. Therefore, the vertical air temperature difference between ankle and return heights is 1.9°C.
Energy models
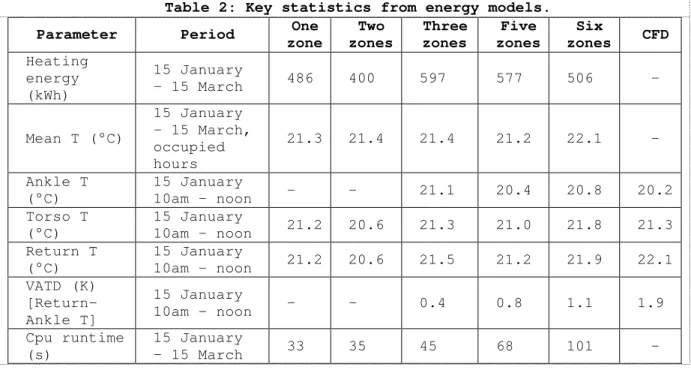
Table 2 shows key statistics from the energy models. There is a large range in heating energy demands: from 400 kWh to 597 kWh. The average temperature in the occupied space over the entire winter period shows less variation: from 21.2°C to 22.1°C. For the design condition the ankle (0.1 m), head (1.1 m) and return air temperature are given where possible. Note the single and two zone abstractions cannot resolve the difference between ankle and torso temperatures. In addition for these two cases the return temperature is equal to the torso temperature. The three, five and six zone models resolve the vertical temperature profile and show that there is an average vertical temperature difference between 0.4 and 1.1°C.
Table 2: Key statistics from energy models.
Parameter Period One
zone Two zones Three zones Five zones Six zones CFD Heating energy (kWh) 15 January – 15 March 486 400 597 577 506 - Mean T (°C) 15 January – 15 March, occupied hours 21.3 21.4 21.4 21.2 22.1 - Ankle T (°C) 15 January 10am - noon - - 21.1 20.4 20.8 20.2 Torso T (°C) 15 January 10am - noon 21.2 20.6 21.3 21.0 21.8 21.3 Return T (°C) 15 January 10am - noon 21.2 20.6 21.5 21.2 21.9 22.1 VATD (K) [Return-Ankle T] 15 January 10am - noon - - 0.4 0.8 1.1 1.9 Cpu runtime (s) 15 January – 15 March 33 35 45 68 101 - DISCUSSION
Comparing the CFD results with the energy simulation results the main observation is that the energy models are showing reasonable agreement. This is surprising for cases 1 and 2 as no attempt has been made to model the stratification in the IERF. However, the three models with stratification do estimate higher return temperatures. The best match is achieved with the 6 zone model (case 5) where the ankle temperature is within 0.6 K, occupied temperature within 0.3 K, return temperature within 0.2 K and VATD within 0.8 K (Vertical Air Temperature Difference, ASHRAE Std 55:2004). This would indicate that the energy model is representing the stratification to a reasonable degree and perhaps most importantly the return temperature is closest to that predicted by the CFD model. An accurate return temperature is crucial for estimating HVAC performance and energy consumption (note in this study a purchased air type system was used so that attention could be concentrated on the building performance rather than the HVAC performance). The variation in total energy demand between energy models will require more research to establish which model is preferable.
In practice the decoupling of the perimeter and core zones will be critical to achieving satisfactory performance of stratified ventilation in the heating season. The CFD results presented here show the effect of large thermal plumes caused by over supplying heat to the perimeter. These plumes will draw the cool supply air away from the other heat sources (e.g. the occupants) potentially causing short circuiting of the ventilation air in the space. This effect has been observed in the ongoing experimental work related to this study. Successful solutions may require improved facade design to reduce the perimeter heat demand and thus reduce the size of the plumes.
CONCLUSIONS
While CFD is the only tool capable of resolving the spatial distribution of contaminants and air temperature in a space using stratified ventilation the energy model with six zones produced comparable results in terms of stratification temperature difference.
Surprisingly although the one and two zone models assume that the air is at a uniform temperature (clearly not the case for a stratified ventilation system) the return temperature is similar to the stratified abstractions.
Ongoing experimental work is required to examine the interaction between the perimeter zones and the core zones when using stratified ventilation in the heating season. A careful balance is required between the thermal plumes from the perimeter heating and those driving the stratification in the occupied spaces.
FUTURE WORK
Ongoing experimental work will provide data against which the CFD and energy models can be compared. This should answer many of the issues highlighted in this study. Once a suitable abstraction strategy for modelling displacement ventilation (in heating season, perimeter and core areas) has been developed, attention can then be focused on how best to interface this to users of energy simulation tools (i.e. simplify the data input).
REFERENCES
Ansys (2010) www.ansys.com
ASHRAE Standard 55 (2004) “Thermal environmental conditions for human occupancy”, American Society of Heating, Refrigerating and Air-Conditioning Engineers, Atlanta.
ASHRAE Standard 62.1 (2004) “Ventilation for Acceptable Indoor Air Quality”, American Society of Heating, Refrigerating and Air-Conditioning Engineers, Atlanta.
ASHRAE Standard 62.1 (2007) “Ventilation for Acceptable Indoor Air Quality”, American Society of Heating, Refrigerating and Air-Conditioning Engineers, Atlanta.
Bauman F, Webster T, Benedek C (2007) “Cooling Airflow Design Calculation for UFAD” ASHRAE Journal, October.
Bauman F and Webster T (2003) “Underfloor Air Distribution (UFAD) Design Guide” American Society of Heating, Refrigerating and Air-Conditioning Engineers, Atlanta.
Bérubé Dufour M, Derome D, Ouazia B, Tardif M, Zmeureanu R, Potvin A and Célis-Mercier S. (2009). “In-Situ performance of Stratified Air Distribution Systems in Two Canadian Buildings” ASHRAE Transactions.
Chen Q. and Glicksman L., (2003). “System Performance Evaluation and Design Guidelines for Displacement Ventilation” RP-949, American Society of Heating, Refrigerating and Air-Conditioning Engineers, Atlanta.
ESRU (2010) www.esru.strath.ac.uk
De Graca G.C. and Linden P.F. (2004) “A simple model for heat transfer in displacement-ventilation”, Proceedings of ROOMVENT 2004: Ninth International Conference on Air Distribution in Rooms, Portugal.
Skistad H., Mundt E., Neilson P.V., Hagstrom K., and Railio J, (2004). “REHVA Guidebook: Displacement ventilation in non-industrial premises, 2nd Edition”
Federation of European Heating and Air-conditioning Associations, Brussels, Belgium.
Mundt, E., (1992). “Convection flows in rooms with temperature gradients – Theory and measurements”, Proceedings of ROOMVENT’92: Third International Conference on Air Distribution in Rooms, Copenhagen.
Tardif M, Ouazia B, Bérubé-Dufour M. Zmeureanu R, Derome D, Celis-Mercier S and Potvin A (2008). “Design engineering review of two Canadian displacement ventilation approaches with in-situ performance measurement of the buildings”, 29th AIVC Conference, 14-16 October 2008, Kyoto, Japan.