Publisher’s version / Version de l'éditeur:
Vous avez des questions? Nous pouvons vous aider. Pour communiquer directement avec un auteur, consultez la première page de la revue dans laquelle son article a été publié afin de trouver ses coordonnées. Si vous n’arrivez pas à les repérer, communiquez avec nous à PublicationsArchive-ArchivesPublications@nrc-cnrc.gc.ca.
Questions? Contact the NRC Publications Archive team at
PublicationsArchive-ArchivesPublications@nrc-cnrc.gc.ca. If you wish to email the authors directly, please see the first page of the publication for their contact information.
https://publications-cnrc.canada.ca/fra/droits
L’accès à ce site Web et l’utilisation de son contenu sont assujettis aux conditions présentées dans le site LISEZ CES CONDITIONS ATTENTIVEMENT AVANT D’UTILISER CE SITE WEB.
2008 IEEE International Ultrasonics Symposium (IUS) [Proceedings], November,
pp. 795-798, 2008
READ THESE TERMS AND CONDITIONS CAREFULLY BEFORE USING THIS WEBSITE. https://nrc-publications.canada.ca/eng/copyright
NRC Publications Archive Record / Notice des Archives des publications du CNRC :
https://nrc-publications.canada.ca/eng/view/object/?id=79886288-ef50-4690-915f-ce1bc4018f26 https://publications-cnrc.canada.ca/fra/voir/objet/?id=79886288-ef50-4690-915f-ce1bc4018f26
NRC Publications Archive
Archives des publications du CNRC
This publication could be one of several versions: author’s original, accepted manuscript or the publisher’s version. / La version de cette publication peut être l’une des suivantes : la version prépublication de l’auteur, la version acceptée du manuscrit ou la version de l’éditeur.
For the publisher’s version, please access the DOI link below./ Pour consulter la version de l’éditeur, utilisez le lien DOI ci-dessous.
https://doi.org/10.1109/ULTSYM.2008.0191
Access and use of this website and the material on it are subject to the Terms and Conditions set forth at
Piezoelectric membrane sensor and technique for breathing monitoring
Ono, Yuu; Mohamed, Dilshad; Kobayashi, Makiko; Jen, Cheng-Kuei
Piezoelectric Membrane Sensor and Technique for
Breathing Monitoring
Yuu Ono, Dilshad Mohamed
Department of Systems and Computer Engineering Carleton University
Ottawa, Ontario, Canada yuuono@sce.carleton.ca
Makiko Kobayashi, Cheng-Kuei Jen
Industrial Materials Institute National Research Council Canada
Boucherville, Quebec, Canada
Abstract—Airflow monitoring is an effective way to diagnose
sleep disorders that are caused by complete or partial cessation of breathing during sleep. For monitoring airflow, a piezoelectric membrane sensor, consisting of a stainless steel foil, a piezoelectric ceramic film and a top electrode, has been developed using a sol-gel spray technique. This sensor has worked as a unimorph-type bending sensor, which could be attached beneath the nose and/or above the mouth using a clip or tape for monitoring breathing. A mathematical model for the sensor output with respect to the airflow speed has been developed using piezoelectric theory and Bernoulli’s law. In addition, a respiration simulator system has been constructed in order to study the sensor response under different airflow conditions such as cycle, volume and temperature. Experimental results with the simulator showed that the sensor output voltage due to piezoelectric effect was proportional to the square of the airflow speed, which agrees with the mathematical model developed, under the experimental conditions employed. A calibration curve was obtained experimentally, which enables measurement of airflow variations quantitatively using the output voltage measured.
Keywords-piezoelectric membrane sensor, unimorph, breathing monitoring, sleep disorder, pyroelectricity
I. INTRODUCTION
Monitoring of breathing conditions during sleeping is one of crucial information for appropriate diagnosis of sleep disorders [1]. Polysomnography in a sleep laboratory is the standard technique for such diagnosis, but the test is expensive and not widely available [2]. Currently a few home devices are commercially available which monitor breathing patterns by measuring temperature variations of breath caused by exhalation and inhalation [3]. However, these devices are not able to provide quantitative information such as airflow rate which is necessary for detailed diagnosis of sleep disorders. Development of low-cost sensors and techniques that can quantitatively monitor breathing for home-based sleep study is desirable for early detection of the symptoms.
We have developed piezoelectric flexible transducers, consisting of a metallic membrane substrate, a thick piezoelectric ceramic film and a top electrode [4]. Due to the porosity inside the film and the thin substrate, the sensor has high flexibility. The transducer can be used as an ultrasonic probe and unimorph-type bending sensor which could be applied in various kinds of industrial applications such as
nondestructive testing, medical diagnosis and physiological monitoring [4, 5].
In this study, feasibility of the piezoelectric unimorph sensor for quantitative airflow monitoring has been investigated. A mathematical model for the sensor output with respect to the airflow speed has been developed. Furthermore, the piezoelectric membrane sensor and respiration simulation system have been designed and constructed. The respiration simulator enables us to investigate the sensor response caused by air pressure due to piezoelectric effect and that by temperature variation due to pyroelectric effect separately. The sensor response to different airflow conditions such as cycle, volume and temperature is discussed using the simulator developed.
II. MATHEMATICAL MODEL
A configuration of the piezoelectric unimorph bending sensor for flow monitoring is illustrated in Fig. 1. One end of the sensor is fixed and the other end is free to move. When the force (F) normal to the sensor surface is applied at the free end of the sensor, the sensor deflects. This deflection induces stress in the piezoelectric film, resulting in the output voltage (VO)
from the sensor due to the piezoelectric effect. When there is no temperature variation, VO can be expressed by the following
equation [6]: F ) 1 B ( AB ) 1 AB ( d wt 3 L s 4 V 31 p p 11 O + + = , (1)
where A = Em/Ep, B = tm/tp, Em and Ep are the Young’s modulus
of the substrate and the piezoelectric film, respectively, tm and
tp are their thickness, L is the length of the free area of the
sensor between the fixed point and the tip, s11p is the elastic
compliance and d31 is the transverse piezoelectric coefficient of
the piezoelectric film.
For airflow monitoring, the applied force F is caused by the airflow pressure normal to the sensor surface. Assuming that compression of air is negligible in our experiments, the relationship between the airflow speed vf and the F can be
obtained from (2) and (3) using Bernoulli’s theorem [7]:
2 f v 2 1 P= ρ Δ (2) S P | F | =Δ ⋅ , (3)
This work was supported by the Natural Sciences and Engineering Research
where ∆P is the pressure difference between the front and back surfaces of the sensor induced by the airflow, ρ is the air density and S is the area of the sensor where the airflow is applied. From (1)-(3), the VO can be written as:
2 f 31 p p 11 O S v ) 1 B ( AB ) 1 AB ( d wt 3 L s 2 V ⎪⎭ ⎪ ⎬ ⎫ ⎪⎩ ⎪ ⎨ ⎧ ρ + + = . (4)
Equation (4) indicates that the sensor output VO is proportional
to the square of the flow speed, vf2. It is noted that a value of V
could be positive or negative in practice depending on the flow direction. Piezoelectric Film Top Electrode Metallic Substrate (Bottom Electrode) Force (F) Vo Output Voltage
Figure 1. A schematic configuration of the piezoelectric unimorph bending sensor for airflow monitoring.
III. SENSOR DEVELOPMENT
Fig. 3 presents a photograph of the piezoelectric unimorph bending sensor developed for airflow monitoring. The sensor consisted of a stainless steel (SS) foil substrate, piezoelectric ceramic film, top electrode and protection film. The lead zirconate titanate composite piezoelectric film was fabricated onto the 40-μm thick SS foil using a sol-gel spray technique [4]. The thickness of the piezoelectric film was 60 μm. The top electrode was constructed using a silver paste. The SS foil served as a bottom electrode as well as the substrate. The dimension of the active transducer area was 4 mm by 20 mm. The sensor was cover with a polymeric film that protected the sensor from the moisture and scratch. This sensor could be attached beneath the nose and/or above the mouth using a clip or adhesive tape for breath monitoring.
Silver Paste (Top Electrode)
Piezoelectric Ceramic Film Stainless Steel Foil
(Bottom Electrode)
Protection Film
Figure 2. A photograph of the piezoelectric unimorph bending sensor developed.
IV. RESPIRATION SIMULATOR SYSTEM
A respiration simulator system has been developed in order to investigate the piezoelectric sensor response to the airflow variations due to breathing, under different airflow conditions such as cycle, volume and temperature. A block diagram of the simulator system is presented in Fig. 3. A piston pump (syringe) having a volume of 500 ml was used to simulate inhalation and exhalation. The airflow volume was controlled by the amount of the piston stroke. The piston was moved back and forth by a hand at the cycle synchronized with an alarm sound from a timing clock. For experiments to study temperature effect on the sensor response, the pump was covered by an electric heater to warm up the air in the pump.
Air Pump
Spiro-meter Piezoelectric Sensor Charge Amplifier A/D Converter Personal Computer Air Flow Signal Electric Heater Temperature Controller Temperature Probe Airflow Chamber
Figure 3. A block diagram of the respiration simulator system developed. The piezoelectric sensor is installed in the airflow chamber.
The airflow produced by the pump passed through the airflow chamber where the piezoelectric sensor was installed as shown in Fig. 3. The airflow chamber was made of a rectangular-shape acrylic tube having the length of 100 mm and the wall thickness of 2 mm with the internal cross-sectional area of 242 mm2 (22 mm by 11 mm). A slit was made through the tube where the sensor was inserted. The fixed end of the sensor was held in the tube using an adhesive tape. This ensured that one end of the sensor was fixed during breathing simulation, while the other end was free inside the chamber. The sensor could be mounted on the airflow chamber in the following two ways: the sensor surface is normal to the airflow in order to have the air pressure response of the sensor due to piezoelectric effect; and parallel to the airflow to eliminate the pressure response and to have solely temperature response due to pyroelectric effect.
The temperature around the sensor increases when heated air flows into the air chamber from the piston pump while it decreases when cooler room-temperature air flows into the chamber by pulling the piston. A temperature probe was attached between the electric heater and the pump for controlling the airflow temperature. In addition, another temperature probe was placed beside the piezoelectric sensor inside the chamber for measuring airflow temperature. The other end of the airflow chamber was connected to a spirometer (Model SPR-BTA, Vernier, USA) so that the flow rate was measured simultaneously. The flow speed around the piezoelectric sensor was calculated by dividing the measured flow rate with the cross-sectional area of the airflow chamber. A charge amplifier (Model 2635, Brüel & Kjær, Denmark) was
used to amplify electric charge signals from the piezoelectric sensor. The sensor output signal, flow rate and temperatures were acquired simultaneously using a multiple-channel analog-digital (A/D) convertor with a sampling rate of 100 Hz and stored in a personal computer for data analysis.
V. EXPERIMENTAL RESULTS AND DISCUSSIONS
A. Pressure Response
In order to investigate the relationship between the sensor output and airflow speed, the sensor was installed in the air chamber, in the simulator in Fig. 3, in such a way that the airflow was perpendicular to the sensor surface. Two sets of experiments were conducted: by changing the airflow volume per pumping from 100 ml to 500 ml in increments of 100 ml at a constant pumping cycle of 30 cycles per minute (cpm); and by changing the pumping cycle from 15 cpm to 75 cpm in increments of 15 cpm at the constant pumping volume of 500 ml. The electric heater was off, thus the air temperature was kept constant at the room temperature during these experiments. The results of the measured output voltage of the sensor and flow speed at the pumping cycle of 30 cpm with the volume of 500 ml are presented in Figs. 4 (a) and (b), respectively. The output voltage changed according to the flow speed variation. It is noted that rapid variations, observed at the peak and valley of the curves of the output voltage and flow speed, were due to that the piston did not move smoothly sometimes. The piston movement accuracy could be improved by using a mechanical translation stage with an electric motor.
Fig. 5 presents the measured output voltages with respect to the flow speed at 30 cpm. It is noted that the gain values of the charge amplifier for the output voltage measurements were different among the different experimental conditions; however, the output voltages in Fig.5 were adjusted to the same gain value. Under the experimental conditions employed, the results with different pumping volumes fell onto the same curve, as seen in Fig. 5. The strength of the output signal increased when the airflow speed increased. Experiments at different pumping cycles with fixed volume of 500 ml also showed the same result. The solid line in Fig.5 is the second-order polynomial fitting curve obtained for the experimental results measured with the volume of 500 ml at 30 cpm (the square symbols in Fig 5). The fitting curve is expressed by the following equations: ⎩ ⎨ ⎧ > − + − = < − + = ) 0 v ( 087 . 0 ) 50 . 0 v ( 10 . 0 V ) 0 v ( 12 . 0 ) 019 . 0 v ( 16 . 0 V f 2 f O f 2 f O (5)
It is shown in (5) that the VO is proportional to the vf2, as
derived in (4), though there are slight offset values both on the VO and vf. This fitting curve could be used as a calibration
curve to determine the flow speed from the output voltage measured. The offset values mean that there was the sensor output (VO ≈ −0.1 V) even when vf was zero. A reason for
these offset values is currently not well understood and needs to be investigated further. They could be caused by the distance between the piezoelectric sensor and the spirometer in the simulator, which might result in the time delay between the two measurements. It is also noted in (5) that the magnitude of the
second order coefficient (0.10) for the positive flow was different from that (0.16) for the negative flow. This is probably due to the fact that the sensor was slightly curved towards the SS substrate at the neutral condition (i.e. no airflow) because of residual stress inside the piezoelectric film and asymmetrical structure of the unimorph sensor.
0 5 10 15 20 -4 -2 0 2 4 -2 -1 0 1 2 (b) F low S peed ( m /s ) Time (s) O ut pu t V ol tage ( V ) (a)
Figure 4. Measured output voltage of piezoelectric sensor (a) and airflow speed obtained from spirometer (b) with respect to the time at the pumping
cycle of 30 cycles per minute for the pumping volume of 500 ml.
-4 -2 0 2 4 -3 -2 -1 0 1 2 3 500 ml 400 ml 300 ml 200 ml 100 ml Out put V olt age (V ) Flow Speed (m/s) Volume
Figure 5. Measured output voltage of the piezoelectric sensor with respect to the airflow speed obtained by the spirometer at a pumping cycle of 30 cycles per minute with different pumping volumes in the range from 100 to 500 ml.
B. Temperature Response
To understand temperature response of the piezoelectric sensor due to pyroelectric effect, the sensor was installed in the air chamber in such a way that the airflow was parallel to the sensor surface so that airflow pressure effect was ignored. The electric heater was applied, in order to simulate air temperature variations due to inhalation and exhalation. The experiments were carried out by changing the airflow volume from 100 ml to 500 ml in increments of 200 ml at the fixed pumping cycle of 30 cpm using the simulator in Fig. 3.
The results of measured output voltage, temperature and flow speed with respect to the measurement time for the
pumping volume of 500 ml are presented in Figs. 6 (a), (b) and (c), respectively. One can see that the temperature increased when the piston was pushed during which the flow speed was positive, while the temperature decreased when the piston was pulled during which the flow speed was negative. Consequently, the output voltage changed according to the temperature variations due to pyroelectric effect. Such pyroelectric effect with the unimorph structure could also induce deflection of the sensor [8], which could generate the secondary piezoelectric effect contributing to the total output voltage measured.
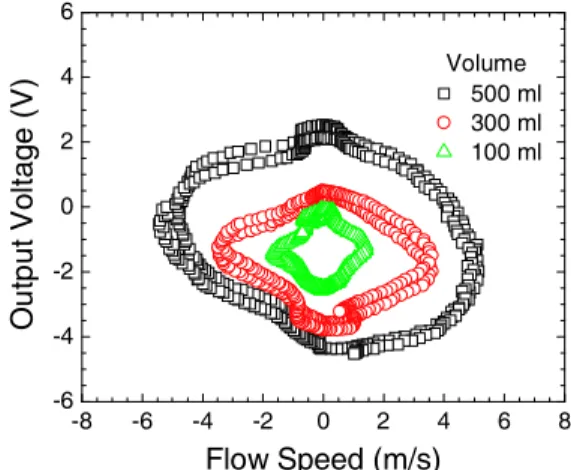
In order to study the relationship between the measured output voltage and flow speed, data acquired for 4 seconds (2 pumping cycles) for each volume are plotted in Fig. 7. It is shown that the output voltage depended not only on the flow speed but also on the pumping volume. In addition, experiments with different pumping cycles but fixed volume showed that the output voltage also depended on the pumping cycle (the data are not shown here). Therefore, it could be difficult to determine flow speed accurately from measured output voltage of the sensor generated by air temperature variations. The sensor output signals due to changes in air temperature could be used to qualitatively monitor presence or absence of breathing. 0 2 4 6 8 10 -8 -4 0 4 8 F low S p eed ( m /s ) Time (s) 34 35 36 37 T em per at ur e ( oC) -4 -2 0 2 4 (c) (b) O ut pu t V ol ta ge ( V ) (a)
Figure 6. Measured sensor output voltage (a), temperature (b) and flow speed (c) with respect to the time at the pumping cycle of 30 cycles per minute
for the pumping volume of 500 ml.
VI. CONCLUDING REMARKS
A piezoelectric membrane sensor, consisting of a stainless steel foil, a piezoelectric ceramic film and a top electrode, has been developed using a sol-gel spray technique. This sensor has worked as a unimorph-type bending sensor, which could be attached beneath the nose and/or above the mouth using a clip or adhesive tape for monitoring breathing. In addition, a respiration simulator system has been developed in order to study the sensor response under different airflow conditions such as cycle, volume and temperature. The simulator was capable of isolating the pressure and temperature responses of the sensor so that these responses can be studied independently.
Experimental results with the simulator showed that the sensor output voltage due to piezoelectric effect was proportional to the square of the airflow speed, which agreed with the mathematical model developed using piezoelectric theory and Bernoulli’s law, under the experimental conditions employed. A calibration curve obtained experimentally enables the measurement of airflow variations quantitatively using the output voltage measured. It is also shown that the output voltage from piezoelectric unimorph sensor was induced by the variations of airflow speed and temperature. Since actual human breathing would cause the variations both in airflow speed and temperature, it would be crucial to separate pyroelectric and piezoelectric effects of the sensor, in order to utilize air pressure for quantitative airflow monitoring. The sensor output signals due to changes in air temperature could be used to qualitatively monitor presence or absence of breathing. -8 -6 -4 -2 0 2 4 6 8 -6 -4 -2 0 2 4 6 500 ml 300 ml 100 ml O u tp ut V ol tage ( V ) Flow Speed (m/s) Volume
Figure 7. Measured output voltage of the sensor due to temperature variation with respect to the airflow speed at the pumping cycle of 30 cycles per minute
with different pumping volumes.
REFERENCES
[1] L.D. Victor, “Obstructive sleep apnea,” Am. Fam. Physician, vol. 60, pp. 2279-2286, 1999.
[2] J.M. Fry, M.A. DiPhillipo, K. Curran, R. Goldberg, and A.S. Baran, “Full polysomnography in the home,” Sleep, vol. 21, pp. 635-642, 1998. [3] T. Shochat, N. Hadas, M. Kerkhofs, A. Herchuelz, T. Penzel, J.H. Peter,
and P. Lavie, “The SleepStripTM: an apnoea screener for the early
detection of sleep apnea syndrome,” Eur. Respir. J., vol. 19, pp. 121-126, 2002.
[4] M. Kobayashi, C.-K. Jen, and D. Lévesque, “Flexible ultrasonic transducers,” IEEE Trans. Ultrason. Ferroelect. Freq. Contr., vol. 53, pp. 1478-1486, 2006.
[5] Y. Ono, M. Kobayashi, Q. Liu, C.-K. Jen, and A. Blouin, “A piezoelectric membrane sensor for biomedical monitoring,” Proc. IEEE Ultrasonics Symp., pp. 800-803, 2006.
[6] Q.-M. Wang, X.- H. Du, B. Xu, and L. Eric Cross, “Electromechanical coupling and output efficiency of piezoelectric bending actuators,” IEEE Trans. Ultrason. Ferroelect. Freq. Contr., vol. 46, pp. 638-646, 1999. [7] T.E. Faber, Fluid Dynamics for Physicists, New York: Cambridge
University, 1995, pp. 1-36.
[8] R. Duggirala, I.-S. Son, and A. Lal, “A pyroelectric-piezoelectric valve for integrated microfluidics,” Proc. IEEE Conf. on Solid State Sensors, Actuators and Microsystems, vol. 2, pp. 1554-1557, 2003.