HAL Id: inserm-02592237
https://www.hal.inserm.fr/inserm-02592237
Submitted on 15 May 2020
HAL is a multi-disciplinary open access
archive for the deposit and dissemination of
sci-entific research documents, whether they are
pub-lished or not. The documents may come from
teaching and research institutions in France or
abroad, or from public or private research centers.
L’archive ouverte pluridisciplinaire HAL, est
destinée au dépôt et à la diffusion de documents
scientifiques de niveau recherche, publiés ou non,
émanant des établissements d’enseignement et de
recherche français ou étrangers, des laboratoires
publics ou privés.
cells in the Drosophila wing
Agnes Banreti, Pascal Meier
To cite this version:
Agnes Banreti, Pascal Meier.
The NMDA receptor regulates competition of epithelial cells in
the Drosophila wing. Nature Communications, Nature Publishing Group, 2020, 11 (1), pp.2228.
�10.1038/s41467-020-16070-6�. �inserm-02592237�
The NMDA receptor regulates competition
of epithelial cells in the Drosophila wing
Agnes R. Banreti
1,2
✉
& Pascal Meier
1
✉
Cell competition is an emerging principle that eliminates suboptimal or potentially dangerous
cells. For
‘unfit’ cells to be detected, their competitive status needs to be compared to
the collective
fitness of cells within a tissue. Here we report that the NMDA receptor controls
cell competition of epithelial cells and Myc supercompetitors in the Drosophila wing disc.
While clonal depletion of the NMDA receptor subunit NR2 results in their rapid elimination
via the TNF/Eiger>JNK signalling pathway, local over-expression of NR2 causes NR2 cells to
acquire supercompetitor-like behaviour that enables them to overtake the tissue through
clonal expansion that causes, but also relies on, the killing of surrounding cells. Consistently,
NR2 is utilised by Myc clones to provide them with supercompetitor status. Mechanistically,
we
find that the JNK>PDK signalling axis in ‘loser’ cells reprograms their metabolism, driving
them to produce and transfer lactate to winners. Preventing lactate transfer from losers to
winners abrogates NMDAR-mediated cell competition. Our
findings demonstrate a functional
repurposing of NMDAR in the surveillance of tissue
fitness.
https://doi.org/10.1038/s41467-020-16070-6
OPEN
1The Breast Cancer Now Toby Robins Research Centre, The Institute of Cancer Research, London, UK.2Université Côte D’Azur, CNRS, Inserm, Institut de Biologie Valrose, Nice, France. ✉email:abanreti@unice.fr;pmeier@icr.ac.uk
123456789
C
ell competition is an evolutionary conserved quality
con-trol process, which ensures that suboptimal, but otherwise
viable, cells do not accumulate during development and
aging
1. How relative
fitness disparities are measured across
groups of cells, and how the decision is taken whether a particular
cell will persist in the tissue (‘winner cell’) or is killed (‘loser cell’)
is not completely understood. This is an important issue as
competitive behaviour can be exploited by cancer cells
1.
Various types of cell competition exist
2. While structural cell
competition is triggered upon loss of cellular adhesion or changes
in epithelial apico-basal polarity, metabolic cell competition
occurs in response to alterations in cellular metabolic states.
Growth signalling pathways involved in metabolic cell
competi-tion seem to funnel through Myc, which funccompeti-tions as an essential
signalling hub in many types of cancers. Myc regulates expression
of components that control proliferation, cell death,
differentia-tion, and central metabolic pathways. Particularly, acute changes
in cellular metabolism appear to be critical for the winner
phe-notype during Myc supercompetition in Drosophila
3, where
robustly growing Myc-expressing cells are able to not only
out-grow but also actively trigger the elimination of nearby wild-type
cells from the tissue.
Recent in vivo data demonstrate that some tumours can uptake
lactate and preferentially utilize it over glucose to fuel
tri-carboxylic acid (TCA) cycle and sustain tumour metabolism
4.
Moreover, the growth-promoting effect of stromal cells is
impaired by glycolytic inhibition, suggesting that the stroma
provides nutritional support to malignant cells by transferring
lactate from cancer-associated
fibroblasts (CAFs) to cancer
cells
5,6. Such energy transfer from glycolytic stromal cells to
epithelial cancer cells closely resembles the physiological
pro-cesses of metabolic cooperativity, such as in
‘neuron-astrocyte
metabolic coupling’ in the brain, and the ‘lactate shuttle’ in the
skeletal muscle
7,8. Activation of glycolysis in astrocytes and
MCT-mediated transfer of lactate to neurons supports neuron
mito-chondrial oxidative phosphorylation and energy demand
9. These
observations raise the intriguing possibility that lactate serves as
fuel to complement glucose metabolism during cell competition.
We report here that the NMDA receptor controls the
com-petitiveness of epithelial cells in the Drosophila wing discs. While
tissue-wide depletion of NR2 has no effect on cell viability and
growth, clonal depletion of NR2 results in their rapid elimination
via the TNF>JNK signalling pathway. Conversely, local
over-expression of NR2 causes NR2-overexpressing cells to acquire
supercompetitor-like behaviour that enables them to overtake the
tissue. These data indicate that relative levels of NR2 underpins
cell competitive behaviour in the wing epithelia. Moreover, we
find that Myc-induced supercompetition also depends on
upre-gulation of NMDAR. Genetic depletion of NR2 abrogates
Myc-induced supercompetition. Mechanistically, we
find that the
JNK>PDK signalling axis in
‘loser’ cells (lower NMDAR) results
in phosphorylation and inactivation of PDH, the enzyme that
converts pyruvate to Acetyl-CoA to fuel the TCA in the
mito-chondria. In such loser cells, phospho-dependent inactivation of
PDH causes mitochondrial shutdown and metabolic
reprogram-ming, thus loser cells produce and secrete lactate to winners.
Preventing lactate transfer from losers to winners removes
fitness
disparities and abrogates NMDAR-mediated cell competition.
Together our data are consistent with the notion that NMDAR
underpins cell competition and that targeting NMDAR converts
Myc supercompetitor clones into superlosers.
Results
NR2 drives cell competition. In Drosophila, polarity-deficient
mutant cells for discs large 1 (dlg1) are eliminated by wild-type
neighbours through cell competition
10. dlg1 is the highly
con-served homologue of mammalian PSD-95 and SAP97. In
mam-mals, PSD-95 and SAP97 directly bind to NR2B
11,12, a subunit of
the N-methyl-D-aspartate receptor (NMDAR). We, therefore,
investigated whether NMDAR takes part in cell competition.
While mammals encode seven different NMDAR subunits,
Dro-sophila encodes only two NMDAR subunits (NR1 and NR2)
(Fig.
1a), which simplifies their study. Consistent with previous
reports
13,14, we
find that Drosophila NR2 is expressed in the
central nervous system, imaginal eye and wing discs as well as
salivary gland and fat body (Supplementary Fig. 1a–c)
14–16. To
study the role of NR2 in cell competition in wing discs, we
generated mosaic tissues of two clonal populations. This
con-fronts wild-type cells (WT) with clones of cells in which the
gene-of-interest (goi) is depleted by RNAi (marked by GFP (green
fluorescent protein)) (Fig.
1b, left panel). We also, generated
homotypic settings in which the goi is depleted tissue-wide, and
where we created GFP-marked
‘non-competitive clones’ to
eval-uate intrinsic competition (Fig.
1b, right panel). Comparison of
clonal occupancy in hetero- versus homotypic genetic
back-grounds of age-matched larvae allows the exclusion of genes
that compromise cell viability in general. Interestingly, clonal
knockdown of NR2 (subsequently referred to as NR2 clones)
using
five different RNAi constructs (Fig.
1a, c, d) resulted in the
loss of NR2 clones (Fig.
1c, d). Likewise, and as previously
demonstrated
17,18, clonal knockdown of dlg1 or scribble (scrib)
resulted in their elimination (Fig.
1d and Supplementary Fig. 2a).
In contrast, clonal depletion of LacZ, which served as RNAi
control, had no effect (Fig.
1c, d). Importantly, RNAi-mediated
depletion of NR2 or dlg1 had no effect on clonal occupancy under
homotypic condition, such as upon tissue-wide NR2 depletion
using nubbin-Gal4 (Fig.
1e, f, and Supplementary Fig. 2b) or
hedgehog (hh-Gal4) (Supplementary Fig. 2c) that drive expression
of the RNAi constructs in the entire wing pouch or posterior
compartment of the Drosophila wing imaginal disc, respectively.
The observation that NR2-depleted cells are lost from the tissue
when surrounded by WT cells, but are present under homotypic
conditions, suggests that clonal depletion of NR2 triggers
com-petitive interactions, resulting in the loss of otherwise viable cells.
Homotypic clonal analysis demonstrated that the intrinsic
growth rate of NR2 clones is equivalent to the one of control LacZ
cells (Fig.
1g), highlighting that NR2 depletion does not impair
cell viability or growth in general. Further, treatment with AP5
((2R)-amino-5-phosphonopentanoate), a selective inhibitor of
NR2
19, suppressed the loss of NR2 clones in a heterotypic genetic
background (losers among winners) (Supplementary Fig. 3a, b),
phenocopying a homotypic setting. This illustrates that the
competitive behaviour between NR2-losers and WT-winners is
due to a relative difference in NR2 activity among competing
clones. AP5-medited global inhibition of NR2 thereby seems to
eradicate the
fitness disparity among competing clones.
Next, we examined the consequence of clonal over-expression
of NR2. As shown in Fig.
1h, i, NR2 over-expressing clones
overgrew at the expense of wild-type surrounding cells. This
suggests that elevated expression of NR2 causes NR2 cells to
acquire supercompetitor-like behaviour that enables them to
overtake the tissue. Of note, clonal over-expression of NR2 did
not alter developmental timing, organ or larval size (Fig.
1j).
Together, our data indicate that relative levels of NR2 underpins
cell competitive behaviour in the wing epithelia.
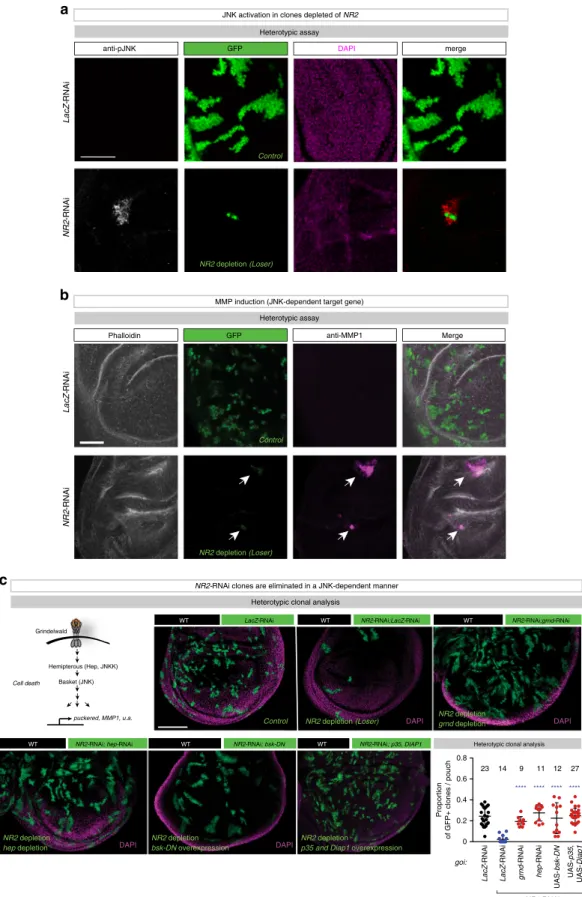
NR2 loser clones are eliminated by TNF > JNK-mediated
apoptosis. To study the elimination process of NR2-depleted
cells, we examined the possible involvement of the
activated JNK [p-JNK] (Fig.
2a), induction of the JNK activity
reporter PucLacZ (Supplementary Fig. 4a) and high expression
level of the JNK target gene MMP1 in and around NR2 clones
(Fig.
2b), suggesting an involvement of JNK signalling.
Con-sistently, while NR2-depleted cells were readily eliminated, such
clones survived upon simultaneous, clonal depletion of the
Dro-sophila TNF-receptor superfamily member grindelwald (grnd)
(grnd-RNAi), hemipterous (hep) (hep-RNAi) or inactivation of
basket (bsk) (UAS-bsk-dominant negative (DN)). This
demon-strates that NR2-depleted clones are eliminated in a grnd- and
JNK-dependent manner (Fig.
2c). JNK signalling in NR2-depleted
clones ultimately resulted in caspase-mediated cell death because
expression of the caspase inhibitors p35 and DIAP1 suppressed
the elimination of NR2-depleted clones (Fig.
2c). Consistently, we
Heterotypic
hsFlp;;ubi-p63 >CD2 >nEGFP nub-Gal4, UAS-gene-of-interest (goi)
b
Gal4 Flippase Gal4 flp STOP hsp70 ubi-p63 hsFlp;;Act >CD2 >Gal4UAS-nEGFP, UAS-gene-of-interest (goi)
negfp shRNA gene-of-interest (goi) UAS UAS Flippase flp STOP hsp70 ubi-p63 shRNA UAS negfp Gal4 nubbin WT GOI + GFP GOI + GFP GOI Gal4
Heterotypic competition assay Homotypic competition assay
Ca2+ NR2 Glycine Glutamate NR1 Out In NMDA receptor NR2 ATD N C LBD Transmembrane domains CTD mRNA TRIP JF 02044 TRIP HMS 02012 VDRC GD 3196 TRIP HMS 02176 TW
a
: RNAi contructs WT LacZ-RNAi NR2-RNAi GD3196f
LacZ-RNAi LacZ-RNAi NR2-RNAi GD3196 De
c
g
Heterotypic clonal analysis
LacZ dlg1 scrib NR2 GD3196 NR2 HMS02176 NR2 TW NR2 HMS02012 NR2 JF02044 0 0.1 0.2 0.3 Proportion of GFP+ clones / pouch **** **** **** **** **** 15 25 7 10 18 19 22 13 **** **** RNAi: (goi) hsFlp;;Act >CD2 >Gal4,UAS-negfp :n LacZ NR2 HMS02176 LacZ dlg1 NR2 GD3196 0 0.2 0.4 0.6 0.8 Proportion of GFP+ clones / pouch ns ns ns 9 10 11 7 5 Homotypic Heterotypic clonal analysis
WT
DAPI
Homotypic clonal analysis
NR2-RNAi GD3196
Homotypic clonal analysis NR2-RNAi TW WT
d
:n RNAi: (goi) DAPIRelative growth under homo-vs. heterotypic settings
Relative growth
rhetero (growth under heterotypic setting) rhomo (growth under homotypic setting)
NR2 HMS02176 LacZ dlg1 NR2 GD3196 RNAi: (goi ) 0 0.2 0.4 0.6 0.8 1.0 **** Proportion of GFP+ clones / pouch 18 19 :n
i
h
Heterotypic competition assay LacZ-RNAi
WT WT UAS-NR2
DAPI
NR2 depletion in clones
NR2 depletion in the entire wing pouch
NR2 overexpression in clones NR2 depletion NR2 depletion 1 × 10⁵ 9 × 10⁴ 8 × 10⁴ 7 × 10⁴ 6 × 10⁴ 5 × 10⁴
Wing pouch size (a.u.)
ns LacZ-RNAi UAS -NR2 LacZ-RNAi UAS -NR2
NR2 overexpression- pouch size NR2 overexpression
Heterotypic clonal analysis Heterotypic clonal analysis
j
:n 8 11 0.0 0.5 1.0 1.5 2.0 11 25 7 15 9 22 5 10:nobserved cells positive for cleaved caspase staining
(Supplemen-tary Fig. 4b). Clonal depletion of NR2 (RNAi) sometimes lead to
distortions of the disc, which most likely was due to the large
amount of cell death (loser clone elimination) that occurs in these
discs.
Metabolic reprogramming and lactate production by losers.
We noticed that NR2-depleted clones appeared to have
mito-chondria that were less active and smaller in size (Fig.
3a, b). To
explore this further, we investigated whether JNK signalling
might influence mitochondrial function in NR2-depleted clones.
Intriguingly, we noticed prominent JNK-dependent
phosphor-ylation of Pyruvate Dehydrogenase (PDH), a key enzyme that
catalyses the conversion of pyruvate into acetyl-CoA to be
con-sumed in mitochondria under heterotypic (Fig.
3c and
Supple-mentary Fig. 5a–d) but not homotypic settings (SuppleSupple-mentary
Fig. 5e). Previous reports indicated that JNK signalling can lead to
activation of the mitochondrial Pyruvate Dehydrogenase Kinase
(PDK), which in turn can phosphorylate and inactivate PDH
21.
Upon phosphorylation of PDH, pyruvate is no longer converted
to acetyl-CoA and therefore no longer available for the TCA in
mitochondria, leading to metabolic reprogramming
22. To test the
importance of PDK-mediated phosphorylation of PDH (p-PDH)
for the elimination of NR2-RNAi loser clones we co-depleted
PDK in such clones. Interestingly, co-depletion of PDK fully
rescued the elimination of NR2 loser clones (Fig.
3d, e) and
abrogated the appearance of cleaved DCP1 positive cells
(Sup-plementary Fig. 5f). Likewise, Gal4-driven expression of PDH in
NR2 loser clones blocked their elimination (Fig.
3e and
Supple-mentary Fig. 6a). In both settings, surviving NR2-depleted clones
were negative for anti-p-PDH staining (Fig.
3d and
Supplemen-tary Fig. 6a). Local over-expression of PDH abrogated JNK
sig-nalling (Supplementary Fig. 6b), highlighting the presence of a
feedback regulatory loop. Together, these data indicate that
PDK-mediated phosphorylation and inactivation of PDH contributes
to the death of NR2-depleted loser clones.
Loser cells transfer their lactate to winners. Since inactivation of
PDH results in aerobic glycolysis, we assessed whether metabolic
reprogramming of NR2-RNAi loser cells might cause elevated
lactate production and secretion (Fig.
4a). To detect relative
differences in lactate levels in loser and winner cells, we used a
genetically encoded lactate reporter (UAS-lactate FRET)
23, which
we expressed throughout the entire tissue (nub-Gal4,
UAS-lactate FRET). Clonal analysis was conducted via the LexA/lexO
binary system
24. We found that NR2-RNAi loser clones had
substantially lower levels of intracellular lactate than
surround-ing wild-type cells or control clones (Fig.
4b). Importantly,
blocking lactate exchange via RNAi-mediated knockdown of
monocarboxylate transporter 1 (Mct1) rescued lactate reduction
in loser cells. Co-depletion of Mct1 not only prevented reduction
of lactate in loser clones but also caused significant lactate
accumulation (Fig.
4c). No such changes in lactate levels were
seen under non-competitive control conditions (Fig.
4c). Ex vivo
treatment with MCT inhibitors (MCTi) also led to a relative
increase of lactate in losers, while it caused a corresponding
decrease of lactate in surrounding winners (Fig.
4d). Feeding
L
-lactic acid (LLA) to animals, like treating them with MCTi,
suppressed lactate reduction in NR2loser clones (Fig.
4e).
Together, these data are consistent with the notion that
NR2-depleted loser cells are metabolically reprogrammed to produce
and secrete lactate.
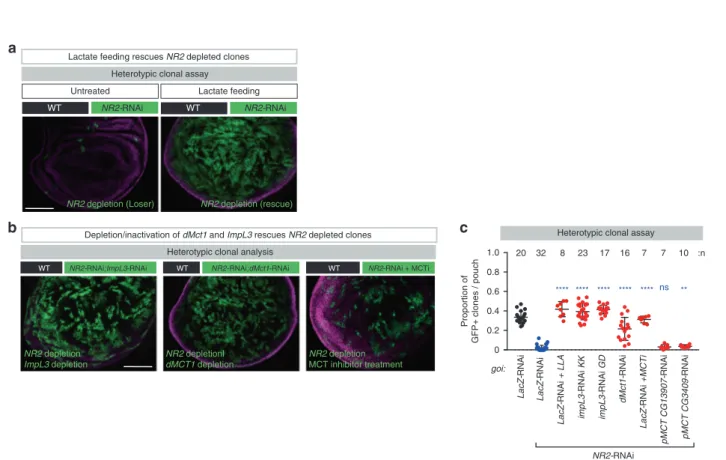
The transfer of lactate underpins cell competition. Next, we
tested the role of lactate exchange in loser cell elimination.
Because lactate feeding restored intracellular lactate levels in
NR2-RNAi clones, we tested whether this might block cell
competition. Intriguingly, lactate feeding inhibited the
elimina-tion of NR2-RNAi clones (Fig.
5a–c). Consistent with the notion
that lactate transport from NR2 losers to winners is important for
loser/winner relationships and cell competition, we found that
blocking loser cells to produce and transport lactate to winner
cells rescued loser cell elimination. Accordingly, concomitant
down-regulation of the lactate dehydrogenase ImpL3 in NR2
loser clones, like co-knockdown of the lactate transporter Mct1,
rescued the elimination of NR2 clones (Fig.
5b, c). This effect was
specific to MCT1, as silencing the putative monocarboxylate
transporters CG13907 or CG3409 within loser clones had no
effect on NR2 loser cell elimination (Fig.
5c). Pharmacological
inhibition of MCT1 also blocked cell competition and the
elimination of NR2 loser clones (Fig.
5b, c). Consistent with these
results, we observed elevated levels of MCT1 in NR2-RNAi cells
(Supplementary Fig. 7). Together, these data suggest that
pre-venting loser cells from transferring lactate to their neighbours
inhibits cell competition.
Fig. 1 Clonal depletion of NR2 results in the elimination of otherwise viable cells. a The N-methyl-D-aspartate receptor (NMDAR) is a hetero-tetrameric
receptor consisting of two NR1 subunits and two NR2 subunits. Linear representation of the modular amino-terminal domain (ATD, green), ligand-binding domain (LBD, blue), transmembrane domains (red) and C-terminal domain (grey). Indicated are the names and position of the respective NR2-RNAi constructs used in this study.b Schematic representation of the genetic systems used to study cell competition in the Drosophila wing pouch. Left panel: Heterotypic genetic system with GFP marking loser clones. Right panel: homotypic genetic system with GFP marking non-competitive clones.c Heterotypic clonal analysis. The indicated genes-of-interest (goi) were knocked down in GFP-marked clones as depicted in a (left panel, see Methods for details). Clones are marked by GFP (green). Specific genotypes of the discs shown in these panels, and all subsequent panels, can be found in Supplementary Table 1. Scale bar 100μm. Experiments were repeated four independent times. d Quantification of the heterotypic competition assay. Diagram shows the average occupancy of the indicated RNAi clones per wing pouch.e Homotypic clonal analysis. The indicated genes-of-interest were knocked down throughout the wing pouch as described in a (right panel). GFP-marked clones represent non-competitive clones. Scale bar 100μm. f Quantification of the homotypic competition assay. Diagram shows the average occupancy of non-competitive clones in the indicated wing pouches where the respective gene-of-interest were knocked down.g Relative rates of growth under hetero- versus homotypic clonal settings. h Heterotypic clonal analysis. NR2 was over-expressed in GFP-marked (green) clones. Specific genotypes of the discs shown in these panels, and all subsequent panels, can be found in Supplementary Table 1. Scale bar 100μm. Experiments were repeated four independent times. i Quantification of the heterotypic competition assay. Diagram shows the average occupancy of the indicated clones per wing pouch.j Quantification of the average size of wing pouches of the indicated genotypes. Error bars represent average occupancy of the indicated RNAi clones per wing pouch ± SD. ****P < 0.0001, ***P < 0.001, **P < 0.01, *P < 0.1 by Mann–Whitney two-tailed nonparametric U-test. (d: NR2-RNAi GD3196 vs dlg1-RNAi (ns) P value: 0.5588, NR2-RNAi HMS02176 vs dlg1-RNAi (ns) P value: 0.0719, NR2 TW vs dlg1-RNAi (ns) P value: 0.7751;j: UAS-NR2 vs. LacZ-RNAi (ns) P value: 0.31). n depicts the number of wing discs. Experiments were repeated three independent times, unless stated otherwise. See Supplementary Table 1 for genotypes.
NR2 -RNAi LacZ-RNAi NR2 -RNAi LacZ-RNAi Control DAPI WT LacZ-RNAi NR2-RNAi; bsk-DN
c
Heterotypic clonal analysis Heterotypic clonal analysis
WT WT NR2-RNAi;LacZ-RNAi WT NR2-RNAi;grnd-RNAi NR2-RNAi; hep-RNAi WT DAPI DAPI DAPI NR2-RNAi; p35, DIAP1 WT Grindelwald Hemipterous (Hep, JNKK) Basket (JNK) puckered, MMP1, u.a. LacZ -RNAi LacZ -RNAi grnd -RNAi UAS-p35 , UAS-Diap1 UAS-bsk-DN hep -RNAi Proportion of GFP+ clones / pouch NR2-RNAi 0 0.2 0.4 0.6 0.8 **** **** **** **** 14 23 9 11 12 27 goi: :n Control
a
Heterotypic assay GFP merge Control anti-pJNK DAPINR2-RNAi clones are eliminated in a JNK-dependent manner JNK activation in clones depleted of NR2
b
Heterotypic assay
Phalloidin GFP anti-MMP1 Merge
MMP induction (JNK-dependent target gene)
Cell death
NR2 depletion (Loser)
NR2 depletion (Loser)
NR2 depletion (Loser) NR2 depletiongrnd depletion
NR2 depletion bsk-DN overexpression NR2 depletion
hep depletion
NR2 depletion
p35 and Diap1 overexpression
Fig. 2 NR2 loser clones are eliminated by apoptosis via the TNF>JNK signalling axis. a Confocal images of wing discs that were immunostained with anti-phospho-JNK. Scale bar 50μm. b Confocal images of wing discs that were immunostained with Phalloidin and anti-MMP1. Scale bar 50 μm. See Supplementary Data Table for genotypes.c Heterotypic clonal analysis. Schematic representation of the TNF>JNK signalling pathway. The indicated genes-of-interest (goi) were knocked down or misexpressed (UAS-bsk-DN or UAS-p35,UAS-Diap1) in GFP-marked clones as depicted in Fig.1b (left panel). Clones are marked by GFP (green). Scale bar 100μm. Quantification of the heterotypic competition assay. Diagram (error bars) shows the average occupancy of the indicated RNAi/over-expression clones per wing pouch ± SD. ****P < 0.0001, ***P < 0.001, **P < 0.01, *P < 0.1 by two-tailed Mann–Whitney nonparametric U-test. n depicts the number of wing discs. Experiments were repeated four independent times. See Supplementary Table 1 for genotypes.
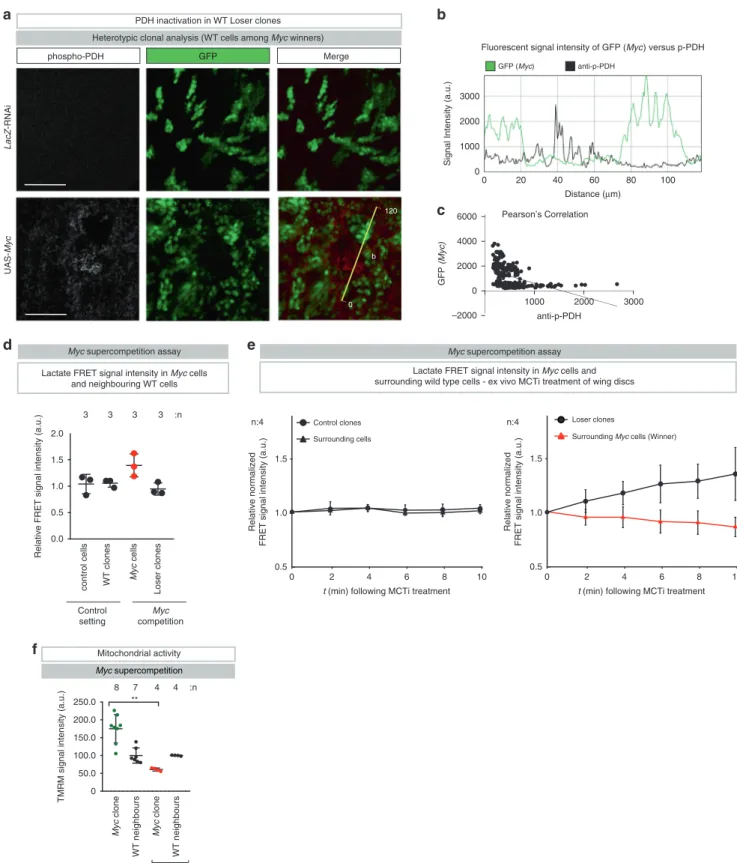
Lactate-mediated metabolic coupling in Myc-supercompetition.
In mosaic wing imaginal discs, interactions between WT and
Myc-expressing cells cause them to acquire
‘supercompetitor’ behaviour
that increases their
fitness and enables them to overtake the tissue
by killing their WT neighbours
25,26. To address whether
lactate-mediated metabolic coupling might also influence
loser/Myc-supercompetitor relationships we
first monitored the
phosphor-ylation status of PDH in competing cell populations. Under
control conditions, no p-PDH staining was apparent in WT cells
(Fig.
6a). However, prominent p-PDH staining was detectable in
e
d
Heterotypic clonal analysis
WT NR2-RNAi;PDK-RNAi NR2-RNAi ;PDK-RNAi NR2-RNAi ;UAS-bsk-Dn 0 0.2 0.4 0.6 0.8 1.0 Proportion GFP+ clones / pouch **** **** 32 20 10 23 :n LacZ-RNAi LacZ-RNAi LacZ-RNAi PDK-RNAi UAS -PDH NR2-RNAi NR2-RNAi
Heterotypic clonal analysis
GFP Merge
anti-phospho-PDH DAPI
c
Heterotypic clonal analysis
anti-betaGal Merge anti-phospho-PDH DAPI
goi:
i
ii ii’ ii’’ ii’‘’
Lactate Pyruvate ImpL3 (LDH) Glucose Mitochondrium PDK PDH NR2-Loser P Grnd Basket (JNK) JNK-dependent PDH inactivation
Depletion of PDK causes clonal rescue
Modulation of PDH and PDK rescues NR2 clones
Surrounding WT cells NR2 -depleted clones 0 1.0 2.0 3.0 4.0 5.0 MitoTracker
Red signal intensity (a.u.)
Mitochondrial size 159 146
b
TMRM signal intensity (a.u.) *** Heterotypic competition Heterotypic competition Mitochondrial activitya
f
Heterotypic competitionModulation of metabolism in loser cells
:n NR2 depletion (Loser) NR2 depletion bsk-DN overexpression NR2 depletion PDK depletion *** Surrounding WT cells LacZ-RNAi clones 0 50.0 100.0 150.0 Surrounding WT cells NR2-depleted clones 8 7 8 7 :n
WT cells that were juxtaposed to Myc winner clones (Fig.
6a–c
and Supplementary Fig. 8a, b) but not homotypic controls
(Sup-plementary Fig. 8c). Accordingly, elevated intracellular lactate
level was detected in Myc cells juxtaposed to loser clones (Fig.
6d).
Consistent with the notion that loser cells produce and
transfer lactate to winners, we found that ex vivo treatment with
MCT inhibitors (MCTi), which blocks lactate exchange, led
to a time-dependent relative increase of lactate in losers, while
it caused a corresponding relative decrease of lactate in Myc
winners (Fig.
6e). This indicates that Myc supercompetitor cells
receive and consume lactate from losers. Accordingly, lactate
feeding suppressed Myc-mediated supercompetition
(Supple-mentary Fig. 8d, e). Moreover, we found that pharmacological
inhibition of MCT1 suppressed Myc supercompetition
(Supple-mentary Fig. 8d–g). Consistently, we found that Myc clones
seemed to have highly active mitochondria whose activity was
dependent on NR2 (Fig.
6f). Together, our data indicate that loser
cells produce and secrete lactate, while winner clones receive and
consume lactate. Our data are in agreement with recent studies
4,27,
demonstrating that in vivo some cancer cells preferentially
con-sume lactate instead of generating lactate as a waste product
28.
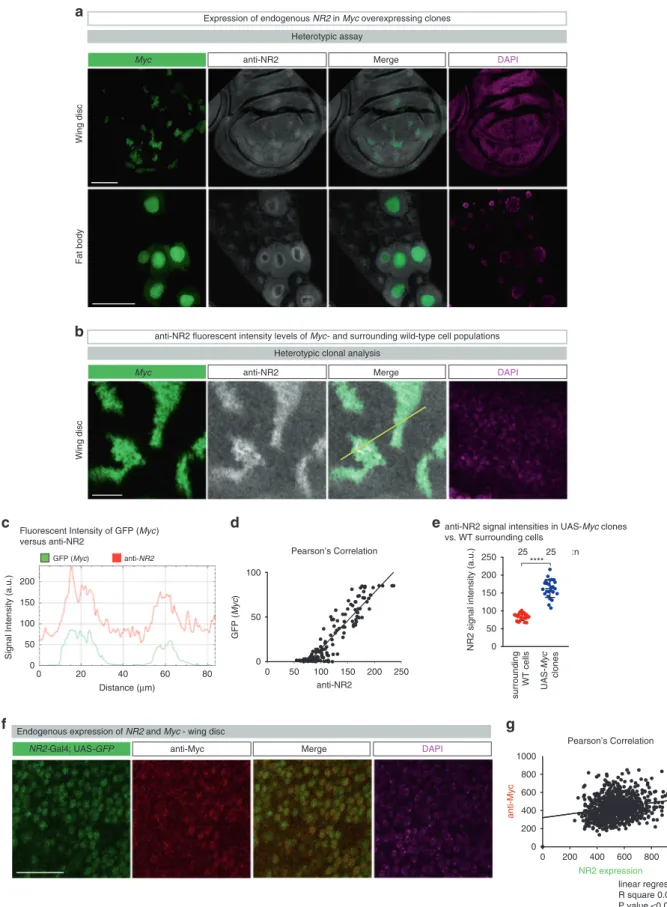
NR2 is required for the supercompetitior status of Myc cells.
To test the potential role of NR2 for the supercompetitor status of
Myc-expressing cells, we
first examined the levels of NR2 in Myc
clones. As shown in Fig.
7a–e, Myc supercompetitor clones
exhibited higher levels of NR2 than surrounding wild-type
neighbours, both in the wing disc as well as fat body.
Further-more, endogenous variation in the expression levels of NR2
(monitored by NR2-Gal4; UAS-GFP) showed a correlation with
Myc expression levels (anti-Myc immunostaining) (Fig.
7f–g).
The upregulation of NR2 was competition-dependent, as in a
homotypic context, no difference in NR2 expression was observed
between Myc expressing cells (driven with hh-Gal4) and
wild-type cells (Supplementary Fig. 9).
To test whether NR2 contributes to the supercompetitor status
of Myc during cell competition, we depleted NR2 in Myc
supercompetitor clones. While clonal expression of Myc on its
own resulted in large clones, such Myc winners were eliminated
when NR2 was simultaneously knocked down in these clones
(Fig.
8a, b). Importantly, Myc-expressing NR2 clones were
eliminated only in heterotypic settings, when surrounded by
WT cells. Accordingly, tissue-wide (nub-Gal4) expression of Myc;
NR2-RNAi did not lead to the elimination of GFP
+
non-competitive clones, demonstrating that such Myc;NR2-RNAi
clones are intrinsically viable (Fig.
8c), but when surrounded by
WT cells are eliminated via cell competition and
caspase-mediated cell death (Fig.
8d). Importantly, under conditions
where NR2 was depleted tissue-wide, Myc clones no longer
acquired supercompetitor status. Accordingly, wild-type cells
(marked with GFP) were no longer eliminated by Myc clones
(Fig.
8e, f). Likewise, treatment with the NMDAR inhibitor
AP5 suppressed Myc supercompetition (Fig.
8g, h). These data
are consistent with the notion that NR2 contributes to the
supercompetitor status of Myc clones.
Discussion
The elimination of unfit cells via competitive interactions plays an
important role for the maintenance of tissue health during
development and adulthood
1,2,29–31. Our data indicate that the
NMDA receptor NR2 influences the competitive behaviour of
epithelia cells and Myc supercompetitors in the Drosophila wing
disc. We
find that genetic depletion of NR2 reprograms
meta-bolism via TNF-dependent and JNK-mediated activation of PDK,
which in turn phosphorylates and inactivates PDH. This causes a
shutdown of pyruvate catalysis and results in a switch to aerobic
glycolysis. Upon phospho-dependent inhibition of PDH, pyruvate
is reduced to lactate via LDH, and secreted
32. While lactate exits
cells to avoid acidification, it can be recaptured and used as
carbon source by other cells, leading to metabolic
compartmen-talisation between adjacent cells. In normal physiology as well as
in murine and human tumours, lactate is an important energy
source that fuels mitochondrial metabolism
4,27. For example,
lactate produced and secreted by astrocytes is transported to
neighbouring neurons where it is used as source of energy to
support neuronal function
33. This is akin of the
‘reverse Warburg
effect’
6, also named
‘two-compartment metabolic coupling’
model, where cancer-associated
fibroblasts (CAFs) undergo
aerobic glycolysis and production of high energy metabolites,
especially lactate, which is then transported to adjacent cancer
cells to sustain their anabolic need
6.
Our data suggest that the epithelial NMDA receptor is
responsible for
fitness surveillance and to provide Myc clones
with supercompetitor status. Cells with decreased epithelial
NMDA receptor are metabolically reprogrammed to transfer
their carbon fuel to their neighbours. According to our model,
differential NMDAR signalling in adjacent cells triggers
lactate-mediated metabolic coupling, and underpins cell competition in
epithelia. Consistently, preventing loser cells from
‘transferring’
lactate to their neighbours, via inhibition of MCT1, Impl3 or
PDK, removes the
fitness disparity and nullifies cell competition.
Likewise, exposure to elevated levels of systemic lactate, blocks
elimination of NR2 loser clones. This suggests that cell
compe-tition may be based on NMDAR-mediated metabolic coupling
between winners and losers. Importantly, this metabolic coupling
only occurs under competitive conditions. Consistently, NR2
losers are only eliminated if they are surrounded by cells with
functional NMDAR. This is evident as tissue-wide inhibition of
NMDAR by AP5, a selective inhibitor of NR2, blocks elimination
of NR2 loser clones in a heterotypic genetic setting.
Fig. 3 The TNF>JNK>PDK>PDH signalling axis reprograms the metabolism of NR2 loser clones. a Quantification of the heterotypic competition assay. Diagram shows the average signal intensity of TMRM staining in RNAi clones and immediately adjacent wild-type cells per wing pouch ± SD. ****P < 0.0001, ***P < 0.001, **P < 0.01, *P < 0.1 by two-tailed Mann–Whitney nonparametric U-test. WT surrounding vs. NR2-RNAi clones ***P value: 0.0003). n depicts the number of cells. See Supplementary Data Table for genotypes.b Quantification of the heterotypic competition assay. Diagram shows the average signal intensity of MitoTracker Red staining in RNAi clones and immediately adjacent wild-type cells per wing pouch ± SD. ****P < 0.0001, ***P < 0.001, **P < 0.01, *P < 0.1 by two-tailed Mann–Whitney nonparametric U-test. (NR2-RNAi vs. WT P value: ***0.0007). n depicts the number of cells. See Supplementary Data Table for genotypes.c Phospho-PDH-specific immunostaining of clones expressing genes-of-interest (goi) and UAS-LacZ. LacZ expression is revealed by anti-βGal staining. Scale bar 25 μm. Experiments were repeated three independent times. d Heterotypic clonal analysis. The indicated gene-of-interest (goi) was knocked down (UAS-PDK-RNAi) in GFP-marked NR2-RNAi clones, and stained for anti-phospho-PDH (ii). Clones are marked by GFP (green). Scale bar 100μm (i) or 50 μm (ii). e Quantification of the heterotypic competition assay. Diagram (error bars) shows the average occupancy of the indicated RNAi clones per wing pouch ± SD. ****P < 0.0001, ***P < 0.001, **P < 0.01, *P < 0.1 by two-tailed Mann–Whitney nonparametric U-test. n depicts the number of wing discs. Experiments were repeated four independent times. See Supplementary Data Table for genotypes.f Schematic representation of the metabolic reprograming of loser cells by the TNF>JNK>PDK>PDH signalling pathway.
We
find that NR2 is upregulated in Myc expressing clones and
that Myc cells co-opt epithelial NR2 to promote cell competition,
subduing their neighbouring wild-type cells that become
re-classified as ‘unfit’. Interestingly, Myc clones lose their
super-competitor status upon tissue-wide depletion of NR2. Under this
condition, WT cells are no longer eliminated and survive among
Myc supercompetitors. This indicates that NR2 underpins
Myc-induced supercompetition. Given that Myc is a major driver of
cancer cell growth, and is a hallmark of the disease in nearly seven
out of ten cases, blocking Myc’s function would be a powerful
0.51.0 1.5
Relative normalized
FRET signal intensity (a.u.)
0 2 4 6 8 10
t (min) following MCTi treatment t (min) following MCTi treatment
d
255 138 22
b
Heterotypic clonal analysis
Lactate FRET (Venus) RFP Merge
LacZ
-RNAi control
NR2-RNAi
NR2-RNAi clones (Loser)
Surrounding WT cells (Winner)
0.5 1.0 1.5 0 2 4 6 8 10 hsFlp; tub >CD2 >lexA lexO-mCherry, lexO-gNR2-RNAi nub-Gal4,UAS-Lactate FRET + hsFlp; tub>CD2>lexA lexO-mCherry, lexO-LacZ
Lactate levels in NR2-RNAi clones and in surrounding WT cells - wing disc
Lactate FRET signal intensity in NR2-RNAi clones and in surrounding cells - ex vivo MCTi treatment of wing discs Heterotypic clonal analysis
Control clones Surrounding cells gene-of-interest (LacZ control or NR2-RNAi) Surrounding cells Lactate Glucose Proliferation growth Mitochondrium PDK Mitochondrium Pyruvate Loser - less NR2 Winner - more NR2 P Heterotypic competition PDH PDH
Lactate exchange between Losers and Winners
a
LacZ NR2 NR2; dMCT1 control; dMCT1 0 50 100 150 200 Relative FRETsignal intensity (a.u.)
****
25 58 25 7
****
:n
Heterotypic clonal analysis
c
RNAi: (goi)
Lactate FRET signal intensity in clones
LacZ NR2 NR2
control
NR2
control
Relative
FRET signal intensity (a.u.)
****
28 72 20 11 23 11 :n
Heterotypic clonal analysis
0 50 100 150 200
e
Lactate FRET signal intensity in clonesRNAi: (goi) Lactate feeding MCT inhibition **** **** or Relative normalized
FRET signal intensity (a.u.)
n:4 n:4
MCT1
Lactate Pyruvate
ImpL3 (LDH)
approach to treat many types of cancer. However, the properties
of the Myc protein itself make it difficult to design a drug against
it. Since the NMDAR signalling circuit is hijacked in many types
of human cancers
34, and its expression level is associated with
poor patient survival, it is attractive to speculate that targeting
NMDAR may be a promising strategy to improve patient care.
Methods
Fly strains. The following strains were used: UAS-LacZ-RNAi35(from M. Miura), UAS-dlg1GD41136-RNAi (Vienna Drosophila Resource Center, VDRC), NR2:Gfp36, UAS-scribTRIP.GL00638-RNAi (Bloomington Drosophila Stock Centre, BDSC),
UAS-NR2TW-RNAi15and UAS-NR2 (from A.S. Chiang), UAS-NR2TRIPJF02044-RNAi
(Bloomington Drosophila Stock Centre, BDSC), UAS-NR2TRIPHMS02012-RNAi
(BDSC), UAS-NR2TRIPHMS02176-RNAi (BDSC), UAS-NR2GD3196-RNAi (VDRC),
UAS-grndKK109939-RNAi (VDRC), UAS-hepGD26929-RNAi (VDRC), UAS-bsk-DN
(BDSC: 6409), UAS-bsk.B (WT bsk, BDSC: 9310), UAS-p35,UAS-DIAP1 (PMID: 10675329), pucE69(puc-LacZ)37, Pdk-RNAiTRiPGL00009(BDSC: 35142), UAS-Pdh
(BDSC: 58765), UAS-lactateFRET23(from B. Hudry), UAS-Mct1KK108618-RNAi
(VDRC), UAS-impL3GD31192-RNAi (VDRC), UAS-impL3KK110190-RNAi (VDRC),
UAS-CG13907KK107339-RNAi (VDRC), UAS-CG3409GD37139-RNAi (VDRC),
UAS-Myc (BDSC: 9674), nub-Gal4 (BDSC: 25754), hh-Gal4 (BDSC:45946 III), NR2 [MI09281-GFSTF.2] (BDSC: 60566), NR2-Gal4 (BDSC: 76705), nub-LexA (BDSC: 54415 and BDSC: 54963), LexO-NR2-RNAi (generated for this study), LexO-RFP-RNAi (generated for this study), LexO-LacZ (BDSC: 7226), for the generation of GFP-marked clones the following strains were used: y,w,hs-flp;;Act > CD2 > Gal4, UAS-nEGFP38(from T. Neufeld) (“>” denotes FRT sites) and Ubi-p63E > STOP > Stringer(nEGFP) (BDSC: 32251), w; tub > myc y+ >Gal4, UAS-GFP/CyO (from L. Johnston), w; tub>CD2>lexA, lexO-mCherry39, w; tub > myc > lexA, Fig. 4 Loser cells transfer their lactate to winners. a Schematic model of NR2-dependent regulation of lactate-mediated metabolic coupling during cell competition.b Heterotypic clonal analysis. The indicated genes-of-interest (goi) were knocked down. Lactate FRET signal was monitored in clones and in surrounding cells in the wing pouch. Clones are outlined with dashed lines and marked by RFP (red). Scale bars 20μm. For genotypes see Supplementary Table 1. Experiments were repeated three independent times.c Heterotypic clonal analysis. The indicated genes-of-interest (goi) were knocked down. Lactate FRET signal was monitored in clones and in surrounding cells in the wing pouch. Diagram shows the relative FRET signal intensity of the indicated RNAi clones per wing pouch ± SD. ****P < 0.0001, ***P < 0.001, **P < 0.01, *P < 0.1 by two-tailed Mann–Whitney nonparametric U-test. n depicts the number of wing discs. For genotypes see Supplementary Table 1.d Heterotypic clonal analysis. Relative normalized lactate FRET signal intensity of clonal cells and surrounding cells of the wing pouch was monitored for 10 min following the administration of MCT inhibitor, ex vivo. Diagrams (error bars) show the average of the relative FRET signal intensity of the indicated clones (control or NR2-RNAi) and that of immediately adjacent wild-type cells per wing pouch, as a function of time ± SD.e Heterotypic clonal analysis. The indicated genes-of-interest (goi) were knocked down. Lactate FRET signal was monitored in clones and in surrounding cells in the wing pouch. Lactate feeding and treatment with MCT inhibitor was conducted as outlined in the Methods section. Diagram (error bars) shows the relative FRET signal intensity of the indicated RNAi clones per wing pouch, using the indicated conditions ± SD. ****P < 0.0001, ***P < 0.001, **P < 0.01, *P < 0.1 by two-tailed Mann–Whitney nonparametric U-test. n depicts the number of wing discs. For genotypes see Supplementary Table 1.
WT NR2-RNAi WT WT LacZ-RNAi LacZ-RNAi impL3-RNAi KK impL3-RNAi GD LacZ-RNAi +MCTi pMCT CG13907-RNAi LacZ-RNAi + LLA dMct1-RNAi pMCT CG3409-RNAi 0 0.2 0.4 0.6 0.8 1.0 **** **** **** ns **** 20 32 8 23 17 16 7 7 10 ** **** NR2-RNAi Proportion of GFP+ clones / pouch :n WT NR2-RNAi WT
a
goi:c
Heterotypic clonal assay
Lactate feeding Untreated
Lactate feeding rescues NR2 depleted clones
Heterotypic clonal analysis
NR2-RNAi;dMct1-RNAi
NR2-RNAi;ImpL3-RNAi NR2-RNAi + MCTi
Depletion/inactivation of dMct1 and ImpL3 rescues NR2 depleted clones
b
NR2 depletion (Loser) NR2 depletion (rescue)
Heterotypic clonal assay
NR2 depletionl dMCT1 depletion NR2 depletion ImpL3 depletion NR2 depletion MCT inhibitor treatment
Fig. 5 NR2 controls cell competition by regulating lactate-mediated metabolic coupling between winners and losers. a, b Heterotypic clonal analysis. The indicated genes-of-interest (goi) were knocked down and over-expressed in GFP-marked clones. For genotypes see Supplementary Data Table. Clones are marked with GFP (green). Lactate feeding and treatment with MCT inhibitor was conducted as outlined in the Methods section. Scale bars 100μm. c Quantification of the heterotypic competition assay. Diagram (error bars) shows the average occupancy of the indicated RNAi clones per wing pouch, using the indicated conditions ± SD. ****P < 0.0001, ***P < 0.001, **P < 0.01, *P < 0.1 by two-tailed Mann–Whitney nonparametric U-test. NR2-RNAi + pMCT CG13907-RNAi vs. NR2-RNAi+ LacZ-RNAi P value: 0.0841; NR2-RNAi + pMCT CG3409-RNAi vs. NR2-RNAi + LacZ-RNAi P value: **0.0011). n depicts the number of wing discs. Experiments were repeated three independent times. See Supplementary Table 1 for genotypes.
phospho-PDH Merge
a
1000 2000 3000 –2000 0 2000 4000 6000 anti-p-PDH GFP (Myc) GFP LacZ-RNAi UAS-MycHeterotypic clonal analysis (WT cells among Myc winners)
b
c
Signal Intensity (a.u.)
Distance (µm) 0 1000 2000 3000 0 20 40 60 80 100 anti-p-PDH GFP (Myc)
PDH inactivation in WT Loser clones
d
WT clones
control cells Loser clones
Myc
cells
Relative FRET signal intensity (a.u.)
Lactate FRET signal intensity in Myc cells and neighbouring WT cells
e
Lactate FRET signal intensity in Myc cells and surrounding wild type cells - ex vivo MCTi treatment of wing discs
Myc supercompetition assay Myc supercompetition assay
0.5 1.0 1.5
Relative normalized
FRET signal intensity (a.u.)
0 2 4 6 8 10
0.5 1.0 1.5
0 2 4 6 8 10
t (min) following MCTi treatment t (min) following MCTi treatment
Control clones
Surrounding cells Surrounding Myc cells (Winner) Loser clones
b
0
120 Pearson’s Correlation
Fluorescent signal intensity of GFP (Myc) versus p-PDH
Control setting Myc competition Myc clone WT neighbours Myc clone WT neighbours
TMRM signal intensity (a.u.)
** tissue-wide NR2-RNAi
f
Myc supercompetition Mitochondrial activity Myc supercompetitionc Relative normalizedFRET signal intensity (a.u.)
:n 8 7 4 4 0 50.0 100.0 150.0 200.0 250.0 0.0 0.5 1.0 1.5 2.0 n:4 n:4 :n 3 3 3 3
Fig. 6 Lactate-mediated metabolic coupling occurs during loser and Myc supercompetition. a Confocal images of dissected wing pouches stained for anti-phospho-PDH (reading out its inactivation). Scale bar 50μm. Experiments were repeated three independent times. b Fluorescent intensities of phospho-PDH (black) and GFP (green) are measured by ImageJ software at the yellow line.c Pearson’s correlation analysis of phospho-PDH and GFP. d, e Heterotypic clonal analysis. Relative normalized lactate FRET signal intensity of clonal cells and surrounding cells of the wing pouch was monitored for 10 min following the administration of MCT inhibitor, ex vivo. See Supplementary Table 1 for genotypes.f Quantification of the heterotypic competition assay. Diagram (error bars) shows the average signal intensity of TMRM staining in UAS-Myc clones and immediately adjacent wild-type cells per wing pouch ± SD. ****P < 0.0001, ***P < 0.001, **P < 0.01, *P < 0.1 by two-tailed Mann–Whitney nonparametric U-test. (UAS-Myc clone with tissue-wide NR2-RNAi vs. UAS-Myc clone on control P value: 0.004). n depicts the number of wing discs. See Supplementary Table 1 for genotypes.
anti-NR2 fluorescent intensity levels of Myc- and surrounding wild-type cell populations
a
Heterotypic assay anti-NR2
b
Myc Merge DAPI
Wing disc
Fat body
Expression of endogenous NR2 in Myc overexpressing clones
Heterotypic clonal analysis anti-NR2
Myc Merge DAPI
c
d
Signal Intensity (a.u.)
Distance (µm) 0 50 100 150 0 20 40 60 80 anti-NR2 GFP (Myc) GFP ( Myc ) Pearson’s Correlation Fluorescent Intensity of GFP (Myc)
versus anti-NR2 200 0 50 100 150 200 250 0 50 100 anti-NR2
e
Wing disc surrounding WT cells UAS-Myc clones 0 50 100 150 200 250NR2 signal intensity (a.u.)
anti-NR2 signal intensities in UAS-Myc clones vs. WT surrounding cells
Endogenous expression of NR2 and Myc - wing disc
0 200 400 600 800 1000 0 200 400 600 800 1000 NR2 expression anti-Myc anti-Myc
NR2-Gal4; UAS-GFP Merge DAPI
linear regression R square 0.0491 9 P value <0.0001
f
g
Pearson’s Correlation **** :n 25 25Fig. 7 NR2 is upregulated in supercompetitior Myc-expressing cells. a, b Immunostaining of imaginal wing discs and fat body, GFP-marked Myc over-expressing clones. NR2 expression is revealed by antibody specific to the Drosophila NR2 subunit. Scale bars 100 and 25 μm, respectively. Experiments were repeated three independent times.c Fluorescent intensities of anti-NR2 (red) and GFP (Myc, green) are measured by ImageJ software at the yellow line.d Pearson’s correlation analysis of anti-NR2 and GFP (Myc). e Mean signal intensities (error bars) of anti-NR2 specific staining in Myc expressing cells (blue) and immediately adjacent wild-type cells (red) ± SD. ****P < 0.0001, ***P < 0.001, **P < 0.01, *P < 0.1 by two-tailed Mann–Whitney nonparametric U-test.f Endogenous expression levels of NR2 (followed by GFP) and Myc (anti-Myc immunostaining). Scale bar 20μm. Experiments were repeated two independent times.g Pearson’s correlation analysis of NR2 (GFP) and Myc (anti-Myc).
lexO-mCherry39, and yw; Act > y > UAS-LacZ (from B. Hudry). See Supplementary Table 1 for genotypes.
Generation oflexO transgenic lines. In all, 21 bp short hairpin sequences tar-geting NR2 (CACTTCAAGTTCACTATCCTA) or RFP (CGAGTTCATCTA-CAAGGTGAA) were chemically synthesised and cloned into pJFRC19 vector.
Transgenes were inserted by phiC31-mediated recombination into the attp-9A docking site on the 3rdchromosome (75A10) (BDSC: 9725).
Fly husbandry. Fly stocks were reared on a standard corn meal/agar diet (6.65% corn meal, 7.15% dextrose, 5% yeast, 0.66% agar, supplemented with 2.2% nipagin and 3.4 ml/l propionic acid). All experimentalflies were kept at RT on a 12 h Heterotypic clonal analysis
b
UAS-Myc 0 0.2 0.4 0.6 0.8 1.0 **** 19 24 23 18 Proportion of GFP+ clones / pouch :nWT LacZ-RNAi WT UAS-Myc;LacZ-RNAi WT UAS-Myc;NR2-RNAi
c
d
0 0.2 0.4 0.6 0.8 Proportion of GFP+ clones / pouch ns ns ns 9 10 11 6 8 :n homotypic heterotypic NR2-RNAi: – + – + LacZ-RNAi: + + + – **** UAS-Myc NR2-RNAi: – + – + LacZ-RNAi: + + – + – – GFP Merge DAPI anti-cDCP1a
control clones Tissue-wide Control -RNAi WT clones Tissue-wide Control -RNAi WT clones Tissue-wide NR2 -RNAi 0 0.2 0.4 Proportion of GFP+ WT clones / pouche
8 15 16 :n WT WT Myc WT MycDepletion of NR2 in Myc overexpressing clones Heterotypic clonal analysis
Depletion of NR2 in Myc overexpressing clones
Depletion of NR2 in Myc overexpressing clones
Depletion of NR2 in Myc overexpressing clones - Caspase activation Heterotypic clonal analysis
Myc-induced supercompetition is inhibited in an NR2-depleted background Myc supercompetition assay
f
Rescue on a lexO-NR2-RNAi background Myc supercompetition assay Myc overexpression (supercompetitor)Myc overexpression NR2 depletion (Loser) WT cells (Loser) NR2-RNAi WT Loser rescue
following tissue-wide NR2 depletion Control-RNAi Myc WT WT Myc AP5 (NR2 inhibitor) Untreated LacZ-RNAi UAS-Myc UAS-Myc + UAS-Myc ; LacZ-RNAi UAS-Myc ; NR2-RNAi LacZ-RNAi + UAS-Myc UAS-Myc + LacZ-RNAi 0.0 0.2 0.4 0.6 **** Proportion of GFP+ clones / pouch AP5 treatment: – – – – homotypic heterotypic
g
19 19 11 4 34 8 :n Pharmacological modulation of NR2Heterotypic clonal analysis (Myc clones among WT cells)
NR2 inhibition
h
****
Hetero- and homotypic clonal analysis Homotypic clonal analysis
light/dark cycle. Fly crosses were set up and kept at RT. Flies were transferred to fresh vials every day, andfly density was kept to a maximum of 15 flies per vial. For clonalflip-out experiments (homotypic and heterotypic assays), flies were allowed to lay eggs in fresh tubes for 3 h. In all, 48 h after egg laying (AEL) larvae were incubated at 37 °C for 10 min to induce transgene expression. Following tem-perature shift, animals were kept at RT. Imaginal wing discs were dissected 48 (for ex vivo lactate FRET experiments) or 72 h after heat-shock-mediated induction of clones.
Homotypic and heterotypic cell competition assays. For the homotypic assays, hsFlp;nub-Gal4;ubi-p63 > STOP > Stringer(nEGFP)flies were crossed to flies car-rying the respective based transgenes. nub-Gal4 drives expression of the UAS-transgene in the entire wing pouch. Heat shock generates nEGFP-positive non-competitive clones, which have the same genotype as the surrounding wing pouch. For heterotypic assays, hsFlp;;act>CD2>Gal4,UAS-nEGFP or hsFlp; tub>CD2>lexA, lexO-mCherryflies were crossed to flies carrying the respective UAS- or lexO-based transgenes. Heat shock generatesflip-out clones, removing the >CD2> cassette, which allows expression of the UAS-based transgenes. Such clones are marked by nEGFP or mCherry expression, respectively. Heterotypic supercompetition assays: based on a similar principle, hsFlp; tub>myc y+ >Gal4, UAS-GFP/CyO or hsFlp; tub>myc >lexA, lexO-mCherry stocks were crossed to UAS- or LexO-based trans-genes and heat shock generatesflip-out clones, removing the tub>myc y+> or >myc>cassettes, respectively.
Immunohistochemistry. Larval tissues were stained using standard immunohis-tochemical procedures. Briefly, discs were dissected in PBS, fixed at room tem-perature for 20 min in 3.7% formaldehyde/PBS and washed in 2% Triton-X100/ PBS. All subsequent incubations were performed in 2% Triton X-100/PBS at 4 °C. Samples were mounted either in Vectashield or Vectashield containing DAPI (Vector Labs). The following primary antibodies were used: mouse anti-dNR215 (1:100, from Ann-Shyn Chiang, mouse anti-dlg1 (1:50, 4F3, DSHB, University of Iowa, Iowa City, IA, USA), mouse GFP (11814460001, Roche), mouse MMP1 (1:50, 5H7B11, DSHB, University of Iowa, Iowa City, IA, USA), rabbit anti-cleaved DCP1 (Asp216) (1:200,Cell Signaling), mouse p-JNK (1:100, 9255,Cell Signaling Technology Inc., Danvers, MA, USA), PHA-555 (Phalloidin-555, A34055, Invitrogen/Molecular probes), mouse polyclonal anti-MCT1 (1:100, ab90582, Abcam), rabbit polyclonal anti-Myc (1:100, d1-717, sc-28207 Santa Cruz Biotechnology), rabbit polyclonal anti-p-PDHE1 (1:200, Pyruvate Dehydrogenase E1-alpha subunit (phospho S293), ab92696, Abcam). Note, the phosphorylation site surrounding S296 of human PDHE1 is conserved in Drosophila PDHE1, which is encoded by lethal(1)G0334 (CG7010) (e-value 5e-36, query coverage of 99%). Fluorescent secondary antibodies (1:2000, FITC-, Cy3- and Cy5-conjugated) were obtained from Jackson Immunoresearch.
TMRM and MitoTracker Red stainings. Mitochondria were stained with 500 nM Tetramethylrhodamine Methyl Ester (TMRM) for 20 min. TMRM staining was recorded with excitation at 543 nm and a 560–615 nm band-pass emission filter. MitoTracker Red CMXRos (M7512, LifeTechnologies) was used at 300 nM in PBS 1% Tween 20 for 10 min.
Lactate feeding and treatments with inhibitors. Following heat shock-mediated clone induction, larvae were placed on standard food containingL-lactate (30 mM, 71718-10G, Sigma Aldrich), the NR2 antagonists AP5 (5μM, A8054, Sigma Aldrich), PEAQX tetrasodium hydrate (0.015μM, 1999, Sigma Aldrich), Ifenprodil-tartarate salt (15μM, I2892, Sigma Aldrich) or the MCT1 inhibitor AR-C155858 (100 nM, Bio-Techne (Tocris)) for 48 h. For ex vivo experiments with dissected wing discs, MCT1 inhibitor was added in afinal concentration of 10 nM into M16 Medium (M7292, Sigma Aldrich).
Lactate measurements using FRET-based metabolite sensor. Imaging experi-ments were performed using dissected imaginal wing discs. A genetically encoded lactate reporter (UAS-lactate FRET)23, was co-expressed within clones expressing gene-of-interest (goi) or UAS-lacZ-RNAi. Alternatively, the sensor was expressed
tissue wide, under the control of nubbin (nub-Gal4 > UAS-lactate FRET). In the latter case, clonal analysis was conducted via the lexA/lexO binary system24, which allowed side-by-side comparison of the lactate FRET signal in clones expressing the lexO-goi or lexO-LacZ and surrounding wild-type cells. The dissected tissues were placed into an openμ-slide (chambered coverslip, ibidi #80826). Fluorescent images were acquired using a ×20, ×40 or ×63 Zeiss objectives on a Zeiss 780 confocal microscope. An Argon laser and MBS458/514 beamline splitter were used with the followingfilter sets: excitation 458 nm, emission 485-526 nm (mTFP channel); excitation 458 nm, emission 526–625 nm (FRET channel) and excitation 514 nm, emission 526–625 nm (Venus channel). For data analysis, regions-of-interest (ROI) were delimited and the average intensity of both mTFP and Venus channels over each ROI were calculated. As the FRET (from mTFP to Venus) inversely correlates, with lactate concentration, to obtain a signal that positively correlates with lactate concentration, the signal intensity of mTFP was divided by Venus signal intensity.
Quantifications. Imaginal discs were imaged at ×20 magnification. Seven Z-stacks were taken for each disc. After imaging, channels were split and max-imum Z-projection was analysed. Using DAPI channel images, a line was drawn around the pouch area and measured using ImageJ. The sum areas of GFP-positive clones were measured using the GFP channel. Threshold was adjusted with the Huang auto-thresholding algorithm to subtract background. The area above the threshold was analysed. Data were collected from at least three independent experiments, and 10 wing discs per genotype and/or condition were analysed, unless stated otherwise. The relative occupancy of GFP-positive clones was quantified, and expressed as proportion of GFP-positive clones per pouch (±S.D.).
Statistics and data presentation. All statistical analyses were carried out using GraphPad Prism7. Comparisons between two genotypes/conditions were analysed with the Mann–Whitney nonparametric two-tailed rank U-test or Pearson’s cor-relation test. Confocal images belonging to the same experiment, and displayed together, were acquired using the same settings. For the purpose of visualization, the same level and channel adjustments were applied using ImageJ. Of note, all quantitative analyses were carried out on unadjusted raw images or maximum projections. Values are presented as average ± standard deviation (S.D.), P-values from Mann–Whitney U-test (non-significant (ns): P > 0.05; *: 0.05 > P > 0.1; **: 0.1 > P > 0.01;***: 0.01 > P > 0.001;****: P > 0.0001 and from Pearson’s analysis α = 0.05.
Reporting summary. Further information on research design is available in the Nature Research Reporting Summary linked to this article.
Data availability
The authors declare that all data supporting thefindings of this study are available within
the article and its Supplementary Informationfiles or from the corresponding author
upon reasonable request.
The original data underlying the followingfigures are provided as a Source Data file:
Figs.1d,1f,1g,1i,2c,3a, b,3e,4c–e,5c,6b–f,7e,8b, c, f, h and Supplementary Figs. 3, 5,
7c–e, 8d, e, 8f, g.
Received: 15 May 2018; Accepted: 8 April 2020;
References
1. Johnston, L. A. Socializing with MYC: cell competition in development and as a model for premalignant cancer. Cold Spring Harb. Perspect. Med. 4, a014274 (2014).
Fig. 8 NR2 is essential for the supercompetitior status of Myc-expressing cells. a Heterotypic supercompetitor clonal analysis. Myc-expressing clones are marked by GFP. LacZ-RNAi or NR2-RNAi were expressed in clones expressing Myc. Experiments were repeated four independent times.
b Quantification of the heterotypic supercompetitor clonal assays. c Homotypic supercompetitor assay. Diagram shows the average occupancy of Myc clones on homotypic background. The indicated genes-of-interest were over-expressed (Myc) and knocked-down (LacZ or NR2) throughout the wing pouch. GFP-marked clones represent non-competitive clones.d Shown are confocal images of wing discs that were immunostained with anti-cleaved DCP1. Scale bar 50μm. e Heterotypic supercompetitor clonal analysis on Control-RNAi or NR2-RNAi depleted backgrounds. Wild-type clones are marked by GFP, among Myc expressing cells. Scale bar 100μm. f Quantification of the heterotypic supercompetitor clonal assays. See Supplementary Table 1 for genotypes.g Heterotypic clonal analysis in the presence or absence AP5, an inhibitor of NR2. Scale bar 100μm. h Quantification of the AP5 treatment assay. Error bars represent average occupancy of the indicated clones per wing pouch ± SD. ****P < 0.0001, ***P < 0.001, **P < 0.01, *P < 0.1 by Mann–Whitney two-tailed nonparametric U-test. (b,: NR2-RNAi, UAS-Myc vs. NR2-RNAi,LacZ-RNAi P value: 0.1247). n depicts the number of wing discs. Experiments were repeated three independent times, unless stated otherwise. See Supplementary Table 1 for genotypes.
2. Claveria, C. & Torres, M. Cell competition: mechanisms and physiological roles. Annu Rev. Cell Dev. Biol. 32, 411–439 (2016).
3. de la Cova, C. et al. Supercompetitor status of Drosophila Myc cells requires p53 as afitness sensor to reprogram metabolism and promote viability. Cell Metab. 19, 470–483 (2014).
4. Faubert, B. et al. Lactate metabolism in human lung tumors. Cell 171, 358–371 e359 (2017).
5. Bonuccelli, G. et al. Ketones and lactate“fuel” tumor growth and metastasis: evidence that epithelial cancer cells use oxidative mitochondrial metabolism. Cell Cycle 9, 3506–3514 (2010).
6. Pavlides, S. et al. The reverse Warburg effect: aerobic glycolysis in cancer associatedfibroblasts and the tumor stroma. Cell Cycle 8, 3984–4001 (2009). 7. Nedergaard, M. & Goldman, S. A. Carrier-mediated transport of lactic acid in
cultured neurons and astrocytes. Am. J. Physiol. 265, R282–R289 (1993). 8. Brooks, G. A. Lactate production under fully aerobic conditions: the lactate
shuttle during rest and exercise. Fed. Proc. 45, 2924–2929 (1986).
9. Brooks, G. A., Dubouchaud, H., Brown, M., Sicurello, J. P. & Butz, C. E. Role of mitochondrial lactate dehydrogenase and lactate oxidation in the intracellular lactate shuttle. Proc. Natl Acad. Sci. USA 96, 1129–1134 (1999).
10. Bilder, D. Epithelial polarity and proliferation control: links from the Drosophila neoplastic tumor suppressors. Genes Dev. 18, 1909–1925 (2004). 11. Kornau, H. C., Schenker, L. T., Kennedy, M. B. & Seeburg, P. H. Domain
interaction between NMDA receptor subunits and the postsynaptic density protein PSD-95. Science 269, 1737–1740 (1995).
12. Niethammer, M., Kim, E. & Sheng, M. Interaction between the C terminus of NMDA receptor subunits and multiple members of the PSD-95 family of membrane-associated guanylate kinases. J. Neurosci. 16, 2157–2163 (1996). 13. Hogan-Cann, A. D. & Anderson, C. M. Physiological Roles of Non-Neuronal
NMDA Receptors. Trends Pharm. Sci. 37, 750–767 (2016). 14. Potier, D. et al. Mapping gene regulatory networks in Drosophila eye
development by large-scale transcriptome perturbations and motif inference. Cell Rep. 9, 2290–2303 (2014).
15. Wu, C. L. et al. Specific requirement of NMDA receptors for long-term memory consolidation in Drosophila ellipsoid body. Nat. Neurosci. 10, 1578–1586 (2007).
16. Xia, S. et al. NMDA receptors mediate olfactory learning and memory in Drosophila. Curr. Biol. 15, 603–615 (2005).
17. Brumby, A. M. & Richardson, H. E. scribble mutants cooperate with oncogenic Ras or Notch to cause neoplastic overgrowth in Drosophila. EMBO J. 22, 5769–5779 (2003).
18. Igaki, T., Pagliarini, R. A. & Xu, T. Loss of cell polarity drives tumor growth and invasion through JNK activation in Drosophila. Curr. Biol. 16, 1139–1146 (2006).
19. Olverman, H. J., Jones, A. W. & Watkins, J. C. L-glutamate has higher affinity than other amino acids for [3H]-D-AP5 binding sites in rat brain membranes. Nature 307, 460–462 (1984).
20. Andersen, D. S. et al. The Drosophila TNF receptor Grindelwald couples loss of cell polarity and neoplastic growth. Nature 522, 482–486 (2015). 21. Zhou, Q., Lam, P. Y., Han, D. & Cadenas, E. Activation of c-Jun-N-terminal
kinase and decline of mitochondrial pyruvate dehydrogenase activity during brain aging. FEBS Lett. 583, 1132–1140 (2009).
22. Kim, J. W., Tchernyshyov, I., Semenza, G. L. & Dang, C. V. HIF-1-mediated expression of pyruvate dehydrogenase kinase: a metabolic switch required for cellular adaptation to hypoxia. Cell Metab. 3, 177–185 (2006).
23. Hudry, B. et al. Sex differences in intestinal carbohydrate metabolism promote food intake and sperm maturation. Cell 178, 901–918 e916 (2019). 24. del Valle Rodriguez, A., Didiano, D. & Desplan, C. Power tools for gene
expression and clonal analysis in Drosophila. Nat. Methods 9, 47–55 (2011). 25. Moreno, E. & Basler, K. dMyc transforms cells into super-competitors. Cell
117, 117–129 (2004).
26. de la Cova, C., Abril, M., Bellosta, P., Gallant, P. & Johnston, L. A. Drosophila myc regulates organ size by inducing cell competition. Cell 117, 107–116 (2004).
27. Hui, S. et al. Glucose feeds the TCA cycle via circulating lactate. Nature 551, 115–118 (2017).
28. Harjes, U. Metabolism: More lactate, please. Nat. Rev. Cancer 17, 707 (2017). 29. Amoyel, M. & Bach, E. A. Cell competition: how to eliminate your neighbours.
Development 141, 988–1000 (2014).
30. Di Gregorio, A., Bowling, S. & Rodriguez, T. A. Cell competition and its role in the regulation of cellfitness from development to cancer. Dev. Cell 38, 621–634 (2016).
31. Baker, N. E. Mechanisms of cell competition emerging from Drosophila studies. Curr. Opin. Cell Biol. 48, 40–46 (2017).
32. Rogatzki, M. J., Ferguson, B. S., Goodwin, M. L. & Gladden, L. B. Lactate is always the end product of glycolysis. Front. Neurosci. 9, 22 (2015). 33. Steinman, M. Q., Gao, V. & Alberini, C. M. The role of lactate-mediated
metabolic coupling between astrocytes and neurons in long-term memory formation. Front. Integr. Neurosci. 10, 10 (2016).
34. Li, L. & Hanahan, D. Hijacking the neuronal NMDAR signaling circuit to promote tumor growth and invasion. Cell 153, 86–100 (2013).
35. Kashio, S. et al. Tissue nonautonomous effects of fat body methionine metabolism on imaginal disc repair in Drosophila. Proc. Natl Acad. Sci. USA 113, 1835–1840 (2016).
36. Nagarkar-Jaiswal, S. et al. A library of MiMICs allows tagging of genes and reversible, spatial and temporal knockdown of proteins in Drosophila. Elife 4, 1–28 (2015).
37. Martin-Blanco, E. et al. puckered encodes a phosphatase that mediates a feedback loop regulating JNK activity during dorsal closure in Drosophila. Genes Dev. 12, 557–570 (1998).
38. Chang, Y. Y. & Neufeld, T. P. An Atg1/Atg13 complex with multiple roles in TOR-mediated autophagy regulation. Mol. Biol. Cell 20, 2004–2014 (2009). 39. Alpar, L., Bergantinos, C. & Johnston, L. A. Spatially restricted regulation of
spatzle/toll signaling during cell competition. Dev. Cell 46, 706–719 e705 (2018).
Acknowledgements
We would like to thank Laura Johnston, Ann-Shyn Chiang, M. Miura and Bruno Hudry for reagents, and Marta Fores Maresma, C. Castilho Soares, Rebecca Wilson, Sidonie Wicky John, Tencho Tenev, Celia Domingues, Katalin Schlett and the iBV PRISM imaging facility for technical assistance. We would like to thank members of the Meier laboratory for discussions and critical reading of the manuscript. We thank Stephane Noselli and his laboratory for his support during the revision period. A.B. was funded by an EMBO Long Term Fellowship (ALTF-48-2014) and an IDEX-Initiative d’excellence Grant. Work in the Meier lab is funded by Breast Cancer Now (CTR-QR14-007) and Biological Sciences Research (BBSRC) (BB/L021684/1). We acknowledge NHS funding to the NIHR Biomedical Research Centre.
Author contributions
A.B. conceived the study, A.B. and P.M designed the experiments, and A.B. performed the experiments. A.B. and P.M. analysed the data and wrote the paper.
Competing interests
The authors declare no competing interests.
Additional information
Supplementary informationis available for this paper at
https://doi.org/10.1038/s41467-020-16070-6.
Correspondenceand requests for materials should be addressed to A.R.B. or P.M.
Peer review informationNature Communications thanks Miguel Torres Sanchez and
the other, anonymous, reviewer(s) for their contribution to the peer review of this work. Peer reviewer reports are available.
Reprints and permission informationis available athttp://www.nature.com/reprints
Publisher’s note Springer Nature remains neutral with regard to jurisdictional claims in
published maps and institutional affiliations.
Open Access This article is licensed under a Creative Commons
Attribution 4.0 International License, which permits use, sharing, adaptation, distribution and reproduction in any medium or format, as long as you give appropriate credit to the original author(s) and the source, provide a link to the Creative Commons license, and indicate if changes were made. The images or other third party
material in this article are included in the article’s Creative Commons license, unless
indicated otherwise in a credit line to the material. If material is not included in the
article’s Creative Commons license and your intended use is not permitted by statutory
regulation or exceeds the permitted use, you will need to obtain permission directly from
the copyright holder. To view a copy of this license, visithttp://creativecommons.org/
licenses/by/4.0/.