HAL Id: hal-02913274
https://hal.archives-ouvertes.fr/hal-02913274
Submitted on 8 Aug 2020HAL is a multi-disciplinary open access
archive for the deposit and dissemination of sci-entific research documents, whether they are pub-lished or not. The documents may come from teaching and research institutions in France or abroad, or from public or private research centers.
L’archive ouverte pluridisciplinaire HAL, est destinée au dépôt et à la diffusion de documents scientifiques de niveau recherche, publiés ou non, émanant des établissements d’enseignement et de recherche français ou étrangers, des laboratoires publics ou privés.
Equilibrium shape of core(Fe)–shell(Au) nanoparticles as
a function of the metals volume ratio
Anne Ponchet, Ségolène Combettes, Patrizio Benzo, Nathalie Tarrat,
Marie-José Casanove, Magali Benoit
To cite this version:
Anne Ponchet, Ségolène Combettes, Patrizio Benzo, Nathalie Tarrat, Marie-José Casanove, et al.. Equilibrium shape of core(Fe)–shell(Au) nanoparticles as a function of the metals volume ratio. Jour-nal of Applied Physics, American Institute of Physics, 2020, 128 (5), pp.055307. �10.1063/5.0014906�. �hal-02913274�
1
Equilibrium shape of core(Fe)-shell(Au) nanoparticles as a function of the
metals volume ratio
A. Ponchet *, S. Combettes, P. Benzo, N. Tarrat, M.J. Casanove and M. Benoit
CEMES-CNRS, Université de Toulouse, UPS, 29 rue Jeanne Marvig, BP 94347 Toulouse Cedex 04 France
Abstract
The equilibrium shape of nanoparticles is investigated to elucidate the various core-shell
morphologies observed in a bimetallic system associating two immiscible metals, iron and gold, that crystallize respectively in the bcc and fcc lattices. Fe-Au core-shell nanoparticles present a crystalline Fe core embedded in a polycrystalline Au shell, with core and shell morphologies both depending on the Au/Fe volume ratio. A model is proposed to calculate the energy of these nanoparticles as a function of the Fe volume, Au/Fe volume ratio, core shape and shell shape, using the DFT-computed energy densities of the metal surfaces and of the two possible Au/Fe interfaces. Three driving forces leading to equilibrium shapes were identified: the strong adhesion of Au on Fe, the minimization of the Au/Fe interface energy that promotes one of the two possible interface types, and the Au surface energy minimization that promotes a 2D-3D Stranski-Krastanov like transition of the shell. For low Au/Fe volume ratio, the wetting is the dominant driving force and leads to the same polyhedral shape for the core and the shell, with an octagonal section. For large Au/Fe ratio, the surface and interface energy minimizations can act independently to form an almost cube-shaped Fe core surrounded by six Au pyramids. The experimental nanoparticles shapes are well reproduced by the model, for both low and large Au/ Fe volume ratios.
* Corresponding author: anne.ponchet@cemes.fr
This is the author’s peer reviewed, accepted manuscript. However, the online version of record will be different from this version once it has been copyedited and typeset.
2
I. INTRODUCTION
Bimetallic nanoparticles (NPs) can be synthesized in different shapes, sizes and structures.
For two immiscible metals, the chemical order can be core-shell, Janus or multi-shell [1-3]. These
morphologies combined to size effects are at the origin of new or exalted properties compared to monometallic NPs. Bimetallics NPs are thus widely investigated for a variety of applications including catalysis, optics, magnetic recording, hyperthermia, magnetically driven drug delivery, bactericidal
actions [1]. In the Fe-Au system, a core-shell order with iron at the core preserves the magnetic
properties of the iron and protects it from oxidation thanks to the gold shell. The latter also ensured the NP biocompatibility. The preservation of the magnetic properties of the core requires to control its crystallinity, its size and the thickness of the protecting shell. As the adsorption of molecules
depends of the crystalline orientation of gold [4], biological applications based on molecule binding
also requires to manage the crystalline quality and orientation of the shell facets.
Predicting the NPs shapes on a rational basis is thus desirable, however it is challenging. Although the usual concepts of the crystal growth remain relevant, as those related to epitaxy, adhesion or elasticity, new models are required to understand the specific geometry of core@shell NPs, that cannot be directly deduced from the structural properties of the two components in their own phase or from the growth modes on a 2D substrate. The case where both core and shell are fcc
crystals was deeply investigated |5, 6]. This contrasts with Fe@Au NPs, a study case where the Fe
core and the Au shell crystallize respectively in the body-centered cubic lattice (bcc) lattice and face-centered cubic (fcc) lattice. Whereas remaining in a core-shell geometry, both core and shell morphologies of Fe@Au NPs strongly evolve as a function of the respective volumes of the two
metals [7]. In this article, we aim at uncovering the mechanisms responsible for this important
morphological evolution. As for some other nanostructures [8], the continuous approach adopted
here provides a theoretical frame to explore the energy landscape as a function of the core and shell
morphologies for NPs of any size, particularly in the typical experimental range (from 1 to 50 nm [7,
9-11]), and as such is a complementary approach to atomistic simulations.
In previous studies [7, 9] nanometric AuFe based NPs were formed at high temperature
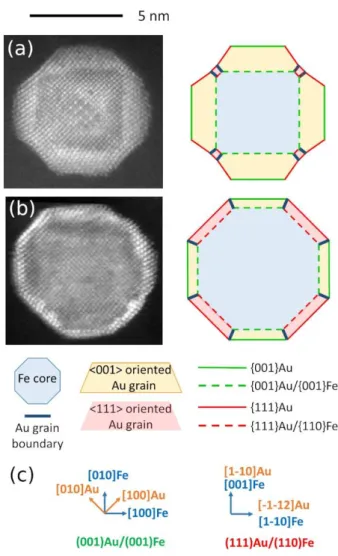
(600°C - 800°C) in an ultra-high vacuum growth process by the sequential deposition of Fe then Au. They exhibit a regular core@shell shape where Fe forms a single crystal with a polyhedral shape, entirely covered by a polycrystalline Au shell. Two morphologies are observed (in the following, we will systematically refer crystallographic notations to either Fe or Au nanocrystal):
In the NPs as that presented in cross-section in Fig. 1(a), the Fe core is close to a perfect <001>Fe oriented cube, and the Au shell consists essentially in six single crystals located on the
This is the author’s peer reviewed, accepted manuscript. However, the online version of record will be different from this version once it has been copyedited and typeset.
3
{001}Fe faces of the cube. Each of these six crystals is {001}Au oriented and is constituted by a thin wetting layer surmounted by a truncated pyramid with 4 {111}Au sides. The dominant interfaces are {001}Au/{001}Fe (green dashed lines in the crystallographic scheme).
In Fig. 1(b) the Fe core appears in cross-section as an octagon. The core can thus be described as a polyhedron limited by {001}Fe and {110}Fe faces. The shell has a homogeneous thickness
without pyramids. Two interfaces coexist: the same {001}Au/{001}Fe interface as in Fig. 1(a), and the {111}Au/{110}Fe interface (red dashed lines in the scheme). The shell is thus formed by 18 different crystallites, 12 <111>Au oriented on the {110}Fe faces and 6 <001>Au oriented on the {001}Fe faces (respectively filled in red and yellow in the scheme).
FIG. 1. Typical NPs for large (a) and small (b) shell/core volume ratio. High resolution
transmission electron microscopy images (left) and corresponding crystallographic models (right). (c) In-plane epitaxial relationships for both interfaces.
This is the author’s peer reviewed, accepted manuscript. However, the online version of record will be different from this version once it has been copyedited and typeset.
4
The {001}Au/{001}Fe interface [7] presents a perfect epitaxial relationship thanks to a 45°
rotation of {001}Au with respect to {001}Fe (Fig. 1(c)). This orientation reduces the effective misfit to
0.6% (the lattice constant of bcc Fe and fcc Au being 0.28665 nm and 0.40784 nm respectively [12])
leading to a pseudomorphic growth of Au on Fe, without dislocations. For the {111}Au/{110}Fe
interface, both theoretical [13] and experimental [14] results agree for the so-called
Nishiyama-Wasserman relationship [13] described in Fig. 1(c). This interface presents a high misfit of 23% along
the <112>Au//<110>Fe direction, while in the <110>Au//<001>Fe direction it is only 0.6%. The shell facets are {001}Au and {111}Au (respectively green and red lines in Fig. 1), which
are the most stable facets in fcc crystals as Au [15, 16].
These two morphologies are highly reproducible and several NPs of various nanometric sizes
similar to the ones displayed in Fig. 1(a) and 1(b) can be found in [7] (and supplemental material) and
in [9]. The two morphologies are not size distributed, but NPs with well-formed pyramids as in Fig.
1(a) are associated to a much larger Au amount compared to Fe amount than the NPs with an octagonal section as in Fig. 1(b). The Au/Fe volume ratios are for instance estimated around 1.6 and 0.65 respectively for the NPs displayed in Fig. 1(a) and Fig. 1(b).
Core@shell NPs with the same crystallographic structure and combining an almost cube-shaped core topped by pyramids as in Fig. 1(a) were also reported in the literature. Thanks to in situ heating, spherical Fe@Au NPs grown at room temperature transformed into an almost cube-shaped
core topped by Au pyramids which are more truncated than in our experiments [10]. A core with a
shape close to a Fe cube topped by thin Au pyramids was also observed in large FeCo@Au NPs [11].
Note also that while the elastic strain relaxation can be at the origin of a strong asymmetry of the
core position in the shell [5], this mechanism seems inoperant here due to the small misfit [9].
The deposition of pure Fe in our experimental setup leads to roughly rounded single crystals
[7]. This shape is the Wulff equilibrium shape of bcc iron [17, 18]: {110} and {100} facets are
dominant and the ratio of their surface energy densities is close to 1, but they are truncated by differently oriented small facets, leading to an iron nanocrystal appearing rounded rather than faceted. We cannot access the detailed scenario of the NPs formation, but we can suppose that the Au shells grow on these nanocrystals.
To elucidate the Fe@Au NP morphology evolution, we investigate the energy landscape of the NPs as a function of their shape and of the Au/Fe volume ratio. For this purpose, in section II we develop a model based on the observed morphologies and we present DFT calculations performed to access the energy densities of all surfaces and interfaces involved in the model. In particular, the energy of the complex {111}Au/{110}Fe interface, which is not available in the literature to our
This is the author’s peer reviewed, accepted manuscript. However, the online version of record will be different from this version once it has been copyedited and typeset.
5
knowledge, is computed. The wetting in the Au/Fe system is predicted in section III in a theoretical frame and we compare the predicted growth mode of Au on a 2D infinite Fe substrate and on a 3D finite Fe nanosubstrate. In section IV, the equilibrium shape (ES) at constant NP volume is explored for a large Au/Fe volume ratio and a small one, and the driving forces leading to the ES, or in some cases to a metastable shape, are discussed. For this purpose, we analyze the pathways allowed in our geometrical model by the core and shell shape transformations. In section V, the ES evolution with Au/Fe volume ratio is discussed and compared to experimental observations.
II. MODEL
A geometrical model describing the NPs morphologies with only 4 independent parameters is proposed. As exploring the energy landscape of a NP requires the consideration of the energies of all surfaces and interfaces, their areas are calculated and DFT calculations of their energy densities are presented.
Note that the elastic energy due to the misfit and the grain boundary energy are not included (this will be justified later on in section V. E.) and that the NPs are considered as free of any external
stress (In our experimental setup, the NPs are formed at the surface of an amorphous Al2O3 substrate
with which they interact, leading to the Volmer-Weber growth mode of the NPs on the substrate [7].
As for Au on alumina [19], the adhesion of Fe@Au NPs on alumina is weak. It thus can be neglected
in the determination of the NP equilibrium shape.)
A. Geometrical model of Fe@Au NPs
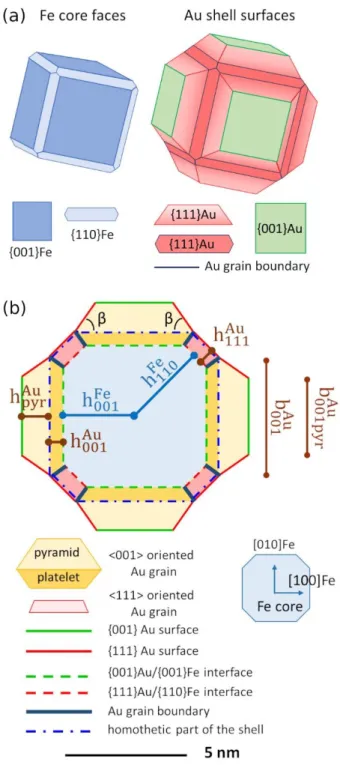
The geometrical model (displayed in 3D in Fig. 2(a) and in cross-section in Fig. 2(b)) is designed to allow progressive transitions between the different observed shapes.
As only {110}Fe and {001}Fe faces are involved at interfaces, we modelled the core by a polyhedron limited by 12 hexagonal {110} and 6 square {001} faces (truncated rhombic
dodecahedron, in blue in Fig. 2). The respective extension of {110}Fe and {001}Fe faces can be modulated, respecting the cubic symmetry. The Fe core can thus be fully described by two
parameters: the Fe volume 𝑉𝐹𝑒, and the aspect ratio
𝑅
𝐹𝑒= ℎ
110𝐹𝑒ℎ
001 𝐹𝑒⁄
(1)
This is the author’s peer reviewed, accepted manuscript. However, the online version of record will be different from this version once it has been copyedited and typeset.
6
where ℎ110𝐹𝑒 and ℎ001𝐹𝑒 are the distances from the core center to the {110}Fe and {001}Fe faces,
respectively (Fig. 2(b)).
FIG. 2. Generic model of a Fe@Au NP. (a) 3D view of the Fe core and Au shell surfaces. (b)
Cross-section. The Fe core shape (in blue) is defined by 𝑅𝐹𝑒 = ℎ110𝐹𝑒 ⁄ℎ001𝐹𝑒 (Eq. (1)). The shell is
decomposed into a part homothetic to the Fe core (limited by the blue dash-dotted line) and 6
pyramids. The shell aspect ratio is defined by 𝑓 = 1 + (ℎ111𝐴𝑢⁄ℎ110𝐹𝑒 ) = 1 + (ℎ
001𝐴𝑢⁄ℎ001𝐹𝑒 ). The platelets
filled in red on the {110}Fe faces are Au<111> oriented crystals. The Au <001> oriented crystals are formed by the platelets on the {001}Fe surfaces (dark yellow) topped by square based pyramids (light
yellow). The NP is built at the scale for 𝑅𝐹𝑒=1.2, 𝑉𝐹𝑒=176 nm3, f=1.16 and 𝑉
𝐴𝑢⁄𝑉𝐹𝑒=1.40. The
corresponding sizes are ℎ001𝐹𝑒 = 2.92 nm, ℎ110𝐹𝑒 =3.50 nm, ℎ001𝐴𝑢=0.58 nm, ℎ111𝐴𝑢=0.70 nm and ℎ𝑝𝑦𝑟𝐴𝑢 =1.19
nm (or t=0.66).
This is the author’s peer reviewed, accepted manuscript. However, the online version of record will be different from this version once it has been copyedited and typeset.
7
The Au shell is geometrically decomposed in a part homothetic to the core (limited in Fig. 2(b) by the interfaces on one side and by the blue dash-dotted line on the other side) and 6 square based pyramids. The Au shell consists in 18 crystallites distributed on the core according to the cubic
symmetry: (i) Twelve are <111>Au oriented platelets grown on the {110}Fe faces with thickness ℎ111𝐴𝑢
(in red in Fig. 2(b)). (ii) The six crystallites grown on the {001}Fe faces are <001>Au oriented (in yellow
in Fig. 2(b)); each of them consists in a platelet of thickness ℎ001𝐴𝑢 topped by one square based
pyramid with four {111}Au facets. The pyramid height is denoted ℎ𝑝𝑦𝑟𝐴𝑢.
The whole shell can be fully described by two parameters, the Au volume 𝑉𝐴𝑢, and one
aspect ratio to express its distribution between the homothetic shell and the pyramids. For
convenience, we chose the aspect ratio f that expresses the expansion from the Fe core (in blue) to the homothetic part of the shell (blue dash-dotted line). f is defined by
𝑓 = 1 + (ℎ111𝐴𝑢 ℎ 110𝐹𝑒 ⁄ ) = 1 + (ℎ001𝐴𝑢 ℎ 001 𝐹𝑒 ⁄ ) (2)
The Fe@Au NP can thus be fully described with only four independent parameters: 𝑉𝐹𝑒 and three
dimensionless parameters 𝑉𝐴𝑢⁄𝑉𝐹𝑒, 𝑅𝐹𝑒 and f.
B. Useful geometrical quantities
Let us now display geometrical quantities derived from these four parameters. These quantities will be useful to describe a NP and to calculate all surface and interface energies involved in the NP energy.
(i) Core (face areas, volume)
The areas of one {001}Fe and one {110}Fe core faces (see Appendix A) are respectively
𝑆001𝐹𝑒 = 4 (ℎ001𝐹𝑒 )2 (√2 𝑅 𝐹𝑒− 1) 2 (3) 𝑆110𝐹𝑒 = 4 (ℎ001𝐹𝑒 )2 (√2 − 𝑅 𝐹𝑒) [(3 √2 4⁄ ) 𝑅𝐹𝑒− 1 2⁄ ] (4)
The Fe volume is found by decomposition of the core in 18 pyramids converging at its center:
𝑉𝐹𝑒= (6 ℎ001𝐹𝑒 𝑆001𝐹𝑒 + 12 ℎ110𝐹𝑒 𝑆110𝐹𝑒) 3⁄ (5)
It comes
This is the author’s peer reviewed, accepted manuscript. However, the online version of record will be different from this version once it has been copyedited and typeset.
8
ℎ001𝐹𝑒 = 𝑉𝐹𝑒1 3⁄ (8 − 12 √2 𝑅𝐹𝑒 (√2 − 𝑅𝐹𝑒)
2
)−1 3⁄ (6)
Equation (6) allows to calculate 𝑆001𝐹𝑒 and 𝑆110𝐹𝑒 as a function of 𝑉𝐹𝑒 and 𝑅𝐹𝑒.
(ii) Part of the Au shell homothetic to the core (areas and volume)
The areas of the top facet of a <001>Au and of a <111>Au oriented platelet are respectively
𝑆001𝐴𝑢 = 𝑓2 𝑆001𝐹𝑒 and 𝑆111𝐴𝑢 = 𝑓2 𝑆110𝐹𝑒 (7)
The volume of the homothetic part of the shell is
𝑉𝐴𝑢ℎ𝑜𝑚𝑜= 𝑉𝐹𝑒 (𝑓3− 1) (8)
(iii) Au pyramids (volume, facet areas, height and truncation rate)
To calculate the pyramid facet areas, we introduce for convenience the dimensionless truncation rate t defined by
𝑡 = 1 − 2 ℎ𝑝𝑦𝑟𝐴𝑢 ⁄(𝑏001𝐴𝑢 tan 𝛽) = 𝑏001𝑝𝑦𝑟𝐴𝑢 ⁄𝑏001𝐴𝑢 (9)
where β=54.7° is the angle between the {001}Au planes and the pyramid facets {111} (tan 𝛽 = √2),
ℎ𝑝𝑦𝑟𝐴𝑢 is the pyramid height, 𝑏001𝐴𝑢 and 𝑏001𝑝𝑦𝑟𝐴𝑢 are the edges of the pyramid basis and of the top facet,
respectively (Fig. 2(b)). Note that t varying from 0 (complete pyramid) to 1 (no pyramid) provides a
direct description of the pyramid shape. 𝑏001𝐴𝑢 is directly related to the basis area 𝑆001𝐴𝑢 by
𝑏001𝐴𝑢 = 𝑆001𝐴𝑢 1 2⁄ = 2 𝑓 ℎ001𝐹𝑒 (√2 𝑅𝐹𝑒− 1) (10)
The volume of one pyramid 𝑉𝐴𝑢𝑝𝑦𝑟 can be written as a function of t
𝑉𝐴𝑢𝑝𝑦𝑟 = 𝑆001𝐴𝑢 3 2⁄ (1 − 𝑡3) (3√2)⁄ (11)
t can therefore be written as
𝑡 = [1 − 6 𝑉𝐴𝑢𝑝𝑦𝑟⁄(√2 𝑆001𝐴𝑢 3/2)]
1 3⁄
(12)
As 𝑉𝐴𝑢𝑝𝑦𝑟 is easy to write as a function of 𝑉𝐹𝑒, 𝑉𝐴𝑢⁄𝑉𝐹𝑒 and f
𝑉𝐴𝑢𝑝𝑦𝑟 = (𝑉𝐴𝑢− 𝑉𝐴𝑢ℎ𝑜𝑚𝑜) 6⁄ = [(𝑉𝐴𝑢⁄𝑉𝐹𝑒) + 1 − 𝑓3] 𝑉
𝐹𝑒 6⁄ (13)
This is the author’s peer reviewed, accepted manuscript. However, the online version of record will be different from this version once it has been copyedited and typeset.
9
it comes from Eq. (3), (6) and (7) that t only depends on 𝑅𝐹𝑒, 𝑉𝐴𝑢⁄𝑉𝐹𝑒 and f. The areas of one lateral
{111}Au facet 𝑆111𝑝𝑦𝑟𝐴𝑢 and of the top {001}Au facet 𝑆001𝑝𝑦𝑟𝐴𝑢 are
𝑆111𝑝𝑦𝑟𝐴𝑢 = (1 − 𝑡2) 𝑆001𝐴𝑢 (4 cos 𝛽)⁄ and 𝑆
001𝑝𝑦𝑟𝐴𝑢 = 𝑡2 𝑆001𝐴𝑢 (14)
It is important to keep in mind that once 𝑅𝐹𝑒, 𝑉𝐴𝑢⁄𝑉𝐹𝑒 and f are fixed, there exists a unique
distribution of the gold in the homothetic shell and the pyramids (there is a unique correspondence between f and t). All the geometrical quantities defined here (distances, areas and volumes) depend
on 𝑉𝐹𝑒, 𝑉𝐴𝑢⁄𝑉𝐹𝑒, 𝑅𝐹𝑒 and f.
C. Limits of the aspect ratios
As the core is a polyhedron limited by {001}Fe and {110}Fe faces within the cubic symmetry,
𝑅𝐹𝑒 varies from 1 √2⁄ (perfect rhombic dodecahedron built with 12 {110}Fe lozenges), to √2 (perfect
cube built with 6 {001}Fe squares) (Fig. 3(a)).
The limits of f, fmin and fmax, depend on a 𝑉𝐴𝑢⁄𝑉𝐹𝑒 and 𝑅𝐹𝑒 (see Appendix B). We also
calculate the limits tmin and tmax of the pyramid truncation t, which is a monotonous and increasing
function of f. When Au is entirely distributed in the homothetic part of the shell, f and t reach their
maxima fmax and tmax:
𝑓𝑚𝑎𝑥= [1 + (𝑉𝐴𝑢⁄𝑉𝐹𝑒)]1 3⁄ ; 𝑡
𝑚𝑎𝑥= 1 (15)
When the Au pyramids are as complete as possible, f and t reach their minima fmin and tmin. As
illustrated in Fig. 3(b) for a particular 𝑅𝐹𝑒 and 3 different volume ratios, these minima are:
(i) 1<fmin<fmax and tmin=0 if the wetting layer still exists when the pyramids are complete.
(ii) fmin=1 and tmin=0 when the completion of the pyramids coincides with an empty wetting
layer
(iii) fmin=1 and 0<tmin<1 if pyramids cannot be complete even without wetting layer.
The exact calculation of fmin and tmin is given in Appendix B.
This is the author’s peer reviewed, accepted manuscript. However, the online version of record will be different from this version once it has been copyedited and typeset.
10
FIG. 3. (a) Cross-section (top) and top-view (bottom) of the core for various aspect ratios 𝑅𝐹𝑒
from1 √2⁄ to √2 . (b) Geometrical limits of the shell, illustrated in cross-section with 𝑅𝐹𝑒=1.2 for
various volume ratios 𝑉𝐴𝑢⁄𝑉𝐹𝑒. The scale is for 𝑉𝐹𝑒=175.6 nm3 (same order of magnitude as the
average experimental volumes in [7]).
D. Experimental analysis with the geometrical model
Average values of 𝑅𝐹𝑒, ℎ001𝐹𝑒 , ℎ111𝐴𝑢 and ℎ𝑝𝑦𝑟𝐴𝑢 of a single NP can be measured from high
resolution transmission electron microscopy (HRTEM) images. 𝑉𝐹𝑒, f and 𝑉𝐴𝑢⁄𝑉𝐹𝑒 are then deduced
through Eq. (2), (6) and (13). The models represented in Fig. 1 are built with the measures from the experimental images and are displayed at the same scale.
This is the author’s peer reviewed, accepted manuscript. However, the online version of record will be different from this version once it has been copyedited and typeset.
11
For Fig. 1(a), the measured values used to build the model are 𝑅𝐹𝑒 = 1.35+/-0.04, ℎ001𝐹𝑒 = 2.2
+/- 0.1 nm, ℎ111𝐴𝑢 = 0.41 +/- 0.1 nm and an average t=0.66 (or ℎ𝑝𝑦𝑟𝐴𝑢 = 1.1 nm). We thus estimate 𝑉𝐹𝑒≈
84 nm3, f ≈ 1.14 and 𝑉
𝐴𝑢⁄𝑉𝐹𝑒≈ 1.6 in this single NP. Estimates of 𝑉𝐴𝑢⁄𝑉𝐹𝑒 in several other NPs from
[7, 9] (and supplemental material of ref. [7]) with the same morphology as in Fig. 1(a) are in the range 1.6-2.3. The {111}Au/{110}Fe interfaces barely even exist and the core corners are covered by 2 or more Au MLs.
For Fig. 1(b) the measured values used to build the model are 𝑅𝐹𝑒 = 0.98+/-0.02, ℎ001𝐹𝑒 = 3.26
+/- 0.1 nm, ℎ111𝐴𝑢 = 0.58 +/- 0.1 nm and ℎ𝑝𝑦𝑟𝐴𝑢 ≈0, giving directly t≈0 and f≈1. The deduced Fe volume is
168 +/- 25 nm3 and the deduced volume ratio 𝑉
𝐴𝑢⁄𝑉𝐹𝑒 in this single NP is 0.65 +/- 0.15.
These estimations indicate that the Au/Fe ratio in NPs with well-formed pyramids is 3 to 4 times larger than in NPs as in Fig. 1(b).
E. Surface and interface energy densities
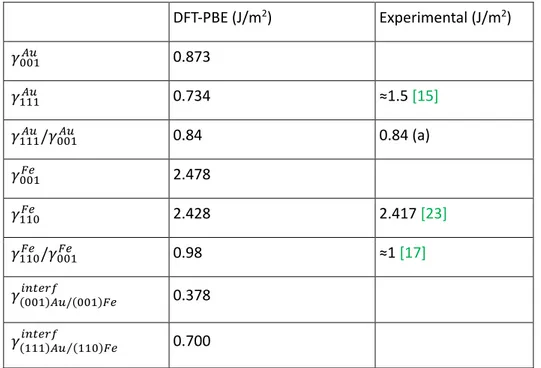
To investigate the energy landscape of a NP with the geometrical model, the surface and interface energies densities, defined as excess energies compared to bulk phases, are necessary. They were calculated with the density functional theory (DFT) with the methodology described in
[20, 21] and are reported in Table I.
1. DFT calculations
Spin-polarized DFT calculations have been performed using the VASP code, with PAW
pseudopotentials and the PBE functional. The cutoff energy has been set to 600 eV for all calculations and a Methfessel-Paxton smearing with σ 0.05 eV was used. A Monkshorst-Pack mesh of special k-points has been determined in order to achieve the convergence of the energy up to 2 meV/atom for each investigated system. Periodic boundary conditions are used in the x, y and z directions and the two slabs are separated from their images by adding 1.5 nm of vacuum in the z-direction. The atomic
positions were relaxed until the forces reaches a value lower than 10-2 eV. Å-1.
As discussed in [20] the (001)Au and (111)Au surface energies, respectively 𝛾001𝐴𝑢 and 𝛾111𝐴𝑢, are
underestimated with respect to the experimental values (around 1.5 J/m2[15]). ). This is due to the
use of the PBE exchange and correlation functional which, although giving excellent results in
reproducing the properties of iron, is not very performing for gold. However, the ratio 𝛾111𝐴𝑢/𝛾001𝐴𝑢 is in
excellent agreement with the experimental estimates; for instance, a 0.84 ratio is deduced applying
This is the author’s peer reviewed, accepted manuscript. However, the online version of record will be different from this version once it has been copyedited and typeset.
12
the Wulff theorem to the Au nano-island from ref. [22]. For (001)Fe and (110)Fe, the surface energies,
respectively 𝛾001𝐹𝑒 and 𝛾110𝐹𝑒 , are in very good agreement with experiments [18, 23].
For the energy density of the {001}Au/{001}Fe interface, 𝛾(001)𝐴𝑢/(001)𝐹𝑒𝑖𝑛𝑡𝑒𝑟𝑓 , we used the same
model of coherent interface as in [20, 21]. For the energy density of the {111}Au/{110}Fe
interface, 𝛾(111)𝐴𝑢/(110)𝐹𝑒𝑖𝑛𝑡𝑒𝑟𝑓 , we developed a new model reproducing the epitaxial
Nishiyama-Wasserman relationship [7, 13] with periodic boundary conditions. As a first approximation, we chose
to model this interface using a semi-coherent approach in the [101] direction as proposed by Lu et al.
for the (111)Ag/(110)Fe interface [24]. The coincidence between the two lattices along the [110]
direction is 5 Fe cells for 4 Au cells (5x4). After optimization, the system exhibits an interface dislocation enabling to accommodate a large part of the high lattice misfit in this direction. A more detailed study will be reported elsewhere. For both interfaces, the energies were converged within
+/- 10 mJ/m2 for a slab with 12 Fe MLs and more than 4 Au MLs.
DFT-PBE (J/m2) Experimental (J/m2) 𝛾001𝐴𝑢 0.873 𝛾111𝐴𝑢 0.734 ≈1.5 [15] 𝛾111𝐴𝑢/𝛾 001𝐴𝑢 0.84 0.84 (a) 𝛾001𝐹𝑒 2.478 𝛾110𝐹𝑒 2.428 2.417 [23] 𝛾110𝐹𝑒 /𝛾001𝐹𝑒 0.98 ≈1 [17] 𝛾(001)𝐴𝑢/(001)𝐹𝑒𝑖𝑛𝑡𝑒𝑟𝑓 0.378 𝛾(111)𝐴𝑢 (110)𝐹𝑒𝑖𝑛𝑡𝑒𝑟𝑓 ⁄ 0.700
Table I: Surface and interface energy densities obtained from DFT calculations with the PBE functional and experimental data. (a) is found by application of the Wulff theorem to the Au nano-island of ref.
[22].
2. Dependence with the Au thickness
The excess energy experienced by an iron surface covered by Au is due to the Au surface energy and interface energy. However, to explore the case of small Au/Fe volume ratios (Fig. 3(b)), it is mandatory to consider the possibility for Fe surfaces to be bare (the excess energy is then due to
This is the author’s peer reviewed, accepted manuscript. However, the online version of record will be different from this version once it has been copyedited and typeset.
13
𝛾𝑠𝑢𝑟𝑓𝑎𝑐𝑒𝐹𝑒 ) and to introduce a progressive transition from the bare Fe surface to the full wetting by Au. By sake of simplicity, we chose to monitor the full wetting condition with a single parameter, a critical Au thickness. In the following, for Au thicknesses larger than this critical value, the surface
and interface energies are calculated with the densities 𝛾𝑠𝑢𝑟𝑓𝑎𝑐𝑒𝐴𝑢 and 𝛾𝑖𝑛𝑡𝑒𝑟𝑓𝑎𝑐𝑒 from Table I. Below
the critical thicknesses, we impose a linear increase in 𝛾𝑠𝑢𝑟𝑓𝑎𝑐𝑒𝐴𝑢 and 𝛾𝑖𝑛𝑡𝑒𝑟𝑓𝑎𝑐𝑒 as the Au thickness
decreases until 𝛾𝑠𝑢𝑟𝑓𝑎𝑐𝑒𝐴𝑢 + 𝛾𝑖𝑛𝑡𝑒𝑟𝑓𝑎𝑐𝑒 becomes equal to 𝛾𝑠𝑢𝑟𝑓𝑎𝑐𝑒𝐹𝑒 when the Au thickness is null, as
described in Fig. 4. We fixed the critical thicknesses at 2 MLs (0.46 nm for {111}Au and 0.40 nm for {001}Au) corresponding to the minimal Au coverage experimentally observed in our NPs.
FIG. 4. 𝛾𝑠𝑢𝑟𝑓𝑎𝑐𝑒𝐴𝑢 + 𝛾𝑖𝑛𝑡𝑒𝑟𝑓𝑎𝑐𝑒 as a function of the gold thickness. If the Au layer exceeds a
critical thickness, chosen here to be 2 MLs, 𝛾𝑠𝑢𝑟𝑓𝑎𝑐𝑒𝐴𝑢 and 𝛾𝑖𝑛𝑡𝑒𝑟𝑓𝑎𝑐𝑒 are the DFT data computed (Table
I). Below the critical thickness, a linear increase is imposed to 𝛾𝑠𝑢𝑟𝑓𝑎𝑐𝑒𝐴𝑢 and 𝛾𝑖𝑛𝑡𝑒𝑟𝑓𝑎𝑐𝑒 so that for the
bare iron, 𝛾𝑠𝑢𝑟𝑓𝑎𝑐𝑒𝐴𝑢 + 𝛾𝑖𝑛𝑡𝑒𝑟𝑓𝑎𝑐𝑒 is equal to 𝛾𝑠𝑢𝑟𝑓𝑎𝑐𝑒𝐹𝑒 (DFT data from Table I). The illustrations are NPs
with 𝑅𝐹𝑒=1.2. For 𝑉𝐹𝑒=175.6 nm3 the Au/Fe volume ratios correspond from left to right to: bare iron,
Au thickness around the critical thickness, and larger Au thickness, here around 1.3 nm (6 MLs).
This is the author’s peer reviewed, accepted manuscript. However, the online version of record will be different from this version once it has been copyedited and typeset.
14
III. GROWTH MODES OF GOLD ON INFINITE 2D AND FINITE 3D IRON SUBSTRATES
The growth mode of the Au/Fe system can be predicted on the basis of our DFT calculated surface and interface energies. Beyond the classical case of the growth on a 2D infinite substrate, our aim in this section is to discuss the growth mode when the substrate is a 3D nanocrystal of finite size.
A. Growth mode of Au on an infinite 2D Fe substrate
The wetting factor Φ𝐴𝑢 𝐹𝑒⁄ that expresses the balance of surface and interface energies
involved in the formation of a 2D Au layer on a 2D Fe substrate is [13]
Φ𝐴𝑢 𝐹𝑒⁄ = 𝛾𝑠𝑢𝑟𝑓𝑎𝑐𝑒𝐴𝑢 + 𝛾𝑖𝑛𝑡𝑒𝑟𝑓𝑎𝑐𝑒− 𝛾𝑠𝑢𝑟𝑓𝑎𝑐𝑒𝐹𝑒 (16)
The growth mode (in near equilibrium conditions) is predicted from the sign of Φ𝐴𝑢 𝐹𝑒⁄ : 2D Frank van
der Merwe (full wetting) if negative or 3D Volmer-Weber (partial wetting) if positive. It is also interesting to calculate the adhesion energy of the Au/Fe system
𝑊𝑎𝑑 = 𝛾𝑠𝑢𝑟𝑓𝑎𝑐𝑒𝐴𝑢 − 𝛾𝑖𝑛𝑡𝑒𝑟𝑓𝑎𝑐𝑒 + 𝛾𝑠𝑢𝑟𝑓𝑎𝑐𝑒𝐹𝑒 (17)
Thanks to the DFT calculated energies of both {111}Au/{110}Fe and {001}Au/{001}Fe interfaces, we are able to predict and compare quantitatively their growth modes. Table II reports the adhesion energies and the wetting factors of Au on Fe calculated with the surface and energies DFT computed data of Table I. interface DFT-PBE (J/m2) (111)Au / (110)Fe 𝑊𝑎𝑑 2.462 (001)Au / (001)Fe 𝑊𝑎𝑑 2.973 (111)Au on (110)Fe Φ(111)𝐴𝑢/(110)𝐹𝑒 -0.994 (001)Au on (001)Fe Φ(001)𝐴𝑢/(001)𝐹𝑒 -1.227 (110)Fe on (111)Au Φ(110)𝐹𝑒/(111)𝐴𝑢 2.394 (001)Fe on (001)Au Φ(001)𝐹𝑒/(001)𝐴𝑢 1.983
Table II. Adhesion energies 𝑊𝑎𝑑 of the Au/Fe interfaces and wetting factors Φ𝐴𝑢/𝐹𝑒 of Au on Fe, and
Φ𝐹𝑒/𝐴𝑢 of Fe on Au, calculated from the DFT computed data of Table I.
Both interfaces have a high adhesion energy. The largest adhesion energy of {001}Au/{001}Fe
compared to {111}Au/{110}Fe is due for one third to the difference in 𝛾111𝐴𝑢and 𝛾001𝐴𝑢 and for two
This is the author’s peer reviewed, accepted manuscript. However, the online version of record will be different from this version once it has been copyedited and typeset.
15
thirds to the difference in 𝛾(111)𝐴𝑢/(110)𝐹𝑒𝑖𝑛𝑡𝑒𝑟𝑓 and 𝛾(111)𝐴𝑢/(110)𝐹𝑒𝑖𝑛𝑡𝑒𝑟𝑓 . The negative wetting factors in
Table II induced that for the two considered Fe orientations, the growth mode of Au on Fe system predicted by DFT is 2D Frank van der Merwe, i.e. the 2D Au layer is formed even for null
sursaturation. In addition, the absolute values of the wetting factors are comparable to the corresponding Au surface energies, which indicates a strong tendency to Au on Fe wetting.
Table II also reports the wetting factors of iron on gold. They are much larger than for gold on iron, positive values even suggesting a Volmer-Weber growth mode of iron on gold (i.e. partial wetting). Combined to the low miscibility of the two metals, here this fully preserves the initial iron NPs as cores for the further growth of gold shell. More generally, this clearly favors a Fe-core@Au-shell chemical order in this system.
B. Growth of Au on a finite 3D Fe nano-substrate: from a 2D growth mode to a 3D Stranski-Krastanov like growth mode
Within our geometrical model, we can calculate precisely the variation of free energy 𝛥𝐹 needed to form an Au shell on a Fe nano-substrate of predefined shape and finite size. To condensate n atoms from Au vapor as a shell with a homogeneous thickness, 𝛥𝐹 is
𝛥𝐹 = 𝐸𝑠𝑢𝑟𝑓𝑎𝑐𝑒𝐴𝑢 + 𝐸𝑖𝑛𝑡𝑒𝑟𝑓𝑎𝑐𝑒− 𝐸𝑠𝑢𝑟𝑓𝑎𝑐𝑒𝐹𝑒 − 𝑛𝛥µ (18)
where 𝐸𝑠𝑢𝑟𝑓𝑎𝑐𝑒𝐴𝑢 and 𝐸𝑖𝑛𝑡𝑒𝑟𝑓𝑎𝑐𝑒 are the costs in Au surfaces and Au/Fe interfaces to form an Au shell,
(− 𝐸𝑠𝑢𝑟𝑓𝑎𝑐𝑒𝐹𝑒 ) is the gain provided by the full wetting of Fe by Au, and 𝛥µ is the difference of chemical potential of gold between the vapor and the solid phase. To ensure the constraint on the
homogeneous shell thickness, we consider here that the shell adopts the same shape as the core so
that f is fixed to 𝑓𝑚𝑎𝑥 (defined by Eq. (15) in section II. C.). It comes
𝐸𝑠𝑢𝑟𝑓𝑎𝑐𝑒𝐹𝑒 = 12 𝛾110𝐹𝑒 𝑆 110𝐹𝑒 + 6 𝛾001𝐹𝑒 𝑆001𝐹𝑒 (19) 𝐸𝑠𝑢𝑟𝑓𝑎𝑐𝑒𝐴𝑢 = 12 𝛾111𝐴𝑢 𝑆111𝐴𝑢 + 6 𝛾001𝐴𝑢 𝑆001𝐴𝑢 (20) 𝐸𝑖𝑛𝑡𝑒𝑟𝑓𝑎𝑐𝑒 = 12 𝛾(111)𝐴𝑢/(110)𝐹𝑒𝑖𝑛𝑡𝑒𝑟𝑓 𝑆110𝐹𝑒 + 6 𝛾(001)𝐴𝑢/(001)𝐹𝑒𝑖𝑛𝑡𝑒𝑟𝑓 𝑆001𝐹𝑒 (21) 𝛥𝐹 = 12 (𝛾(111)𝐴𝑢/(110)𝐹𝑒𝑖𝑛𝑡𝑒𝑟𝑓 + 𝑓𝑚𝑎𝑥2 𝛾111𝐴𝑢 − 𝛾110𝐹𝑒 ) 𝑆110𝐹𝑒 + 6 (𝛾(001)𝐴𝑢/(001)𝐹𝑒 𝑖𝑛𝑡𝑒𝑟𝑓 + 𝑓𝑚𝑎𝑥2 𝛾001𝐴𝑢 − 𝛾001𝐹𝑒 ) 𝑆 001𝐹𝑒 − 𝑛𝛥µ (22)
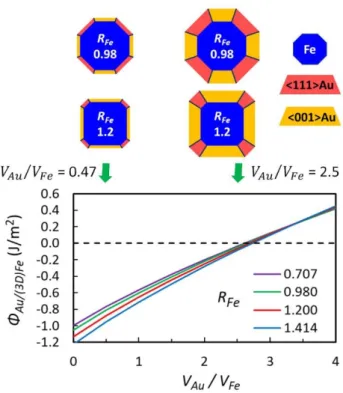
It is interesting to define 𝛷𝐴𝑢/(3𝐷)𝐹𝑒 by dividing the surface and interface contributions by the core
area:
This is the author’s peer reviewed, accepted manuscript. However, the online version of record will be different from this version once it has been copyedited and typeset.
16 𝛷𝐴𝑢 (3𝐷⁄ )𝐹𝑒= 𝐸𝑠𝑢𝑟𝑓𝑎𝑐𝑒𝐴𝑢 + 𝐸𝑖𝑛𝑡𝑒𝑟𝑓𝑎𝑐𝑒 − 𝐸𝑠𝑢𝑟𝑓𝑎𝑐𝑒𝐹𝑒 12 𝑆110𝐹𝑒 + 6 𝑆001𝐹𝑒
=
(𝛾(111)𝐴𝑢/(110)𝐹𝑒 𝑖𝑛𝑡𝑒𝑟𝑓 +𝑓𝑚𝑎𝑥2 𝛾111𝐴𝑢−𝛾110𝐹𝑒)(√2−𝑅𝐹𝑒)(3√2𝑅𝐹𝑒−2)+2(𝛾𝑖𝑛𝑡𝑒𝑟𝑓(001)𝐴𝑢/(001)𝐹𝑒+𝑓𝑚𝑎𝑥2𝛾001𝐴𝑢−𝛾001𝐹𝑒)(√2𝑅𝐹𝑒−1) 2 (√2−𝑅𝐹𝑒)(3√2𝑅𝐹𝑒−2)+2(√2𝑅𝐹𝑒−1) 2 (23)Note that 𝛷𝐴𝑢 (3𝐷⁄ )𝐹𝑒 is nothing else than the wetting factor adapted to the 3D morphology of the
nanosubstrate. In contrast with a 2D infinite substrate, here the wetting factor depends on the Au
deposited volume. Indeed 𝑓𝑚𝑎𝑥 is related to 𝑉𝐴𝑢⁄𝑉𝐹𝑒 through Eq. (15). 𝛷𝐴𝑢 (3𝐷⁄ )𝐹𝑒 is displayed in Fig.
5 as a function of 𝑉𝐴𝑢⁄𝑉𝐹𝑒 for various 𝑅𝐹𝑒 from 1 √2⁄ to √2. For small volume ratio, it comes from
Eq. (15) that 𝑓𝑚𝑎𝑥 tends to 1, so that 𝛷𝐴𝑢 (3𝐷⁄ )𝐹𝑒 reduces to the average value of 𝛷𝐴𝑢 𝐹𝑒⁄ weighted by
the respective surface areas of the two kinds of crystallites and is negative whatever the Fe
nanocrystal shape1. The wetting factor 𝛷
𝐴𝑢 (3𝐷⁄ )𝐹𝑒 then increases linearly with 𝑓𝑚𝑎𝑥2 with a 𝑅𝐹𝑒
dependency2. There exists a critical value 𝑓
𝑐𝑟𝑖𝑡𝑖𝑐𝑎𝑙 and a critical volume ratio for which 𝛷𝐴𝑢 (3𝐷⁄ )𝐹𝑒
becomes null: 𝑓𝑐𝑟𝑖𝑡𝑖𝑐𝑎𝑙 = [−( 𝛾(111)𝐴𝑢/(110)𝐹𝑒 𝑖𝑛𝑡𝑒𝑟𝑓 − 𝛾110𝐹𝑒 ) (√2 − 𝑅𝐹𝑒)(3√2𝑅𝐹𝑒− 2) + 2 (𝛾(001)𝐴𝑢/(001)𝐹𝑒 𝑖𝑛𝑡𝑒𝑟𝑓 − 𝛾100𝐹𝑒 ) (√2𝑅𝐹𝑒− 1) 2 𝛾111𝐴𝑢(√2 − 𝑅𝐹𝑒)(3√2𝑅𝐹𝑒− 2) + 2 𝛾100𝐴𝑢(√2𝑅𝐹𝑒− 1) 2 ] 1 2⁄ (24)
1 Note that Fig. 5 is presented regardless the NP size. However, this is valid only when the Au thickness is larger than the critical thickness defined in section II. E. 2. for the full wetting condition. For instance, for the 175.6 nm3 𝑉
𝐹𝑒 discussed in the next section, and 𝑅𝐹𝑒 around 1, Fig. 5 is valid for 𝑉𝐴𝑢⁄𝑉𝐹𝑒 larger than 0.47 if the critical
thickness is 2 MLs.
2 There however exists a particular volume ratio where the 3D wetting factor 𝛷
𝐴𝑢 (3𝐷⁄ )𝐹𝑒 is identical
whatever 𝑅𝐹𝑒 and its hierarchy as a function of 𝑅𝐹𝑒 undergoes an inversion. It is given from (15) and
(23) by
𝑉𝐴𝑢⁄𝑉𝐹𝑒= [1 + (Φ(001)𝐴𝑢/(001)𝐹𝑒− Φ(111)𝐴𝑢/(110)𝐹𝑒) (𝛾⁄ 111𝐴𝑢−𝛾001𝐴𝑢)]
3 2⁄
− 1
and is 3.4 here. For lower volume ratios, the larger the predefined 𝑅𝐹𝑒 of the core (i.e. the larger the
(001)Au/(001)Fe interface area), the larger the energetical benefit to form a shell homothetic to the
core as shown by the smaller 𝛷𝐴𝑢 (3𝐷⁄ )𝐹𝑒. This is because of the hierarchy of the 2D wetting factors
(Φ(111)𝐴𝑢/(110)𝐹𝑒 > Φ(001)𝐴𝑢/(001)𝐹𝑒). As the volume ratio increases, the surface term in the shell
formation energy 𝛥𝐹 becomes dominant. As 𝛾111𝐴𝑢 < 𝛾001𝐴𝑢 , the cost to form a shell becomes larger
(𝛷𝐴𝑢 (3𝐷⁄ )𝐹𝑒 becomes larger) with large 𝑅𝐹𝑒 than with small 𝑅𝐹𝑒. If (Φ(001)𝐴𝑢/(001)𝐹𝑒−
Φ(111)𝐴𝑢/(110)𝐹𝑒) and (𝛾111𝐴𝑢 − 𝛾001𝐴𝑢 ) had opposite sign, this inversion would not exist.
This is the author’s peer reviewed, accepted manuscript. However, the online version of record will be different from this version once it has been copyedited and typeset.
17
(𝑉𝐴𝑢⁄𝑉 𝐹𝑒)𝑐𝑟𝑖𝑡𝑖𝑐𝑎𝑙 = (𝑓𝑐𝑟𝑖𝑡𝑖𝑐𝑎𝑙)3− 1 (25)
FIG. 5. Wetting factor 𝛷𝐴𝑢 (3𝐷⁄ )𝐹𝑒 adapted to the 3D morphology of the nanosubstrate,
calculated as a function of the Au/Fe volume ratio for various Fe core shapes. The energies densities
used are those calculated by DFT-PBE (table I). The illustrations are for 𝑅𝐹𝑒=0.98 and 1.2 and the two
volume ratios 0.47 and 2.5.
The critical volume ratio is between 2.6 and 2.7 depending on 𝑅𝐹𝑒 (Fig. 5). Below the critical
ratio, the shell formation with a full wetting provides a gain in energy as in the classical 2D Frank-van-der-Merwe growth mode. This also means that, once formed, a Fe@Au NP should be very stable
against partial dewetting. (Note that the 𝛾𝑠𝑢𝑟𝑓𝑎𝑐𝑒𝐴𝑢 being underestimated compared to experimental
data (Table I), the wetting factor predicted could also be underestimated. However, the full wetting
is experimentally attested in the NPs from ref [25] and from our work.)
Above, 𝛷𝐴𝑢 (3𝐷⁄ )𝐹𝑒 is positive and the growth requires an increasing positive sursaturation.
Here we can make an analogy with the 3D Stranski-Krastanov (SK) growth mode, the third classical growth mode adopted by a film grown on an infinite 2D substrate (in near-equilibrium
conditions) [13]. In the SK growth mode, the wetting is complete and the layer first grows 2D, then
after a so-called critical thickness, islands take place on the wetting layer. It has been formally
This is the author’s peer reviewed, accepted manuscript. However, the online version of record will be different from this version once it has been copyedited and typeset.
18
described by considering that the wetting factor, negative at first at the onset of the growth,
increases with the deposited thickness so that it becomes positive [13, 26]. In strained
semiconducting heterostructures, where the SK growth mode is often observed, this increase is due to the integration in the wetting factor of the elastic energy, a term proportional to the deposited
thickness [13, 26]. The driving force for a 3D morphology is thus the relaxation of the elastic energy
by the island faces [26, 27].
In our model, the increase of the wetting factor 𝛷𝐴𝑢 (3𝐷⁄ )𝐹𝑒 with the Au/Fe volume ratio and
the change of its sign is due to the shell surface increase. Note that this phenomenon is expected independently of the core and shell crystallography. However, a 3D SK like growth mode will occur only if a modulation of the shell thickness decreases this wetting factor. As investigated in the next section, this will be possible here thanks to the polycrystalline character of the shell engendered by the accommodation of its crystallographic lattice (fcc) to the core one (bcc).
IV. EQUILIBRIUM SHAPE OF THE FE@AU NANOPARTICLES AT CONSTANT VOLUMES
In this section, we determine the equilibrium shape (ES) of a NP of given Au and Fe volumes, and we identify the driving forces at the origin of the shape transformations allowed in our
geometrical model. For this purpose, we analyze the pathways leading to the ES. We consider as initial configurations the cases where the shell adopts the same external shape as the core i.e. when
f=fmax as in section III. Then we assume that a shape transformation can only occur by progressive
change of 𝑅𝐹𝑒 and/or f.
A large Au/Fe volume ratio of 1.71 is first considered then a small one of 0.57.
A. Excess energy of a nanoparticle
The excess energy of the NP compared to the same Au and Fe volumes in their bulk phases is 𝐸𝑁𝑃= 𝐸𝑠𝑢𝑟𝑓𝑎𝑐𝑒𝐴𝑢 + 𝐸𝑖𝑛𝑡𝑒𝑟𝑓𝑎𝑐𝑒 (26)
While 𝐸𝑖𝑛𝑡𝑒𝑟𝑓𝑎𝑐𝑒 is the same as in section III. B., here the surface contribution includes the pyramid
facets:
𝐸𝑠𝑢𝑟𝑓𝑎𝑐𝑒𝐴𝑢 = 12 𝛾111𝐴𝑢 𝑆111𝐴𝑢 + 6 (𝛾001𝐴𝑢𝑆001𝑝𝑦𝑟𝐴𝑢 + 4 𝛾111𝐴𝑢 𝑆111𝑝𝑦𝑟𝐴𝑢 ) (27)
This is the author’s peer reviewed, accepted manuscript. However, the online version of record will be different from this version once it has been copyedited and typeset.
19
𝐸𝑖𝑛𝑡𝑒𝑟𝑓𝑎𝑐𝑒 = 12 𝛾(111)𝐴𝑢/(110)𝐹𝑒𝑖𝑛𝑡𝑒𝑟𝑓 𝑆110𝐹𝑒 + 6 𝛾(001)𝐴𝑢/(001)𝐹𝑒𝑖𝑛𝑡𝑒𝑟𝑓 𝑆001𝐹𝑒 (28)
The solutions of the energy minimization as a function of the two aspect ratios 𝑅𝐹𝑒 and f are
numerically determined for a Fe volume 𝑉𝐹𝑒 = 175.6 nm3. The core edge when the shape is a cube is
5.6 nm that corresponds to the average experimental value [7]. The core aspect ratio 𝑅𝐹𝑒 varies from
1 √2⁄ (perfect rhombic dodecahedron with 12 {110}Fe faces) to √2 (perfect {001}Fe oriented cube).
As discussed in section II. C., the upper limit of f is fmax from Eq. (15) (the whole Au volume is
distributed in the homothetic shell), then f can be lowered by the progressive building of the
pyramids up to fmin.
B. Equilibrium shape for a large Au/Fe volume ratio
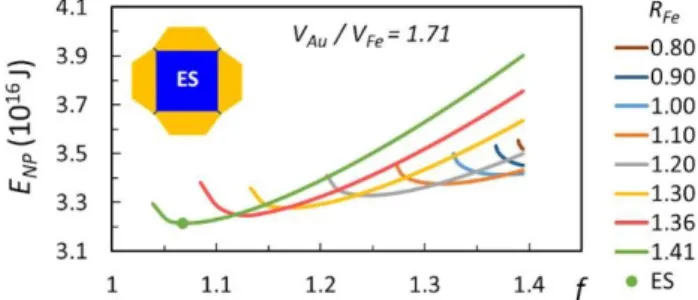
We present in detail the case of 𝑉𝐴𝑢⁄𝑉𝐹𝑒 = 1.71 with 𝑉𝐹𝑒= 175.6 nm3. Fig. 6 displays the total
excess energy 𝐸𝑁𝑃 as a function of the two aspect ratios 𝑅𝐹𝑒 and f. The upper limit of f, common to
all 𝑅𝐹𝑒 values, is fmax = 1.39 (from Eq. (15)). For all 𝑅𝐹𝑒 the Au/Fe volume ratio is large enough to
build untruncated pyramids (t=0) without completely emptying the homothetic shell (f remains strictly larger than 1).
FIG. 6. Excess energy of a single NP with 𝑉𝐹𝑒=175.6 nm3 and 𝑉𝐴𝑢⁄𝑉𝐹𝑒=1.71, displayed as a
function of f and 𝑅𝐹𝑒. fmax=1.39 corresponds to a homothetic shell without pyramids. The ES (𝑅𝐹𝑒=
√2 and f=1.073 or t=0.535) is shown.
As long as 𝑅𝐹𝑒 is lower than 1, the minimum of energy is for fmax (shape without pyramids).
For a given core shape 𝑅𝐹𝑒 larger than 1, the minimum is for a lower f, demonstrating the possibility
of a 3D SK like growth mode, where a part of the shell is transferred into pyramids at the detriment of the homothetic shell.
Comparing the different core shapes, it is then seen that the minimum of 𝐸𝑁𝑃 is for 𝑅𝐹𝑒 = √2
(cube-shaped core) and f=1.073. The homothetic shell thickness under the pyramids ℎ001𝐴𝑢 and the
This is the author’s peer reviewed, accepted manuscript. However, the online version of record will be different from this version once it has been copyedited and typeset.
20
pyramid height ℎ𝑝𝑦𝑟𝐴𝑢 are then respectively 0.21 nm (about 1 {001}Au ML) and 1.98 nm (about 10
{001}Au MLs) and the truncation t=0.535. This ES is displayed in inset.
C. From initial shapes to optimal shapes for a large Au/Fe volume ratio
To analyze the driving forces leading to this ES, we report in Fig. 7 (blue curve) the excess
energies of NPs with a homogeneous shell thickness (f=fmax or t=1). The four core shapes illustrated in
Fig. 7 are 𝑅𝐹𝑒 = 1 √2⁄ , 1.015, 1.2 and √2. The possible pathways reducing 𝐸𝑁𝑃 at constant volumes
from these initial configurations are then decomposed in two distinct shape transformations. The excess energies are taken from Fig. 6.
FIG. 7. Shape transformations reducing the NP energy at constant Au and Fe volumes, for
large volume ratios. The illustrations are at the scale for 𝑉𝐹𝑒=175.6 nm3 and 𝑉
𝐴𝑢⁄𝑉𝐹𝑒=1.71.
(i) 2D-3D Stranski-Krastanov like transition: This transformation consists in building <001>Au oriented pyramids at the detriment of <111>Au oriented platelets, the core shape being unchanged (golden arrows). The driving force to form pyramids is the reduction of surface energy by increasing the part of {111}Au surfaces compared to {001}Au (respectively the lateral and top facets of the pyramids). We call this mechanism a 2D-3D SK-like transition because it reduces the effective wetting
factor by the modulation of the shell thickness. This mechanism is active only for 𝑅𝐹𝑒 larger than 1.
(ii) Core shape transformation: One possible driving force is the reduction of the interface energy.
The core shape minimizing the interface energy 𝐸𝑖𝑛𝑡𝑒𝑟𝑓𝑎𝑐𝑒 is found by application of the Wulff
theorem and is 𝑅𝐹𝑒= 𝛾(111)𝐴𝑢/(110)𝐹𝑒𝑖𝑛𝑡𝑒𝑟𝑓 ⁄𝛾(001)𝐴𝑢/(001)𝐹𝑒𝑖𝑛𝑡𝑒𝑟𝑓 . As here this ratio is larger than √2 (from
This is the author’s peer reviewed, accepted manuscript. However, the online version of record will be different from this version once it has been copyedited and typeset.
21
Table I), the {111}Au/{110}Fe interfaces are unstable against {001}Au/{001}Fe interfaces and should disappear at the benefit of the shape of a cube. However this would be true only without surface effects. Indeed the cost due to larger {001}Au facets with the shape of a cube could be
uncompensated by the gain in interface energy. As a consequence, it is seen in Fig. 7 that as long as
the shell thickness is homogeneous (t=1 or f=fmax), the minimum of energy is for 𝑅𝐹𝑒 around 1.
Actually, this optimal core shape can be found analytically with the Wulff theorem, by considering that each core face experiences the interface energy plus the surface energy of the Au platelet above, and is:
𝑅
𝐹𝑒ℎ𝑜𝑚𝑜=
𝛾(111)𝐴𝑢/(110)𝐹𝑒𝑖𝑛𝑡𝑒𝑟𝑓
+ 𝑓𝑚𝑎𝑥2 𝛾111𝐴𝑢
𝛾(001)𝐴𝑢/(001)𝐹𝑒𝑖𝑛𝑡𝑒𝑟𝑓 + 𝑓𝑚𝑎𝑥2 𝛾001𝐴𝑢 (29)
Here with 𝑉𝐴𝑢⁄𝑉𝐹𝑒 = 1.71, 𝑅𝐹𝑒ℎ𝑜𝑚𝑜 equals 1.025. The blue arrows in Fig. 7 indicates the pathway from
various initial core shapes toward this minimum, the shell thickness remaining homogeneous. (iii) Finally, the two mechanisms of transformation can cooperate and the minimum of energy can be
reached by simultaneous changes in 𝑅𝐹𝑒 and f as illustrated by the green arrows. The ES combines
the cube-shaped core minimizing the interface energy, and the {001}Au pyramids optimizing the ratio between the areas of the two gold facet types.
In our model the bare iron is characterized applying the Wulff theorem by an aspect ratio 𝑅𝐹𝑒𝑊𝑢𝑙𝑓𝑓 = 𝛾110𝐹𝑒 /𝛾001𝐹𝑒 . If, at the onset of the shape transformation, the core is close to this value (0.98
from Table I), it can easily evolve towards 𝑅𝐹𝑒ℎ𝑜𝑚𝑜 (1.015), these two values being by chance very
close. As the pyramid formation also begins around 𝑅𝐹𝑒=1, the two mechanisms cooperate leading to
the ES.
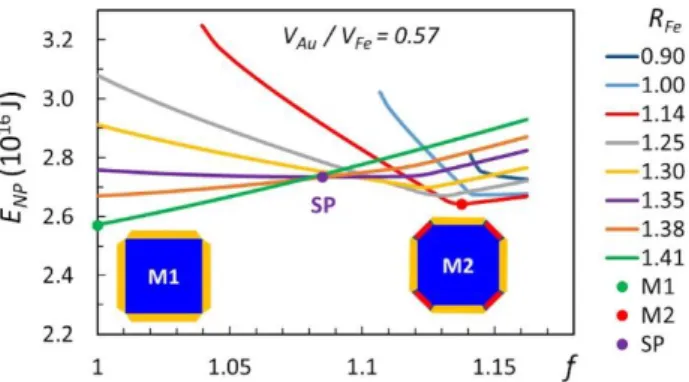
D. Equilibrium shape for a small Au/Fe volume ratio
Figure 8 displays the NP excess energy for the small ratio 𝑉𝐴𝑢⁄𝑉𝐹𝑒 = 0.57. Here fmax=1.162. As
for larger volume, for a given core shape 𝑅𝐹𝑒 larger than about 1, the minimum is not obtained for
the homogenous shell thickness. Allowing change in 𝑅𝐹𝑒, there exist two minima (the corresponding
shapes are shown in inset). The first minimum (M1) presents the same shape (cube) for the iron core as for the large volume ratio. The homothetic shell however is empty (f=1) and Au is entirely
distributed in 0.62 nm thick pyramids (about 3 {001}Au MLs). The truncation is t=0.842.
This is the author’s peer reviewed, accepted manuscript. However, the online version of record will be different from this version once it has been copyedited and typeset.
22
FIG. 8. Excess energy of a single NP with 𝑉𝐹𝑒= 175.6 nm3 and 𝑉
𝐴𝑢⁄𝑉𝐹𝑒 = 0.57 displayed as a
function of f and 𝑅𝐹𝑒. fmax = 1.162 corresponds to a homothetic shell without pyramids. The shapes in
inset correspond to the M1 minimum (𝑅𝐹𝑒=√2 and f=1) and M2 minimum (𝑅𝐹𝑒=1.14 and f=1.135). SP
is the saddle point (𝑅𝐹𝑒= 1.35).
The second minimum (M2) is for 𝑅𝐹𝑒 = 1.14 and f=1.135. The homothetic shell thicknesses
are ℎ111𝐴𝑢=0.46 nm and ℎ001𝐴𝑢=0.4 nm, i.e. 2 MLs. The <001> oriented Au platelets are covered by flat
pyramids with height ℎ𝑝𝑦𝑟𝐴𝑢 =0.2 nm (about one {001}Au MLs) and truncation t=0.934. The existence of
this second minimum is related to the increase introduced in surface and interface energies for low
ℎ111𝐴𝑢 to account for the transition between full wetting and bare iron as described in section II. E. 2
(Fig. 4). Indeed, while the NPs examined in section IV. B. and IV. C. always experience the full wetting
for any explored shape (Au thickness always larger than 2 MLs), here the reduction of the 𝑉𝐴𝑢⁄𝑉𝐹𝑒
dramatically reduces the ability to form a full Au wetting layer for any explored shape. In other
words, the Au layer is thinner than 2 MLs for some sets of aspect ratios (f, 𝑅𝐹𝑒).
E. From initial shapes to optimal shapes for a small Au/Fe volume ratio
Figure 9 describes the possible pathway to ES from initial shapes with homogeneous shells
(𝐸𝑁𝑃 are taken from Fig. 8). The blue curve if for the core transformation remaining a homogeneous
shell (f=fmax). Its minimum is given by Eq. (29) and is 𝑅𝐹𝑒ℎ𝑜𝑚𝑜=1.086 for 𝑉𝐴𝑢⁄𝑉𝐹𝑒 = 0.57. As a reduction
of 𝐸𝑁𝑃 by pyramid formation is possible from about 𝑅𝐹𝑒 =1, the minimum M2 is achieved by the
cooperation of core transformation and pyramid development (green arrow). M1 and M2 however
are separated by a saddle point (SP) of first order located at 𝑅𝐹𝑒=1.35, f=1.09 (from Fig. 8). The
barrier between M2 and SP is so high (9x10-18 J or 58 eV) that it fully prevents the transition from M2
to M1 through the geometrical transformations included in our model. The minimum M1 could be achieved from the initial shape of a cube by the pyramid formation (golden arrow).
This is the author’s peer reviewed, accepted manuscript. However, the online version of record will be different from this version once it has been copyedited and typeset.
23
FIG. 9. Shape transformations reducing the NP energy at constant Au and Fe volumes, for
small volume ratios. The illustrations are at the scale for 𝑉𝐹𝑒=175.6 nm3 and 𝑉𝐴𝑢⁄𝑉𝐹𝑒=0.57.
V. DISCUSSION AND COMPARISON WITH EXPERIMENTAL NANOPARTICLES
We then explore the ES as a function of the Au/Fe volume ratio from 0.47 to 2.5. Fig. 10
displays the evolution of 𝑅𝐹𝑒 (a), t (b) and Au thicknesses (c) for the two minima M1 and M2 as a
function of the volume ratio. Here we chose to represent the shell shape through t rather than f, because t provides a direct focus on the pyramid shape. To predict the shape evolution, we describe and discuss separately the evolution of the M1 and M2 minima, then we discuss which minimum is likely to form at each volume ratio.
This is the author’s peer reviewed, accepted manuscript. However, the online version of record will be different from this version once it has been copyedited and typeset.
24
FIG. 10. Evolution of 𝑅𝐹𝑒 (a), t (b) and Au thicknesses (c) for the two minima M1 and M2 as a
function of the Au/Fe volume ratio (for 𝑉𝐹𝑒= 175.6 nm3).
A. Evolution of the optimal shape M1 towards an optimal truncation
The M1 minimum (green curves in Fig. 10) exists for all volume ratios. While the core shape is consistently a cube, there exist two regimes for the shell shape.
(i) For volume ratio below 1.2: The homothetic layer below the pyramids is empty (ℎ001𝐴𝑢=0 in Fig.
10(c), corresponding to f=1). The Au volume increase entirely contributes to develop the <001> oriented pyramids as shown by the progressive decrease of the truncation (Fig. 10(b)), and the
corresponding increase of ℎ𝑝𝑦𝑟𝐴𝑢 (Fig. 10(c)).
This is the author’s peer reviewed, accepted manuscript. However, the online version of record will be different from this version once it has been copyedited and typeset.
25
(ii) For volume ratio above 1.2: When 𝑉𝐴𝑢⁄𝑉𝐹𝑒 reaches 1.2, the truncation reaches 0.534. Then the
shell morphology changes, with the apparition of the homothetic layer. As seen in Fig. 10(c) (green curves), the increase in the volume ratio above 1.2 indeed results in the concomitant thickens of the
layers under the pyramids (ℎ001𝐴𝑢) and increase of the pyramid height (ℎ𝑝𝑦𝑟𝐴𝑢 ). It is important to note
that the truncation does no more evolve (Fig. 10(b)), meaning that the pyramid shape (above the homothetic shell) is unchanged.
These different steps are illustrated at the same scale in Fig. 11 (green squares) on which one can see that the homothetic layer is absent and all the gold is within the truncated pyramids up to
𝑉𝐴𝑢⁄𝑉𝐹𝑒 =1.2. Beyond 1.2 we observe the appearance of the homothetic layer and the stabilization
of the truncation at topt=0.534.
FIG. 11. Optimal shapes illustrated for 𝑉𝐴𝑢⁄𝑉𝐹𝑒 = 0, 0.47, 1.2, 1.7 and 2.5 volume ratios. The
shapes are at the scale for 𝑉𝐹𝑒=175.6 nm3.
B. Evolution of the optimal shape M2
For 𝑉𝐹𝑒=175.6 nm3, the M2 minimum (red curves in Fig. 10) exists from 𝑉𝐴𝑢⁄𝑉𝐹𝑒=0.47 which
is the minimal ratio ensuring a full wetting with 2MLs: the pyramids are indeed empty (ℎ𝑝𝑦𝑟𝐴𝑢 = 0 and
t=1). Then the core shape evolves monotonically from 𝑅𝐹𝑒=1.11 for 𝑉𝐴𝑢⁄𝑉𝐹𝑒=0.47 to 𝑅𝐹𝑒=1.39 for
This is the author’s peer reviewed, accepted manuscript. However, the online version of record will be different from this version once it has been copyedited and typeset.
26
𝑉𝐴𝑢⁄𝑉𝐹𝑒 =1.7 (Fig. 10(a)). At the same time, the thickness of the <111> oriented Au platelets (ℎ111𝐴𝑢 in
Fig. 10(c)) is stable at 0.46 nm and the Au volume increase entirely contributes to develop the <001>
pyramids. The stabilization at 0.46 nm (2 MLs) of ℎ111𝐴𝑢 is a strong indication that ℎ111𝐴𝑢 is driven by the
wetting of Au on {110}Fe. This is indeed the critical thickness chosen in section II. E. 2 (Fig. 4). To verify this hypothesis, we modified this critical thickness and we found that effectively this value
directly monitors ℎ111𝐴𝑢 of the M2 minima.
To summarize, the M2 minimum progressively evolves from a shape purely driven by the
wetting (for 𝑉𝐴𝑢⁄𝑉𝐹𝑒 = 0.47) to an intermediate shape driven by the combination of the wetting for
{111}Au on {110}Fe, the interface optimization, and the formation of <001> oriented Au pyramids (the 3D SK-like growth mode), as illustrated in Fig. 11 (red points). Around the volume ratio 1.7, the M2 minimum disappears and the M1 minimum only subsists.
C. Shape evolution with the volume ratio and comparison with experimental NPs
We now discuss which shape is the most likely to develop as a function of the volume ratio, assuming that the growth conditions allow to reach one of the two optimal shapes (M1 or M2
minimum) at each step, as reported in Fig. 11. For 𝑉𝐹𝑒=175.6 nm3, 𝑉
𝐴𝑢⁄𝑉𝐹𝑒 =0.47 is the minimal ratio
ensuring a full wetting with 2MLs. The M2 minimum can thus be given by Eq. (29) for f=1 and is
𝑅𝐹𝑒ℎ𝑜𝑚𝑜=1.11. As the latter value is by chance close to 𝑅𝐹𝑒𝑊𝑢𝑙𝑓𝑓= 0.98 corresponding to the Wulff shape
of bare iron (yellow point in Fig. 11), M2 can be easily achieved. Although M1 has a lower energy
than M2, the barrier ΔEM2→SP from M2 to the saddle point SP is so high (10-17 J from Fig. 12, i.e. 60 eV)
that it prevents the M2 to M1 transition. (In addition, the physical meaning of M1 is questionable for low volume ratios. Indeed, our geometrical model does not correctly ensure the full wetting at the
core corners below 𝑉𝐹𝑒=1.2.)
The barrier ΔEM2→SP decreases from 10-17 J (or 60 eV) for 𝑉𝐴𝑢⁄𝑉𝐹𝑒=0.47 to zero for 𝑉𝐴𝑢⁄𝑉𝐹𝑒
close to 1.7 (Fig. 12). When it is sufficiently low, a shape transition from M2 to M1 will occur, at the
latest for 𝑉𝐴𝑢⁄𝑉𝐹𝑒=1.7 (Fig. 11). Once the M1 shape is reached, the NP shell will continue to grow
with the optimal truncation topt=0.534 that reflects an optimal distribution of the areas of the
{111}Au and {001}Au surfaces within our model.
This is the author’s peer reviewed, accepted manuscript. However, the online version of record will be different from this version once it has been copyedited and typeset.
27
FIG. 12. Energy barrier ΔEM2→SP separating the M2 minimum and the saddle point SP (for
𝑉𝐹𝑒=175.6 nm3).
Note that the M1 shapes are not sensitive to changes in the interface energy densities, providing that their ratio is larger than √2. The details of the M2 shapes are sensitive to these parameters, and to the critical thicknesses chosen for Au wetting. The relative hierarchy of M1 and M2 and the barrier between them (position of the SP) also depend on these parameters. However, the scenarios described in Fig. 8, Fig. 9 and Fig. 11 are unchanged.
These morphologies are in excellent agreement with those experimentally observed.
In [7] (and in its supplemental material), one collection of bare Fe NPs and two different
collections of Fe@Au NPs were achieved with the same size distribution of core and similar relative size dispersions before and after gold deposit. As the Fe volume explored in detail here was chosen to fit the mean experimental core size, a direct comparison with the shapes predicted in Figs. 7, 9 and 11 is possible.
The NP in Fig. 1(b) and those from the same collection in [7] present a polyhedral shape with
an octagonal section and a full coverage of about 2 or 3 Au MLs, which is completely accounted for by the M2 minimum predicted for low volume ratio.
Regarding the NPs from the second collection reported in [7] (and from [9]), most of them
present a core shape close to a cube and well-formed pyramids, as displayed in Fig. 1(a), and an experimental Au/Fe volume ratio estimated in the range 1.6 to 2.3. The {111}Au/{110}Fe interfaces barely even exist and the core corners are covered by 2 or more Au MLs. Moreover, homogeneous thickness or octagonal section are not observed when the Au/Fe volume ratio is in this range. The observed NPs are thus very well reproduced by the M2 minimum shortly before the M2 to M1 shape transition. In addition, we compare in Fig. 13 the predicted optimal truncation and the experimental
This is the author’s peer reviewed, accepted manuscript. However, the online version of record will be different from this version once it has been copyedited and typeset.
28
truncations measured in 20 pyramids from 5 NPs (TEM observations in <001>Fe zone axis allow to explore 4 of the 6 pyramids of a NP). Given the error bars, we estimate that:
(i) About 30% of observed pyramids have reached the calculated optimal truncation (t~topt).
(ii) About 60% are more truncated (t>topt).
(iii) Only 10% pyramids are slightly less truncated (t<topt).
So, the experimental observations are very consistent with our model, where pyramids flatter than the optimal shape can exist due to an insufficient amount of gold, but sharper pyramids cannot form.
To conclude, the comparison of the experimental NPs with the predictions of the model indicate that most of them are close to their individual equilibrium shape, given the core size and the available gold amount.
FIG. 13. (a) TEM images (the scale bars are 5 nm) and (b) experimental truncations t in five different NPs with well-formed pyramids, measured from the TEM images. The dashed line is the optimal truncation (0.534) predicted by the model for large Au/Fe volume ratio.
This is the author’s peer reviewed, accepted manuscript. However, the online version of record will be different from this version once it has been copyedited and typeset.
29
D. Impact of the iron volume 𝑽𝑭𝒆 on the optimal shape
Let us briefly discuss the role of the core size.
(i) As long as the surface and interface energy densities do not depend on Au thickness, i.e. as long as the Au thicknesses are larger than the critical thicknesses defined in section II. E. 2. (Fig. 4), the NP
energy as displayed in Fig. 6 and Fig. 7 scales with (𝑉𝐹𝑒)2 3⁄ . A universal function 𝐸
𝑁𝑃⁄(𝑉𝐹𝑒)2 3⁄ could
be used to describe the NP energy, reducing the number of geometrical parameters to 3: f, 𝑅𝐹𝑒 and
𝑉𝐴𝑢⁄𝑉𝐹𝑒. This quantity is homogeneous to a surface energy density. A consequence is that the M1
minimum shape is regardless the core volume.
(ii) The change due to the thinness of the Au shell below 2MLs depends also on (𝑉𝐹𝑒)1 3⁄ , so that the
core size impacts the M2 minimum. Figure 14 displays the core shape of the M2 minimum as a
function of 𝑉𝐴𝑢⁄𝑉𝐹𝑒 for the reference volume 𝑉𝐹𝑒= 175.6 nm3, a volume 8 times smaller, and a
volume 512 times larger (red, blue and yellow curves respectively). The M2 minimum disappears
more quickly with 𝑉𝐴𝑢⁄𝑉𝐹𝑒 for large 𝑉𝐹𝑒 than for small 𝑉𝐹𝑒. For a same 𝑉𝐴𝑢⁄𝑉𝐹𝑒, 𝑅𝐹𝑒 of the M2
minimum is closer to √2 for a large 𝑉𝐹𝑒 than for small 𝑉𝐹𝑒. The last remark could explain the
observations of almost cube-shaped Fe [10] or FeCo [11] cores for smaller volume ratios than
discussed above. In these two references, the core sizes were significantly larger than in our particles.
FIG. 14. Core shape 𝑅𝐹𝑒 of the optimal shapes as a function of the Au/Fe volume ratio for
various iron volumes. The red curve is for the reference volume 𝑉𝐹𝑒=175.6 nm3, the blue curve is for
a volume 8 times smaller, the yellow curve is for a volume 512 times larger (the core edges when the shape is a cube being respectively 5.6 nm, 2.8 nm and 44.8 nm). The onset of each M2 curve is for the full wetting of the core by 2 Au MLs.
This is the author’s peer reviewed, accepted manuscript. However, the online version of record will be different from this version once it has been copyedited and typeset.