HAL Id: hal-02366365
https://hal.archives-ouvertes.fr/hal-02366365
Submitted on 15 Nov 2019HAL is a multi-disciplinary open access archive for the deposit and dissemination of sci-entific research documents, whether they are pub-lished or not. The documents may come from teaching and research institutions in France or abroad, or from public or private research centers.
L’archive ouverte pluridisciplinaire HAL, est destinée au dépôt et à la diffusion de documents scientifiques de niveau recherche, publiés ou non, émanant des établissements d’enseignement et de recherche français ou étrangers, des laboratoires publics ou privés.
Theoretical Study of the Interaction of Electron Donor
and Acceptor Molecules with Graphene
Tao Hu, I.C. Gerber
To cite this version:
Tao Hu, I.C. Gerber. Theoretical Study of the Interaction of Electron Donor and Acceptor Molecules with Graphene. Journal of Physical Chemistry C, American Chemical Society, 2013, 117 (5), pp.2411-2420. �10.1021/jp311584r�. �hal-02366365�
Theoretical Study of the Interaction of
Electron Donor and Acceptor Molecules with
Graphene
Tao Hu, Iann C. Gerber*
Université de Toulouse; INSA, UPS, CNRS; LPCNO 135 avenue de Rangueil, F-31077 Toulouse, France
Abstract:
With the aim of understanding recent experimental data concerning non-covalent
n/p-doping effects in grapheme samples, we have investigated the interactions between
two prototypical donor and acceptor molecules and graphene mono and bi-layers
systems, by means of density functional theory calculations. We report and rationalize
the structural, thermodynamical aspects, as well as charge transfers and the induced
electronic structure modifications of the graphenic substrates in interaction with
tetrathiafulvalene (TTF), an organic donor molecule and tetracyanoethylene (TCNE),
a typical acceptor. If the results show that p-doping of a graphene monolayer due to
TCNE molecules, can occur even at low concentration, n-doping of graphene requires
either larger concentrations or cooperative adsorption of TTF molecules. In both
cases, non-covalent doping only implies shifts of the Fermi level, and keeps the linear
dispersion of the π and π* state around the Dirac point. Moreover the intercalation of
donor/acceptor molecules decouples the layers and doped them.
1. Introduction
Graphene, a truly two dimensional monolayer of sp2-bonded carbon, is a very
inspiring material, since its unique physical properties, especially the ballistic electron
transport,1 could lead to many applications. For instance, in the case of graphene
based devices, a key issue is to tune the carrier concentration by shifting the Fermi
level of the graphene above or below the Dirac point, where the density of states is
zero.2 This can be realize either by applying electric field,3–5 with a gate voltage, or
chemically.6,7
Chemical doping is an effective method to tailor the electrical properties of
graphene, by controlling the hole or electron concentrations and at the same reducing
unwanted contamination. A recent review8 has been devoted to present the chemical
functionalization of graphene state of the art. One promising route, to achieve a fine
tunable graphene device, is the use of non-covalent interaction. This solution offers
two main advantages over covalent doping. Firstly it does not disturb the graphenic
lattice,9,10 leaving the electronic structure intact.11 Secondly this process is completely
reversible, contrary to covalent doping that randomly adds back-scattering centers.
Moreover the electronic behavior of experimental samples of graphene is
totally dependent on the growth methods.12 In some cases few layers graphene (FLG)
can be obtained. It is well documented that the stacking geometries impact the
electronic behavior of graphene, and one can imagine that intercalation process
should control the doping in the case of FLG samples.
Several electron donor and electron acceptor (EDA) molecules have been
nanotubes (SWNTs), see Ref [13] for a recent review. Substantial experimental
studies have been performed to modify the properties of carbon nanostructures and
understand changes in their electronic structures. Several experimental works have
investigated interactions between carbon nanostructures and EDA molecules, such as
TCNQ,14,15 TTF,16,17 TCNE,18,19 and F4-TCNQ.20 Charge transfer induced by EDA
molecules is usually indirectly observed, but n-doping and p-doping have been
reported mainly by Raman spectroscopy. However the amount of charge transfer is
seldom reported due to the difficulty of quantifying the charge transfer by a proper
measure in any experimental studies. To obtain a direct estimate of charge transfers
and a better understanding of their effects, theoretical studies are mandatory. For
instance, studies based on density functional theory (DFT), on TCNQ,21 benzene,22,23
DDQ,11,22 TTF21,22,24 or TCNE10,25 molecules adsorbed on graphene or SWNTs have
been reported. In substance, their main conclusions are that non-covalent
functionalization definitively leads to electronic structure’s modifications. For
instance F4-TCNQ, TCNQ and TCNE molecules can pull electrons from graphene,
while TTF or TDAE10 molecules can give electrons to graphene. Usually this CT is
determined by a Mulliken population analysis.
One has to keep in mind that the description of ground state CT complex using
standard DFT calculations is still challenging. It is well known that Local Density
Approximation (LDA) of the exchange-correlation functional are known to
overestimate the binding energies of strong CT complexes,26 and the CT values.
Exchange-correlation functionals based on Generalized Gradient Approximations
(GGA) usually perform better,27 and improved results can be obtained with, first the
inclusion of an amount of exact exchange and more importantly with the addition of a
In this study, we have investigated theoretically the binding, the CT of a
typical acceptor molecule (TCNE) and a prototypical donor (TTF) with graphene
monolayer and bilayer. We have studied the effects of the inclusion of van der Waals
forces, by a non-empirical correction. Weak interactions definitively stabilize the
system, yielding larger binding energies, but more importantly provide more reliable
geometries. For graphene ML, an efficient p-doping is obtained, around 0.5 e for a
molecular concentration of one percent approximately, in the case of a withdrawing
molecule, without a strong change in the electronic structure. Larger concentrations of
adsorbate are needed to obtain similar CT values in the case of n-doping by TTF. In
the case of bilayer, intercalation of EDA molecules decouples the two MLs and
efficiently dopes the system. The paper is organized as follow: next section is devoted
to the computational settings and model presentations. Then results dealing with
graphene monolayer and bilayers are reported in section 3, followed by the
conclusion.
2. Computational details
We have performed total-energy DFT calculations with the Vienna ab initio
simulation package VASP.28–31 The code uses the full-potential projector augmented
wave (PAW) framework.32,33 A 400 eV cutoff energy for the plane-wave basis set was
used. In order to compare our results with previous ones, we have used the semi-local
Perdew-Burke-Ernzerhof (PBE),34 and LDA35 exchange-correlation (xc)-functionals.
We have also used the vdW-DF functional,36,37 that accounts for dispersion effects
self-consistently, in conjunction with PBE xc-functional for short-range effects. We
are aware of recent results dealing about accuracy of vdW-DF scheme38 and the
scheme, we were able to obtain a correct interlayer distance in graphite 3.4 Å, despite
a value of the cleavage energy (65 meV/atom) larger than a more accurate estimate42
(56 meV/atom). All atoms have been fully relaxed until the forces on individual
atoms were smaller than 0.02 eV Å−1. The Brillouin zones (BZ) of the calculation
cells have been sampled according to a Γ-centered grid. Besides, k-points sampling
has been determined by converging total energy within several meV.
Considering the models to describe the molecule/graphene at several
adsorption’s situations and at various concentrations, we have considered: 1 molecule
on a graphene ML made of 98 carbon atoms (7x7 primitive cells), 1 molecule inserted
in a bilayer (98 carbon atoms for each layer), 2 molecules adsorbed on both sides of
one ML with 98 carbon atoms, 1 molecule on graphene ML made of 24 carbon atoms
(3x4 primitive cells) and 2 molecules on the same ML. Additionally we have
carefully chosen a sufficient vacuum length in the (Oz) direction to avoid spurious
interaction between periodic images.
We have employed Bader Charge Analysis method43 to estimate the charge
transfer in the different xc-functional approximations, using Bader program of G.
Henkelman’s group.44–46 In order to follow the tracks of electronic structure changes
of the molecules, numerical derivatives were used to calculate harmonic frequencies
of the adsorbed molecules and compared to freestanding molecule situations.
To discuss thermodynamically the stability of the various configurations, the
key parameter is the adsorption energy. It is defined for a molecule on a carboneous
substrate as:
where n stands for the number of adsorbed molecules. One needs to subtract the total
energy of the carbon nanostructure (E(graph)) and the freestanding molecule energy
(E(mol)) from the total energy (E(mol/graph)) of the relaxed molecule on the carbon-based
system.
According to the highly symmetrical geometries of TTF, TCNE molecules and
the honeycomb structure of the carboneous substrates, we have considered four
different configurations, as in a previous theoretical work.25 The corresponding
orientations of the molecules are presented in Figure 1. Additionally we have tested a
non-symmetrical configuration (Figure 1-B(c)), denoted displaced position in the
following. The configuration’s name refers to the relative position of the central C=C
bond of the adsorbed molecule with respect to the graphenic plan.
A
B
Figure 1. Top view of schematic structures of different adsorption configurations for
TTF on graphene panel A: a. Hollow-I, b. Bridge-I, c. Displaced, d. Hollow-T, e. Bridge-T. TCNE on graphene panel B: a. Bridge-I, b. Hollow-I, c. Displaced, d. Hollow-T, e. Bridge-T. The grey lines represent the flat graphene layer. The carbon atoms are in grey, nitrogen atoms are in blue, hydrogen atoms are in white, and yellow balls stand for sulfur atoms.
3. Results and Discussion
3.1. Adsorption modes of TTF@graphene
The Hollow-I, Hollow-T, Bridge-I, Bridge-T and the displaced adsorption
modes of a single TTF molecule on graphene are depicted in Figure 1-A. Some
geometry changes due to the interaction between TTF and graphene are observed,
mainly at the molecule level with the three tested xc-functionals. The molecule is
bent, with a dihedral angle of 162° defined by the C=C central bond and two
hydrogen atoms at the molecule extremity), while the graphene ML stays almost flat.
Although the molecule is curved, its geometric key parameters like bond-length vary
only little (within 0.04 Å), while angles retain the values of the freestanding TTF molecule. The equilibrium distance between the TTF molecule and the graphene layer, defined as the distance between the middle C=C bond and the graphene layer depends on the xc-functional choice. As expected, the larger value is for PBE (3.6 Å),
while vdW-DF reduces it by 0.1 Å. The LDA equilibrium distance is 3.4 Å, which
can be viewed as a first indication of a too strong delocalization of the molecular
electronic density.
Table 1(a) summarizes adsorption energies of the different configurations for
TTF/graphene system in PBE, LDA, and vdW-DF respectively. The most stable
configuration is the “Bridge-T” configuration (Figure 1-A(e)) for the three tested functionals. This result is consistent with previous studies.22 Indeed using LDA, Sun
et al24 report a value of −16.6 kcal/mol for the adsorption energy in LDA, while in
Ref [21], the adsorption energy is about −7 kcal/mol for the same adsorption mode.
Mind that these differences can be attributed to various computational settings and
TABLE 1: Adsorption Energy (in kcal/mol) of TTF(a) and TCNE(b) on graphene
Monolayer and charge transfer (in elementary charge unit (e)) between molecules and graphene in the case of five different sites, for 3 different flavors of exchange-correlation functionals, at low concentration (1 molecule per 98 C atoms).
a)
Configuration (PBE) (LDA) (vdW-DF) Eads CT Eads CT Eads CT
Hollow-I –1.5 0.11 –12.8 0.21 –28.7 0.06 Bridge-I –1.5 0.12 –12.0 0.19 –28.6 0.07 Displaced –1.6 0.13 –13.0 0.21 –28.6 0.07 Hollow-T –1.5 0.12 –13.2 0.20 –28.7 0.06 Bridge-T –1.7 0.11 –14.1 0.20 –29.2 0.07 b)
Configuration (PBE) (LDA) (vdW-DF) Eads CT Eads CT Eads CT
Bridge-I –8.4 –0.45 –17.8 –0.44 –31.8 –0.45 Hollow-I –9.3 –0.44 –19.5 –0.44 –32.9 –0.46 Displaced –8.4 –0.44 –18.8 –0.44 –32.4 –0.46 Hollow-T –9.1 –0.46 –19.4 –0.45 –32.7 –0.49 Bridge-T –8.3 –0.47 –17.9 –0.46 –31.9 –0.48
Interestingly the adsorption energies of five sites are almost equal for one
particular choice of functional. It reveals that the TTF molecule can move or even
rotate relatively easily, especially at room temperature, at very low energetic cost.
When comparing the three tested functionals, LDA binds the system with an
adsorption energy of around −13 kcal/mol, while very weak binding is yielded with
PBE. By including non-local correlation terms, i.e. with the vdW-DF functional, a
stronger binding is obtained, more than twice LDA Eads values, as a result of van der
Waals forces contribution. It means that, as explained in the recent study of
Steinmann et al,27 dispersion forces have a significant additive stabilization’s effect on
CT systems. An indirect proof of the existence of this weak interaction, between the
molecule before and after adsorption. A tiny shift of the central C=C bond frequency
is observed from 1525 cm−1 to 1489 cm−1 with PBE functional. This clearly indicates
that there is only weak binding between a graphene ML and TTF. It is mainly a
physisorption-dominant process only, which does not alter the electronic structure of
the molecule, as observed experimentally.14 PBE provides no binding at all, by
missing non-local correlations and by not compensating them by a cancellation of
errors as in the LDA case.
The Table 1(a) also presents CT between the two subsystems, after charge
integration over atomic basins as defined by a Bader analysis. Independently of the
adsorption modes, a small charge transfer from the molecule to the graphene layer is
estimated both in PBE and vdW-DF. The CT value is roughly of 0.1e for a
concentration of round 1%, since there is one molecule adsorbed per 98 C atoms. On
the contrary, a charge transfer significantly larger (0.2e) occurs with LDA. These
values are in good agreement with previous studies that report a CT of 0.1 e 24 and
0.26e 22 for LDA. To understand this discrepancy between LDA and GGA results,
one has to remind that, as reported in a recent theoretical work,47 LDA intrinsically
tends to delocalize the electron density, while GGA usually contract it. This CT
overestimate appears as a pure artifact of the xc-functional used, and results of a
larger overlap between the “too-delocalized” electronic densities of the two
sub-systems. Indeed, since a work of J. Harris48 in the 80’s, it is known that, at small
overlaps, the balance in the total energy, between the exchange term and the kinetic
term, is broken in the LDA scheme contrary to a Hartree-Fock calculation. This
provides a spurious binding from the exchange contribution of the Hamiltonian, with
the non-local correlation on CT values is very small, and this process is governed by
exchange mainly.
A last evidence of the very weak effect of the TTF molecule adsorption is
obtained by comparing the Band Structure (BS) of TTF/graphene system with the
pristine graphene situation obtained at the PBE level. As it is shown in Figure 2(b),
the presence of the well-localized molecular state placed just in the vicinity of the
Fermi level, and a very tiny gap opening are the only changes in the BS induced by
TTF adsorption, at this particular concentration. Contrarily to previous theoretical
studies, TTF at low concentration does not n-dope graphene. Since the physisorption
of a TTF molecule does not disturb the electronic structure of graphene, it means that
the interaction of this particular electron donor stays weak as soon as the
concentration is around 1%. (a) M -2 -1 0 1 2 E [eV] K
(b)
(c)
Figure 2: Band structures of pristine graphene (a), TTF/graphene system (b), and
TCNE/graphene system (c) at low concentration.
3.2. Adsorption modes of TCNE@graphene
Figure (1-B) depicts the five tested configurations of the TCNE@graphene
system at low concentration. After relaxation, the TCNE molecule stays flat and
parallel to the graphene layer. Distance between TCNE and the honeycomb layer is
about 3.0, 3.2, and 3.3 Å in LDA, vdW-DF and PBE respectively. A first indication of
a CT occurring between the two subsystems, is the significant change in the bond–
Γ M -2 -1 0 1 2 E [eV] K Γ M -2 -1 0 1 2 E [eV] K
length of the central C=C from 1.38 to 1.41 Å, without inducing strong deformations
of the graphenic network.
The adsorption energy in Table 1(b) provides interesting information. TCNE
is bound to graphene, no matter the choice of the xc-functional, contrarily to the
prototypical donor molecule, i.e. TTF. The most stable configuration is the
“Hollow-I” site shown in Figure (1-B(b)), for the three tested xc-functionals. This result is in
good agreement with previous theoretical works10,25 for LDA and PBE. The inclusion
of long-range correlations stabilizes by almost 24 kcal/mol the system when
compared to the PBE value. This large value results probably of our choice to use
PBE+vdW-DF functional, and we agree that another choice of short-range exchange
functional would certainly reduce this absolute value. Besides, similar to the TTF’s
case, TCNE also has good mobility on graphene, due to small energy differences
among the different high-symmetry adsorption sites. One should also notice that at
this low concentration of adsorbates, TTF and TCNE have very similar adsorption
energy values on graphene ML.
When looking at the frequency of the central C=C bound, at the PBE level, we
have found a significant downshift from 1516 to 1413 cm−1, which is compatible with
the observed increase of the bond-length. This can be viewed as a first evidence of a
change in the molecular electronic structure that may originate from a partial CT from
the graphene to the molecule. Indeed, direct estimate of the CT from graphene to
TCNE is detected. The corresponding values for the three functionals are presented in
Table 1(b). In all cases, a charge of ~0.46e is transferred from graphene to TCNE at
this particular low concentration. The agreement with previous estimates 0.3e,10 0.44
e25 and with reported values with parent molecules like TCNQ (0.3e)10 and F4-TCNQ
indicates that this loss of charge in graphene is attributed to the carbon atoms in the
close vicinity of the adsorbed TCNE. On the other side, the charge gained by TCNE
mostly settles on the N atoms of cyano groups and, to a lesser extent, on the two
central C atoms.
This CT has a drastic consequence in the electronic structure of the graphenic
substrate. The band structure (BS) of the TCNE/graphene system is presented in
Figure 2(c). The main feature is the alignment of the occupied molecular state and the
Fermi level of the total system. As a consequence the Fermi level is shifted below the
typical K-point crossing of the pristine graphene by a value of 0.2 eV, leaving
unchanged the linear dispersion around this point. Thanks to this pure p-type doping
the substrate becomes metallic. This interesting property is in good agreement with a
significant drop in the resistivity of graphene sample doped by TCNE.18 As a
consequence at the same concentration, p-doping is much more efficient that n-doping
of graphene, as it has been proposed based on experimental evidences.17,19,50
Additionally a non-crossing point just after point K appears in the BS at the Fermi
Level, meaning that the occupied molecular charged state has the same symmetry as
the π states of graphene.
The following subsection is devoted to rationalize CT mechanism with
graphene ML thanks to the adaptation of the Integer Charge Transfer (ICT) model
widely in use in the context of energy-alignment at organic/metal interface.51
3.3 Charge Transfer mechanism of graphene
Recently based on the conventional Newns-Anderson model,52 Nistor et al53
disproportionation of adsorbed dopant layers into CT complexes. Basically, the key
parameter that should control the p-doping process is the energy difference between
the lowest unoccupied molecular orbital (LUMO) energy and the work function of the
graphene. In the same spirit, to rationalize the n-doping mechanism, simply by
mirroring the electron and hole density, the key parameter that control the CT, should
be the energy difference between the Ionization Potential (IP) of the molecule, i.e the
highest occupied molecular orbital (HOMO), and the work function of the graphene.
In the ICT model,54,55 which describes, with success, interfaces that are characterized
by a negligible hybridization of molecular orbitals and substrate states, CT occurs
through tunneling, since the substrate work function is greater than the formation
energy of a positively charge donor state (D+ in the following) for n-doping or since
the substrate work function is smaller than the formation energy of a negatively
charge acceptor state (A− in the following) for p-doping. These molecular charged
states D+/A−can be viewed as derived-states of HOMO or LUMO ones, lying in the
molecular band-gap. They take into account for the changes in electronic and
geometrical structures of the adsorbed species after release/withdrawing of electronic
density, and interestingly they also depend on the substrate’s screening meaning that
the distance between the adsorbate and the graphenic substrate is a key parameter.
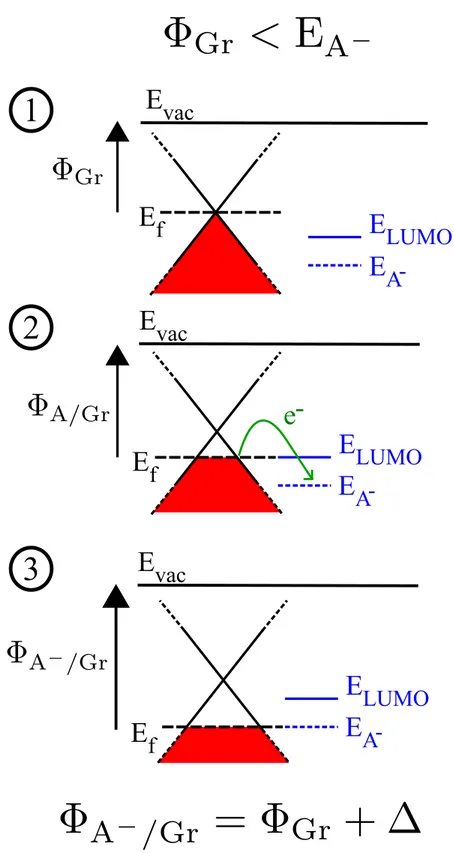
Figure 3 summarizes the p-doping process that corresponds to the
TCNE/Graphene situation. As proposed by Braun et al,51 one can represent the CT
mechanism in three steps. Figure 3 panel 1, shows the energetic configuration before
bringing together the two subsystems. Again, we recall that to yield a significant CT,
the work function ΦGr has to be smaller than EA-, the energy of the negatively charged
state of the molecule. By reducing the distance (Fig. 3 panel 2) electronic density
to the positively charged substrate facing a negatively charged molecule. This dipole
increases the work function of the hybrid system, in other words, it downshifts the
Fermi level, leaving the BS of the substrate unchanged. This increase of the work
function continues until the alignment between EF and EA- is reached, Figure 3 panel
3. The resulting work function ΦA-/Gr is equal to EA-, meaning that the Fermi level is
pinned to the molecular negatively charged state at the interface. ∆ the energy
corresponding to the interface dipole is equal to the difference between the energy EA-
Figure 3: Scheme of p-doping process: panel 1 presents the energy levels before the
interaction starts. Panel 2 shows intermediate situation, with the electronic flow, while Panel 3 corresponds to the final energy alignment.
Figure 4: Scheme of n-doping process: panel 1 presents the energy levels before the
interaction starts. Panel 2 shows intermediate situation, with the electronic flow, while Panel 3 corresponds to the final energy alignment.
Figure 4 shows a schematic view of the n-doping process as one could expect
the work function ΦGr has to be greater than ED+, the energy of the positively charged
state of the molecule. Bringing the donor molecule in contact with the graphene ML,
(Fig. 4 panel 2) electronic density start to leave the molecule to fill empty states of the
substrate. In return it creates a dipole that originates from the negatively charged
substrate facing a positively charged molecule. This dipole now decreases the work
function of the hybrid system, that shifts up the Fermi level. The equilibrium is
obtained when EF matches ED+. The resulting work function FD+/Gr is equal to ED+,
meaning that the Fermi level is pinned to the molecular positive charged state at the
interface. The work function difference before and after adsorption represents the
energy corresponding to the created dipole at the interface. No CT will occur if FGr is
smaller than ED+, or FGr is larger than EA-. A so-called vacuum level alignment holds
for this type of interface.
This model helps us to understand non-covalent p-doping of a graphene ML
by TCNE molecules. Indeed by comparing the work function of the graphene sheet
before (FGr=4.25 eV) and after adsorption (FA-/Gr=4.85 eV), we have another indirect
evidence of CT. This increase of the work function is in good agreement with
experimental determinations, usually with an upshift of around 0.3−0.5 eV as reported
in Ref. [51] in the context of organic semi-conductor/conducting substrate interfaces.
Theoretically speaking, the situation is not ideal as well. Indeed the fact that
semi-local xc-functional usually underestimates molecular band-gaps,56 starts to be
problematic in order to predict quantitative results. For instance, in the TCNE case,
we estimate that the LUMO energy of TCNE is 5.87 eV, a value largely overestimate
when compared to the experimental one. Additionally our DFT estimate of the work
function (4.2 eV) is slightly smaller than the value proposed in a previous theoretical
energy combined with the underestimate of the work function, in standard DFT
calculations, provides the necessary condition, by fortuitous cancellation of errors,
that yields CT between TCNE and the graphene ML.
After adsorption of a single TTF molecule on the (7x7) primitive cell model of
graphene, no significant change in the work function of the hybrid system is observed,
meaning that with semi-local xc-functional calculations, we obtain a vacuum-level
alignment regime at the interface only. The well-reported underestimate of the
HOMO energy in standard DFT calculations is present here too, with a value of 4.7
eV. Besides, by extrapolating the ED+ value, with a minoring of 0.5 eV as it is
observed experimentally,51 the negatively charged state still lies below the Fermi level
of the graphene sheet. This provides explanation for the absence of CT between TTF
and our graphene ML at low concentration.
Experimentally speaking if one compares brute data, i.e the ionization
potential of the TTF molecule (6.70 eV),59 and the work function of graphene (4.6
eV), and even if one estimates roughly the D+ state energy by using the same
percentage of reduction as in some reported experimental data, see Ref [51] and
references therein, no CT should be observed experimentally. As far as the electronic
states of the molecules do not mix with surface states of the substrate, an image
charge contribution is present.60 In the case of metallic substrates, one can expect a
significant reduction of the energy of the D+ state, following this law 1/(4*Rads) with
the distance of the adsorbate to the surface. Hence, the positively charged state can be
significantly higher in the molecular HOMO-LUMO gap. We have checked this
assumption in a series of calculations, in which we have reduced the distance between
the TTF molecule and the graphene sheet, from the equilibrium distance. As reported
indirect proof of this image charge effect observed experimentally. As it is reported in
the next subsection, increasing the concentration of adsorbates can compact the
structure, i.e reducing the average distance to the graphenic substrate.
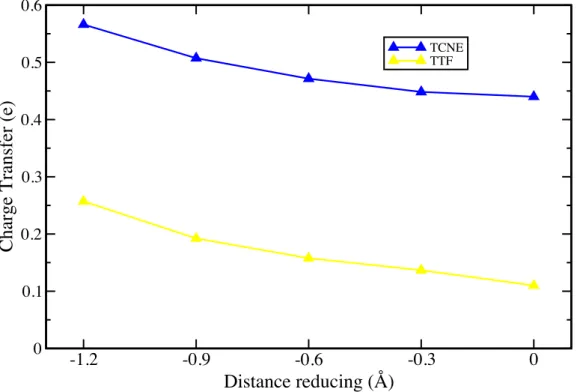
Figure 5: Charge transfer (in elementary charge unit (e)) versus the distance reducing
from the equilibrium distance of TTF and TCNE on graphene, at low concentration. It means that distance reducing 0 stands for equilibrium position while −1.2 Å stands for a decrease of 1.2 Å from the equilibrium distance.
Clearly, tuning the work function of graphene could be essential to the use of
graphene for transparent electrodes, see reference [61] for instance, since Fermi level
of graphene stays well aligned with the hole-injecting molecules, avoiding Ohmic
contact or Schottky barrier. Varying CT by changing adsorption modes,
concentration, could be of first importance for possible applications; this is discussed
in the next paragraph.
-1.2 -0.9 -0.6 -0.3 0 Distance reducing (Å) 0 0.1 0.2 0.3 0.4 0.5 0.6
Charge Transfer (e)
TCNE TTF
3.4 Tuning the CT mechanism of graphene
To study the influence of the concentration of the adsorbed molecules the
practical way is to reduce the calculation’s cell: we have chosen to test a situation of
one molecule per 24 C atoms. At this particular coverage value, the intermolecular
distance becomes relatively small: 2.4 Å for TTF and 2.6 Å for TCNE and has strong structural consequences. Firstly this leads to an enhancement of the lateral
intermolecular interaction, but a weakening of the interaction between molecules and
the graphene layer. This is reflected in the change of the molecule/graphene distances
enlarged by 0.4 Å and 0.3 Å for TTF and TCNE respectively. Secondly the small
intermolecular distances cause intermolecular repulsion that distorts molecular
structures drastically. For example, TTF becomes more curved, the dihedral angle is
now 149°; the angle of C≡N−C=C changes from 118 to 115 degrees to reduce
repulsion from steric effect. Interestingly bond lengths of adsorbed molecule remain
almost identical as in the low concentration situation. As expected, the adsorption
energy is less important than at low concentration, in other word the systems are less
bound (7.4 kcal/mol) due to lateral interactions. This may partially explain
experimental results, in which donor molecules tend to bind less to graphene than
acceptor molecules.14
Considering the CT at this concentration, TTF molecule does not transfer
density to the graphene layer. On the contrary a charge of 0.18e per TCNE molecule is transferred from graphene to TCNE. Although total charge transfer decreases in high concentration, charge transfer per carbon atom increases from 0.0046 (1
the Raman upshift of the G-band with respect to the dopant concentration; see Ref
[18, 19] for instance. Since the charge transfer remains mainly local (limited in
space), the molecular packing over the substrate is a key parameter to enhance the
charge transfer.
Additionally doubling the concentration, (two molecules on a 24-carbon
layer), is about to explain a recently published experimental work. It has been
reported that when an effective dopant like F4-TCNQ is densely packed on epitaxial
graphene film, most of the molecules are standing up.62 The authors have proposed
that the dopant molecules would be perpendicular to the graphene layer, since the
dopant concentration becomes significant. To verify this, we have studied two
different configurations: two molecules perpendicular to graphene and two molecules
parallel to graphene at large coverage value. The relaxation process starting from two
molecules parallel to graphene shows that this configuration is highly unstable.
Balance between intermolecular repelling, limiting space and attractive interaction
with the graphene layer slantingly aligns the molecules on graphene. See Figure 6
panel (a) for geometry’s snapshots, of this double molecular layer configuration.
Energetically speaking, when 2 TTF molecules interact with the graphene ML, the
slanting adsorption mode is more stable, by more than 10 kcal/mol, (Table 2) than the
perpendicular mode, due to the strong repelling between the molecules.
(a) (b)
Figure 6: Side view of two molecules adsorbed on a graphene monolayer at high
concentration, 2 molecules per 24 C atoms. Panel a: Two TTF molecules (left) and two TCNE molecules (right) slantingly adsorbed on graphene ML. Panel b: Two TTF molecules (left) and two TCNE molecules (right) perpendicularly adsorbed on graphene ML.
TABLE 2: Adsorption Energy (in kcal/mol) of TTF and TCNE on Graphene
Monolayer at a High Concentration (2 molecule per 24 C atoms) and Charge Transfer (in elementary charge unit (e)) Between Molecules and Graphene.
PBE vdW-DF Eads CT Eads CT
TTF Slanting –2.1 0.02 –31.6 0.03 Perpendicular –0.7 0.06 –21.9 0.05 TCNE Perpendicular Slanting –2.1 –2.8 –0.11 –0.17 –20.7 –21.2 –0.11 –0.18
In the case of acceptor molecules (like TCNE) the configuration with two
molecules perpendicular to graphene (see Figure 6(b)) is stabilized by only 0.5
kcal/mol. This simply means that in the TCNE case, slanting and perpendicular
adsorption modes are degenerate. This result confirms the proposed schematic
deposition of F4-TCNQ molecules on graphene ML grown on SiC in Ref [62]. Indeed
in both configurations two types of N atoms would be detected in XPS experiments,
the ones closer to the graphene layer with a more pronounced N−1 character and the
others staying uncharged. Moreover, the perpendicular configuration enhances the CT
for the graphene to the TCNE molecules: doubling again the concentration leads to a
doubling of the CT per carbon atom, from 0.0075 e/C to 0.015 e/C. This phenomenon
originates from the fact that in perpendicular configuration the two molecules interact
with the graphene ML.
Another possible situation has been explored: the symmetrical and displaced
energy per molecule stays close to one obtained by a single adsorbed molecule: −29.2
kcal/mol and −30.7 kcal/mol for TTF and TCNE in symmetrical co-adsorption
configuration respectively, while the adsorption energy for TTF and TCNE in
displaced co-adsorption mode is −29.6 and −31.1 kcal/mol. The distance between
molecule and graphene remains the same as in the one-side adsorption mode, in both
cases. The graphene ML is slightly buckled in opposite direction due to displaced
adsorption of molecules, however, it remains flat in symmetrical co-adsorption mode.
The graphene ML gives 0.30e to each TCNE, and each TTF provides 0.09e to
graphene layer. This adsorption mode also enhances CTs from the graphene point of
view. This significantly modifies the electronic structure of the graphene ML, as it
can be seen in Figure 7(a) and (b). For instance with the 2TTF/graphene system, the
upshift of the Fermi level is now 0.36 eV, while it is not significant for one molecule
adsorbed. With two TTF molecules symmetrically adsorbed, graphene is more
effectively n-doped, probably due to the fact that the adsorption of a first molecule on
one side decreases the work function of the hybrid ML compared to the pristine one
and favors a CT on the other side, which in return reduces the work function.
Meanwhile, for 2TCNE/graphene system, the Fermi level is shifted down by 0.57 eV
when comparing to the doped graphene by a single molecule case. To summarize,
below a certain concentration (around 8%), doping effect on graphene due to
non-covalent interaction can be reinforced by increasing dopant’s concentration, i.e with
(a)
(b)
Figure 7: Band structures of symmetric TTF/graphene/TTF hybrid system (a) and
TCNE/graphene/TCNE (b) at low concentration.
Without a good control in the synthesis process, graphene samples usually
appear to be few layers graphene (FLG) instead of a single monolayer (ML). For
instance the samples used in recent experiments17–19,50 to study by Raman
spectroscopy CT effects on graphene, are typically made of 2 to 6 layers. To
investigate the interaction with FLG, we have intercalated TTF and TCNE molecule
Γ M -2 -1 0 1 2 E [eV] K Γ Γ M -2 -1 0 1 2 E [eV] K Γ
between two graphene MLs presenting an AA-stacking and AB-stacking. In this
situation the concentration of adsorbate is one molecule per 196 C atoms. The
interlayer spacing is known to be crucially dependent to the xc-functional choice. At
the vdW-DF level, the AA-stacking layers are stabilized with an interlayer spacing of
6.4 Å and 6.2 Å for TTF and TCNE molecule respectively. Besides, the distance
between the layers in the AB-stacking is 0.2 Å smaller than in the AA-stacking
situation. When the calculations are performed with the pure PBE functional, the
separations between two layers are 6.8 Å and 6.4 Å for TTF and TCNE respectively,
regardless of bilayer’s stacking mode. In both cases, the molecule just locates in the
middle of interlayer spacing, and remains completely flat due to symmetrical
interactions. However, the two graphene MLs are buckled independently of the
molecule; the two closest carbon atoms to the molecule moved in opposite directions
of the intercalated molecule by almost 0.2 Å.
(a) (b) (c) (d) Γ M -2 -1 0 1 2 E [eV] K Γ -2Γ M -1 0 1 2 E [eV] K Γ
(e) (f)
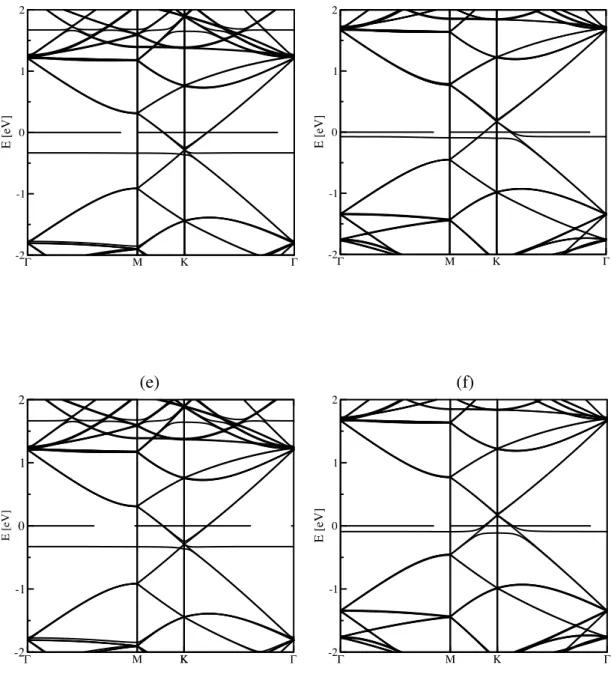
Figure 8: Band structures of pristine AA-stacking (a) and AB-stacking bilayer (b),
TTF (c) and TCNE (d) intercalated into an AA-bilayer graphene, while (e) and (f) panels are for intercalated AB-bilayer systems.
Interestingly, TTF looses 0.18 e to the two layers; meaning that for each layer,
the charge transfer value is equal to the one observed in the monolayer case, for
AA-stacking, while the AB-bilayer obtains 0.19e from the TTF molecule. TCNE gets
0.61e from the AA-bilayer. Same value is yielded for the AB-stacking system. Each
layer contributes less than in the isolated situation probably due to a saturation of the
molecular electronic density. The effect of the doping is visible in the BSs shown in
Γ M -2 -1 0 1 2 E [eV] K Γ -2Γ M -1 0 1 2 E [eV] K Γ Γ M -2 -1 0 1 2 E [eV] K K Γ -2Γ M -1 0 1 2 E [eV] K Γ
Figure 8(c) and (d). Energy bands at low energies near K/K′ are still linear dispersed,
which are different from electronic structure of a pair of coupled graphene MLs.63
This is due to the large interlayer distance that decouples the layers due to
electrostatic effect, since each ML is now charged. Therefore, the intercalation of
molecules into AA-stacking or AB-stacking makes almost no difference in the BS’s.
Indeed, the two possible bilayer have nearly the same binding energy64,65 and band
structure66 when the interlayer spacing is greater than 4 Å, when they decouple. A
resulting downshift of 0.17 eV for Fermi level is observed in the case of TCNE
intercalation, an upshift of 0.29 eV in the case of TTF.
4. Conclusion
Adsorption of the two electron donor/acceptor molecules does not cause
significant structural distortion in the honeycomb carbon network of a graphene
monolayer. Nevertheless slight buckling has been observed in the two-side adsorption
mode or in the intercalation of TCNE or TTF molecules. Interestingly there is no
evidence of chemical bond’s formation between the two organic molecules and the
graphenic nanostructures. It means that the interaction is physisorption mainly, which
reveals the fundamental role played by van der Waals’ forces. Indeed a good
description of these weak interactions are mandatory in such hybrid systems, since to
yield a correct charge transfer, a correct equilibrium distance is needed, due to charge
image effect. Since standard semi-local functionals usually provide too large
distances, one can expect an underestimation of the charge transfer. That’s also why
LDA which usually provides too small equilibrium distances, tends to overestimate
rationalized by a simple model, in the case of graphene monolayer and bilayer.
Basically, thanks to a simple model of CT through an organic/metal interface, based
on derived HOMO or LUMO states, the capability of molecules to dope graphene
ML.
We have shown that it is possible to control the carrier type and concentration
in graphene by adjusting of dopant’s type, concentration and adsorption modes. At
low concentration, p-doping of graphene is already efficiently realized by TCNE
molecules, while n-doping is one order in magnitude less important when a graphene
ML interacts with TTF molecules. Mind that an increase of the doping is observed, by
means of CT value increase, when the concentration is increased. This statement is in
good agreement with experimental works, in which it is usually indirectly observed
by shifts in Raman spectroscopy. In the case of TTF molecules, two-side adsorption
mode provides better CT than one-side adsorption mode. Moreover intercalation of
acceptor/donor molecules decouples the two layers but also dope them.
It could be interesting to study extensively the effect of curvature, with respect
to the charge transfer, since the sp3 character of C atoms is pronounced in small
diameter nanotubes while one should recover graphene behavior for very large
diameter SWNTs. Moreover, since work-functions of semi-conductor tubes are
different from metallic ones up to a certain threshold value,67 one can expect
variations of CT with different chiral indexes for tubes presenting small diameters.
Works are in progress in this direction.
The authors would like to thank P. Puech and Pr. R. Poteau for fruitful
discussions. They also thank the CALcul en MIdi-Pyrénées (CALMIP, grant
2011/2012-P0812) for generous allocations of computer time. Part of this work was
also performed using HPC resources from GENCI-[CINES] (Grant 2011/2012-6357).
Finally, T. Hu would like to thank CSC-INSA consortium for financial support for his
References and Notes
(1) Das Sarma, S.; Adam, S.; Hwang, E. H.; Rossi, E. Rev. Mod. Phys. 2011, 83, 407–470.
(2) Geim, A. K.; Novoselov, K. S. Nature Mater. 2007, 6, 183–191. (3) Novoselov, K. S. Science 2004, 306, 666–669.
(4) Zhang, Y.; Tan, Y.-W.; Stormer, H. L.; Kim, P. Nature 2005, 438, 201–204. (5) Novoselov, K. S.; Geim, A. K.; Morozov, S. V.; Jiang, D.; Katsnelson, M. I.;
Grigorieva, I. V.; Dubonos, S. V.; Firsov, A. A. Nature 2005, 438, 197–200. (6) Schedin, F.; Geim, A. K.; Morozov, S. V.; Hill, E. W.; Blake, P.; Katsnelson, M.
I.; Novoselov, K. S. Nature Materials 2007, 6, 652–655.
(7) Wehling, T. O.; Novoselov, K. S.; Morozov, S. V.; Vdovin, E. E.; Katsnelson, M. I.; Geim, A. K.; Lichtenstein, A. I. Nano Lett. 2008, 8, 173–177.
(8) Georgakilas, V.; Otyepka, M.; Bourlinos, A. B.; Chandra, V.; Kim, N.; Kemp, K. C.; Hobza, P.; Zboril, R.; Kim, K. S. Chemical Reviews 2012, 112, 6156– 6214.
(9) Pinto, H.; Jones, R.; Goss, J. P.; Briddon, P. R. Phys. Status Solidi (a) 2010, 207, 2131–2136.
(10) Chi, M.; Zhao, Y.-P. Comput. Mater. Sci. 2012, 56, 79–84.
(11) Tournus, F.; Latil, S.; Heggie, M. I.; Charlier, J.-C. Phys. Rev. B 2005, 72, 075431–075435.
(12) Park, S.; Ruoff, R. S. Nature Nanotechnology 2009, 4, 217–224. (13) Rao, C. N. R.; Voggu, R. Materials Today 2010, 13, 34–40.
(14) Varghese, N.; Ghosh, A.; Voggu, R.; Ghosh, S.; Rao, C. N. R. J. Phys. Chem.
C 2009, 113, 16855–16859.
(15) Yuge, R.; Yudasaka, M.; Maigne, A.; Tomonari, M.; Miyawaki, J.; Kubo, Y.; Imai, H.; Ichihashi, T.; Iijima, S. J. Phys. Chem. C 2008, 112, 5416–5422. (16) Voggu, R.; Rout, C. S.; Franklin, A. D.; Fisher, T. S.; Rao, C. N. R. J. Phys.
Chem. C 2008, 112, 13053–13056.
(17) Choudhury, D.; Das, B.; Sarma, D. D.; Rao, C. N. R. Chem. Phys. Lett. 2010,
497, 66–69.
(18) Voggu, R.; Das, B.; Rout, C. S.; Rao, C. N. R. J. Phys.: Condens. Matter
2008, 20, 472204–472208.
(19) Subrahmanyam, K. S.; Voggu, R.; Govindaraj, A.; Rao, C. N. R. Chem. Phys.
Lett. 2009, 472, 96–98.
(20) Chen, W.; Chen, S.; Qi, D. C.; Gao, X. Y.; Wee, A. T. S. J. Am. Chem. Soc.
2007, 129, 10418–10422.
(21) Manna, A. K.; Pati, S. K. Chem. Asian J. 2009, 4, 855–860.
(22) Zhang, Y.-H.; Zhou, K.-G.; Xie, K.-F.; Zeng, J.; Zhang, H.-L.; Peng, Y.
Nanotechnology 2010, 21, 065201–065207.
(23) Tournus, F.; Charlier, J.-C. Phys. Rev. B 2005, 71, 165421–165428.
(24) Sun, J. T.; Lu, Y. H.; Chen, W.; Feng, Y. P.; Wee, A. T. S. Phys. Rev. B 2010,
81, 155403–155408.
(25) Lu, Y. H.; Chen, W.; Feng, Y. P.; He, P. M. J. Phys. Chem. B 2009, 113, 2–5. (26) Ruiz, E.; Salahub, D. R.; Vela, A. J. Am. Chem. Soc. 1995, 117, 1141–1142. (27) Steinmann, S. N.; Piemontesi, C.; Delachat, A.; Corminboeuf, C. J. Chem.
Theory Comput. 2012, 8, 1629–1640.
(29) Kresse, G.; Hafner, J. Phys. Rev. B 1994, 49, 14251–14269.
(30) Kresse, G.; Furthmüller, J. Computational Materials Science 1996, 6, 15–50. (31) Kresse, G.; Furthmüller, J. Phys. Rev. B 1996, 54, 11169–11186.
(32) Blöchl, P. E. Phys. Rev. B 1994, 50, 17953–17979.
(33) Kresse, G.; Joubert, D. Phys. Rev. B 1999, 59, 1758–1775.
(34) Perdew, J. P.; Burke, K.; Ernzerhof, M. Phys. Rev. Lett. 1996, 77, 3865–3868. (35) Kohn, W.; Sham, L. J. Phys. Rev. 1965, 140, A1133–A1138.
(36) Andersson, Y.; Langreth, D. C.; Lundqvist, B. I. Phys. Rev. Lett. 1996, 76, 102–105.
(37) Gulans, A.; Puska, M. J.; Nieminen, R. M. Phys. Rev. B 2009, 79, 201105– 201108.
(38) Vydrov, O. A.; Van Voorhis, T. J. Chem. Phys. 2009, 130, 104105–104111. (39) Klimeš, J.; Bowler, D. R.; Michaelides, A. Phys. Rev. B 2011, 83, 195131–
195143.
(40) Cooper, V. R. Phys. Rev. B 2010, 81, 161104–161107.
(41) Klimeš, J.; Bowler, D. R.; Michaelides, A. J. Phys.: Condens. Matter 2010,
22, 022201–022201-5.
(42) Spanu, L.; Sorella, S.; Galli, G. Phys. Rev. Lett. 2009, 103, 196401–196404. (43) Bader, R. F. W. Atoms in Molecules - A Quantum Theory; Oxford University
Press: UK, 1990.
(44) Henkelman, G.; Arnaldsson, A.; Jónsson, H. Comput. Mater. Sci. 2006, 36, 354–360.
(45) Sanville, E.; Kenny, S. D.; Smith, R.; Henkelman, G. J. Comput. Chem. 2007,
28, 899–908.
(46) Tang, W.; Sanville, E.; Henkelman, G. J. Phys.: Condens. Matter 2009, 21, 084204–084204-7.
(47) Mori-Sánchez, P.; Cohen, A. J.; Yang, W. Phys. Rev. Lett. 2008, 100, 146401–146404.
(48) Harris, J. Phys. Rev. B 1985, 31, 1770–1779.
(49) Pinto, H.; Jones, R.; Goss, J. P.; Briddon, P. R. J. Phys.: Condens. Matter
2009, 21, 402001–402001-3.
(50) Gopalakrishnan, K.; Moses, K.; Dubey, P.; Rao, C. N. R. J. Mol. Struct 2012,
1023, 2–6.
(51) Braun, S.; Salaneck, W. R.; Fahlman, M. Adv. Mater. 2009, 21, 1450–1472. (52) NEWNS, D. M. Phys. Rev. 1969, 178, 1123–1135.
(53) Nistor, R. A.; Newns, D. M.; Martyna, G. J. ACS Nano 2011, 5, 3096–3103. (54) Fahlman, M.; Crispin, A.; Crispin, X.; Henze, S. K. M.; Jong, M. P. de;
Osikowicz, W.; Tengstedt, C.; Salaneck, W. R. Journal of Physics: Condensed
Matter 2007, 19, 183202–183202–20.
(55) Tengstedt, C.; Osikowicz, W.; Salaneck, W. R.; Parker, I. D.; Hsu, C.-H.; Fahlman, M. Appl. Phys. Lett. 2006, 88, 053502–053504.
(56) Jones, R. O.; Gunnarsson, O. Rev. Mod. Phys. 1989, 61, 689–746.
(57) Leung, T. C.; Kao, C. L.; Su, W. S.; Feng, Y. J.; Chan, C. T. Phys. Rev. B
2003, 68, 195408–195413.
(58) Yan, R.; Zhang, Q.; Li, W.; Calizo, I.; Shen, T.; Richter, C. A.; Hight-Walker, A. R.; Liang, X.; Seabaugh, A.; Jena, D.; Grace Xing, H.; Gundlach, D. J.; Nguyen, N. V. Appl. Phys. Lett. 2012, 101, 022105–022105–4.
(59) Lichtenberger, D. L.; Johnston, R. L.; Hinkelmann, K.; Suzuki, T.; Wudl, F.
(60) Zhao, J.; Pontius, N.; Winkelmann, A.; Sametoglu, V.; Kubo, A.; Borisov, A. G.; Sánchez-Portal, D.; Silkin, V. M.; Chulkov, E. V.; Echenique, P. M.; Petek, H. Phys. Rev. B 2008, 78, 085419–085425.
(61) Bae, G.; Jung, H.; Park, N.; Park, J.; Hong, S.; Park, W. Appl. Phys. Lett.
2012, 100, 183102–183105.
(62) Coletti, C.; Riedl, C.; Lee, D. S.; Krauss, B.; Patthey, L.; von Klitzing, K.; Smet, J. H.; Starke, U. Phys. Rev. B 2010, 81, 235401–235408.
(63) Mak, K. F.; Sfeir, M. Y.; Misewich, J. A.; Heinz, T. F. Proceedings of the
National Academy of Sciences 2010, 107, 14999–15004.
(64) Nanda, B. R. K.; Satpathy, S. Phys. Rev. B 2009, 80, 165430–165436. (65) Kolmogorov, A. N.; Crespi, V. H. Phys. Rev. B 2005, 71, 235415–235420. (66) Okada, S.; Kobayashi, T. Jpn. J. Appl. Phys. 2009, 48, 050207.
Table of content graphical abstract: