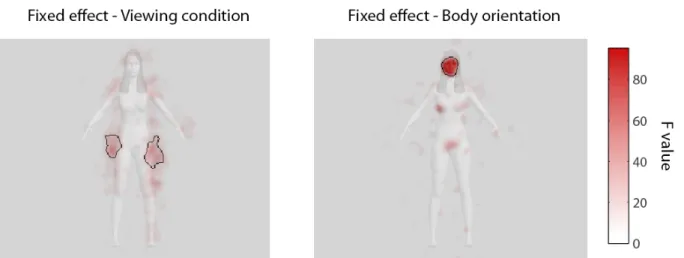
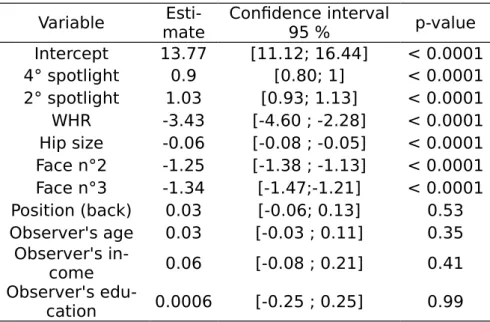
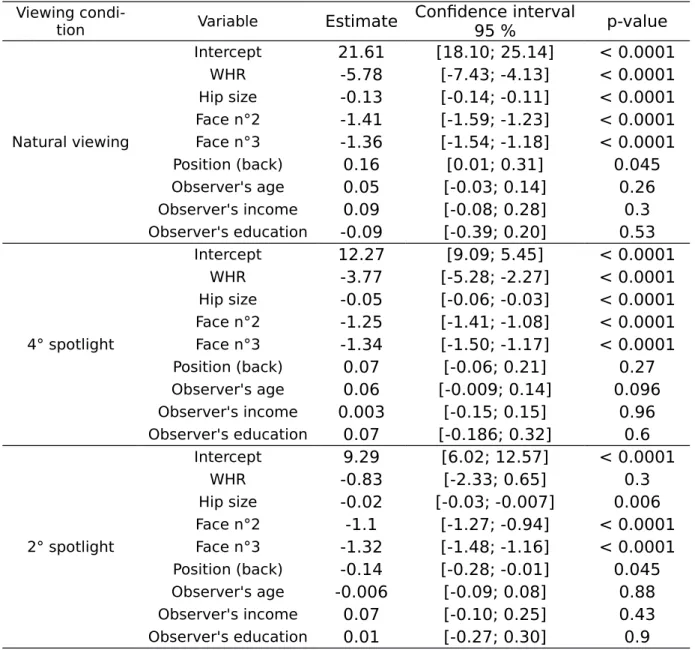
Mapping female bodily features of attractiveness
Texte intégral
Figure
Documents relatifs
Therefore one could use the term entanglement to refer to an urban reality where the physical place (a specific point in space) is able to host many different emotional places,
at the level of the agentive experience (I am raising my arm) and at the level of the body part that is moving (my arm is raising). The first expresses the sense of
By contrast, patients with Frégoli delusion have an anomalously heightened affective responsiveness for unknown individuals, and thus believe that they are surrounded
In a nutshell, (i) only signals assigned to a common source are integrated together, (ii) the assignment to a common source results from a subpersonal comparative
Each analysis (with default scale fixed ef- fects, default scale random effects) included three models: (a) a model including an effect of mechanical ventilation mode
We focus on experimental paradigms that have created multisensory conflicts (often involving visual and tactile signals) to modulate the body schema (e.g., evoking a virtual Alice
The specific way in which women tend to experience the world has led to a certain style of moving and speaking, which I will call throughout the following “feminine style.” Although
Per-hallucinatory functional magnetic resonance imaging (fMRI) findings were obtained from two published case reports of bodily hallucinations (BH) relative to the
