HAL Id: hal-01182315
https://hal.archives-ouvertes.fr/hal-01182315
Submitted on 3 Aug 2015
HAL is a multi-disciplinary open access archive for the deposit and dissemination of sci-entific research documents, whether they are pub-lished or not. The documents may come from teaching and research institutions in France or abroad, or from public or private research centers.
L’archive ouverte pluridisciplinaire HAL, est destinée au dépôt et à la diffusion de documents scientifiques de niveau recherche, publiés ou non, émanant des établissements d’enseignement et de recherche français ou étrangers, des laboratoires publics ou privés.
accelerators
E Siminos, Stefan Skupin, A Sävert, Jason Cole, S.P.D Mangles, M. Kaluza
To cite this version:
E Siminos, Stefan Skupin, A Sävert, Jason Cole, S.P.D Mangles, et al.. Modeling few-cycle shad-owgraphy of laser-wakefield accelerators. Europhys. Conf. Abstr., Jun 2015, Lisbon, Portugal. �hal-01182315�
Modeling few-cycle shadowgraphy of laser-wakefield accelerators
E. Siminos1, S. Skupin2, A. Sävert3, J. M. Cole4, S. P. D. Mangles4, M. C. Kaluza3,5 1Max Planck Institute for the Physics of Complex Systems, 01187 Dresden, Germany
2Univ. Bordeaux - CNRS- CEA, CELIA, UMR 5107, 33405 Talence, France 3Institut für Optik und Quantenelektronik, Abbe-Center of Photonics,
Friedrich-Schiller-Universität, 07743 Jena, Germany
4The John Adams Institute for Accelerator Science, The Blackett Laboratory, Imperial College London, London SW7 2AZ, United Kingdom
5Helmholtz-Institut Jena, Friedrich-Schiller-Universität, 07743 Jena, Germany
Abstract
Ultrafast shadowgraphy utilizes few cycle probe pulses in order to image density gra-dients in a plasma allowing to probe structures, such as laser-driven wakes, moving close to the speed of light. Here we study the process of shadowgraphic image formation in the interaction of a few cycle probe pulse with a laser-driven wake using particle-in-cell (PIC) simulations. The output of the PIC code is then post-processed by means of Fourier optics in order to take into account the effect of a typical imaging setup. This allows to construct synthetic shadowgrams which can be compared with experimentally recorded ones. This facilitates the correct interpretation of such involved measurements.
The interaction of intense laser pulses with plasmas can lead to the excitation of nonlinear structures in the plasma, such as wakes, solitons, shocks and filaments. The time evolution of such structures is highly non-trivial and a lot of effort has been invested in developing theoretical tools and experimental diagnostics to investigate it. In a typical Laser-wakefield accelerator (LWFA) setup a relativistically intense laser pulse (the ‘pump’ pulse) excites an electron plasma wave (the ‘wake’) which propagates with a phase velocity vp equal to the pump pulse group velocity vg≃ c through the plasma. Ambient electrons can be trapped and accelerated in the field of the wake, producing quasi-monoenergetic electron beams [1]. Stable operation of such accelerators requires a thorough understanding of nonlinear laser-plasma interaction processes motivating the development of novel diagnostics. The characteristic length scale of the wake is the plasma wavelength λp. Therefore, optical probing of such a wake with a transversely propagating probe pulse requires a probe pulse duration: cτpr≪λp. Typically this corresponds to a duration of few laser cycles τL = 2π/ωL, where ωL the frequency of the probe pulse. Recently, pump-probe experiments utilized probe pulses of few femtosecond duration to obtain the first direct shadowgraphic images of a wake propagating in an underdense plasma [2,3].
Conventional shadowgraphy can be analyzed using geometrical optics and formulated as an inverse problem: for a given shadowgraphic image local gradients in index of refraction can be determined, see, e.g., Ref. [4]. In ultrafast shadowgraphy of laser induced wakes this is not in general straightforward. The effect of longitudinal motion of the wake as the probe pulse tra-verses, the presence of strong magnetic fields as well as relativistic effects are not negligible and need to be taken into account. At the same time diffraction effects can be significant when the probe pulse wavelengthλpris comparable to the plasma skin depthλswhich is the characteristic length scale of density gradients in the plasma. For parameters used in recent experiments [3] this is often the case and the effect of diffraction has to be accounted for.
In a previous publication [3] synthetic shadowgrams generated using this methodology turned out to be crucial for the correct interpretation of experimental measurements.
y
pumpz
k
pumpE
probek
E
probex
Figure 1:PIC simulation setup: The pump prop-agates along the x direction and is polarized along y, while the probe propagates along the (negative) ydirection and is polarized along x.
In this paper the shadowgraphic image forma-tion process is analyzed through the use of three-dimensional particle-in-cell (PIC) simulations of the full pump-probe setup. Propagation of the pump pulse through the plasma is simulated and at differ-ent delays a probe pulse propagating transversely to the pump is launched. After the probe traverses the wake, post-processing in Fourier space allows to take into account the effect of a typical imaging setup in shadowgraphic image formation.
We performed simulations of LWFA with the PIC code EPOCH with parameters similar to the
ones used the experiments of Ref. [3]. A pump laser pulse propagating along the x direc-tion, linearly polarized along the y direcdirec-tion, with an intensity FWHM duration of 36 fs and central wavelength λL = 810 nm was focused to a spot size of 18.84µm (intensity FWHM) at xf = 300µm into a plasma of initial electron density n0 = 1.7 × 1019cm−3. The pump pulse maximum intensity (in vacuum) was I0 = 2.5 × 10¹⁸W/cm2. The com-putational domain was a ’sliding window’ of size 150µm× 70µm× 70µm moving at c. Probe propagation has been also fully simulated in 3D with EPOCH. For the probe simu-lations the moving window was stopped and a probe pulse was injected from the side of the box, propagating along the negative y direction, i.e. perpendicularly to the pump prop-agation direction, see Fig. 1. Although we varied the parameters of the probe pulse, in most runs the pulse parameters were similar to the ones in recent experiments [3]: central
wavelength λpr = 0.75µm, bandwidth limited duration of τBL = 4.4 fs (intensity FWHM) and a negative linear chirp that increased duration toτpr= 12 fs and maximum intensity Ipr= 8.6 × 10¹⁴W/cm2.
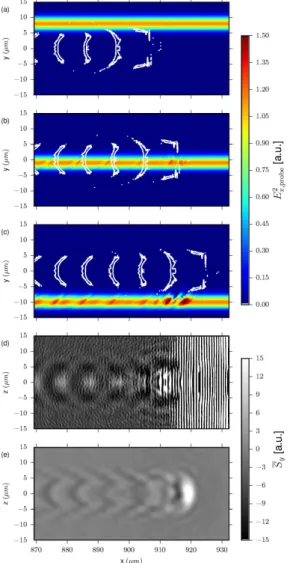
Figure 2:Probe pulse propagation past the wake. Panels (a)-(c): Three snapshots from the PIC sim-ulation showing the probe electric field amplitude Exprobe and contours of the plasma density cor-responding to n = 2 n0. (d) Image obtained by recording the time-integrated Poynting flux hSyi passing trough the plane y = −20µm (e) Time-integrated Poynting flux hSyi after adjusting for focusing optics, assuming the object plane is at yo= 0.
We allowed the probe pulse to propagate past the wake structure, until its center reached approx-imately yB = −20µm. In Fig. 2(a-c) we track the evolution of the envelope of the probe electric field as it crosses the wake. Figure2(b-c) indicates that modulations in the intensity of the probe pulse oc-cur as the latter interacts with density gradients in the wake.
Once the probe pulse reaches yB there are no substantial density perturbations in the plasma and therefore any local phase differences induced by the wake have been imprinted to the probe pulse. However, if we simply try to reconstruct a shad-owgram by recording the time-integrated intensity passing through the plane yB, as shown Fig. 2(d), there are two problems with the image we obtain. In the front of the wake there is strong scattering of pump light which is of much higher intensity than the probe intensity. This scattered light is not present in the experimental shadowgrams [2, 3]. As we will see the reason for this is that the aper-ture of the imaging system eliminates most of the side-scattered light. Moreover, the wake structure appears blurred in Fig. 2(d). The reason for this is strong diffraction, since the length scale for density gradients (the plasma skin depth,λs= 1.3µm here) is comparable to the wavelength of the probe pulse (λpr = 0.75µm). Thus, in order to be able to com-pare PIC simulation results to experimental shad-owgrams, we have to take into account the influ-ence of a typical imaging system in shadowgram
formation.
In order to reconstruct shadowgrams from our PIC simulation results, we will use two major simplifications. Firstly, the transverse size of the simulation box in our PIC simulations is lim-ited to a few tens of microns, and it is not possible to directly account for the optical imaging. However, once the probe pulse has propagated through the plasma wake, all information related to the laser-plasma interaction process are already imprinted in its wavefronts. Thus, we will assume that the probe pulse propagates further on in vacuum. Secondly, the probe pulse, after it has passed the plasma wake, propagates mainly in one direction, and the imaging system has a certain numerical aperture (NA), i.e., acceptance angle. Here, we assume that the NA of our imaging system is small enough to justify a paraxial description of the imaging process. The imaging system was modeled in Fourier space, allowing to take into account its aperture and image plane position. To adjust for the latter, we propagated the probe pulse backwards and recorded the time-averaged Poynting flux through the object plane, which in the images pre-sented here was taken to be at y = 0. This resulted in the simulated shadowgram of Fig.2(e), which resembles the experimental shadowgrams [3].
The methodology developed here thus allows direct comparison with experimental shadow-grams and facilitates their interpretation. In particular, our ability to track probe propagation indicates that the strongest modulations in the shadowgrams originate from the front of the ’bubble’ (the first period of the wakefield), see Fig. 2, and this allowed the determination of bubble length in recent experiments [3]. Shadowgrams obtained at different delays allow to track the evolution of the size of the bubble as it propagates through the plasma. It is shown that, as suggested by recent models [5], the process of expansion of the bubble induced by self-focusing and self-compression of the pump laser pulse leads to self-injection of electrons into the bubble and their subsequent acceleration.
Acknowledgments:EPOCH was developed under UK EPSRC grants EP/G054940/1, EP/G055165/1 and EP/G056803/1.
References
[1] E. Esarey, et al. Rev. Mod. Phys. 81, 1229, 2009.
[2] M. B. Schwab, et al. Applied Physics Letters 103, 191118, 2013.
[3] A. Sävert, et al. Direct observation of the injection dynamics of a laser wakefield accelerator using few-femtosecond shadowgraphy, 2015. Submitted.
[4] P. K. Panigrahi and K. Muralidhar. Schlieren and Shadowgraph Methods in Heat and Mass Transfer. Springer-Briefs in Applied Sciences and Technology. Springer New York, 2012.