HAL Id: hal-02418153
https://hal.archives-ouvertes.fr/hal-02418153
Submitted on 18 Dec 2019
HAL is a multi-disciplinary open access
archive for the deposit and dissemination of
sci-entific research documents, whether they are
pub-lished or not. The documents may come from
teaching and research institutions in France or
abroad, or from public or private research centers.
L’archive ouverte pluridisciplinaire HAL, est
destinée au dépôt et à la diffusion de documents
scientifiques de niveau recherche, publiés ou non,
émanant des établissements d’enseignement et de
recherche français ou étrangers, des laboratoires
publics ou privés.
Study of the linearity of CABRI experimental ionization
chambers during RIA transients
J. Lecerf, Y. Garnier, Jp. Hudelot, B. Duc, L. Pantera
To cite this version:
J. Lecerf, Y. Garnier, Jp. Hudelot, B. Duc, L. Pantera. Study of the linearity of CABRI experimental
ionization chambers during RIA transients. International conference on advancements in nuclear
in-strumentation measurement methods and their applications, Jun 2017, Liege, Belgium. �hal-02418153�
Study of the linearity of CABRI experimental
ionization chambers during RIA transients
J. Lecerf, Y. Garnier, JP. Hudelot, B. Duc, L. Pantera
johann.lecerf@cea.fr
CEA, DEN, CAD/DER/SRES/LPRE, Cadarache, F-13108 Saint-Paul-lez-Durance, France
Abstract– CABRI is an experimental pulse reactor operated
by CEA at the Cadarache research center and funded by the French Nuclear Safety and Radioprotection Institute (IRSN).
For the purpose of the CABRI International Program (CIP), operated and managed by IRSN under an OECD/NEA framework it has been refurbished since 2003 to be able to provide experiments in prototypical PWR conditions (155 bar, 300 °C) in order to study the fuel behavior under Reactivity Initiated Accident (RIA) conditions.
This paper first reminds the objectives of the power commissioning tests performed on the CABRI facility. The design and location of the neutron detectors monitoring the core power are also presented.
Then it focuses on the different methodologies used to calibrate the detectors and check the consistency and co-linearity of the measurements.
Finally, it presents the methods used to check the linearity of the neutron detectors up to the high power levels (~20 GW) reached during power transients. Some results obtained during the power tests campaign are also presented.
I. INTRODUCTION
CABRI is an experimental pulse reactor operated by CEA and funded by the French Nuclear Safety and Radioprotection Institute (IRSN) at the Cadarache research center. Since 1978 the experimental programs have aimed at studying the fuel behavior under Reactivity Initiated Accident (RIA) conditions. Since 2003, it has been refurbished in order to be able to provide RIA and LOCA (Loss Of Coolant Accident) experiments in prototypical PWR conditions (155 bar, 300 °C). This project is part of a broader scope including an overall facility refurbishment and a safety review. The global modification has been conducted by the CEA project team and funded by IRSN, which is operating and managing the CIP experimental program (CABRI International Program), in the framework of an OECD/NEA agreement.
During the reactor restart, commissioning tests were performed for all equipment, systems and circuits of the reactor. In particular power commissioning tests have been carried out in 2016 and 2017.
This paper focuses on the analyses of the linearity of CABRI experimental ex-core compensated ionization chambers used to measure online the power of the CABRI driver core during RIA power transients.
In the first part, the method used and the tests realized to calibrate the neutron detectors at low power will be explained.
The second part will concentrate on the method used to demonstrate the linearity of the detectors under transient conditions.
Each one of the above experimental goals will be described, as well as the target uncertainties regarding the power measurement.
II. CABRI REACTOR AND COMMISSIONING TESTS
A. Description of the CABRI reactor
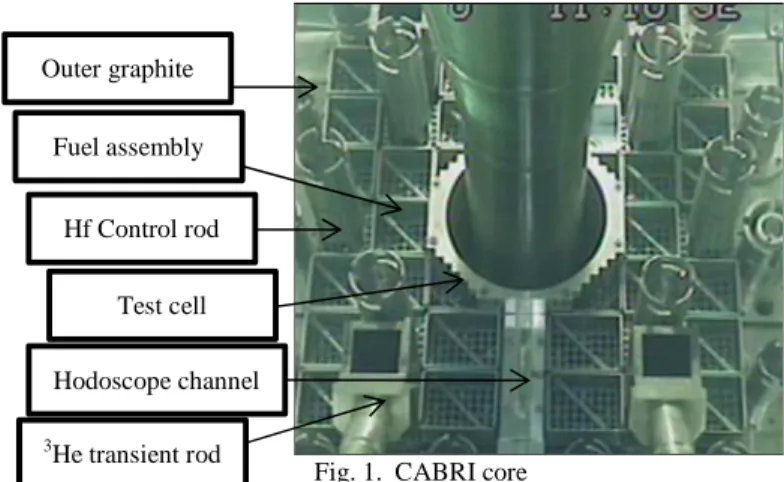
CABRI is a pool-type reactor, with a core made of 1487 UO2 fuel rods with a 6 % 235U enrichment with stainless steel
clads. The reactor is able to reach a 25 MW steady state power level. The reactivity is controlled via a system of 6 control and safety rods made-up of 23 hafnium pins for each one (see Fig. 1). The core is cooled by a forced water flow of 3215 m3.h-1 when the core power is higher than 100 kW and by natural convection with the pool water otherwise [1].
Fig. 1. CABRI core Outer graphite Hf Control rod Hodoscope channel 3 He transient rod Fuel assembly Test cell
The key feature of the CABRI reactor is its reactivity injection system [2]. This device allows the very fast depressurization of the 3He (strong neutron absorber) previously introduced inside 96 tubes (so called “transient rods”) located among the CABRI fuel rods. The rapid absorber depressurization translates into an equivalent reactivity injection possibly reaching 3.9 $ within a few 10 ms. The power consequently bursts from 100 kW up to ~20 GW (see Fig. 2) in a few ms and decreases just as fast due mainly to the Doppler effect. The total energy deposit in the tested rod is adjusted by dropping the control and safety rods after the power transient.
Fig. 2. Typical CABRI 3He Pressure and core power shapes during
a RIA transient
B. Focus on the power commissioning tests
The neutronics commission tests aimed at precisely characterizing the neutronics parameters of the CABRI core [3]: reactivity effects, power distributions and kinetic parameters.
After carrying out those tests at low power (< 100 kW), the CABRI facility was ready for power commissioning tests. The main objectives of these tests were:
• to assess the thermal leakage coefficient associated with the water mixing in the upper water box area during the reactor forced cooling phase (see Fig. 3: the 6 control and safety rods and the experimental pressurized water loop are not represented in the figure),
• to calibrate the neutron detectors thanks to thermal balance measurements performed on water of the primary cooling system passing through the core. These thermal balance measurements are carried out up to the maximal steady state CABRI driver core power level (~25 MW),
• to verify the co-linearity of the experimental neutron detectors during the power increase as well as various steady state power levels,
• to study the consistency of the different experimental neutron detectors measurements and the linearity of each
detector during power transients up to power levels of about 20 GW.
III. DESIGN AND LOCATION OF NEUTRON DETECTORS
During steady states and transients conditions, the core power is measured by the mean of specific ex-core boron ionization chambers.
Experimentally, five detectors are used to monitor the core power during transients, four of them were manufactured by Reuter Stokes and the last one by Merlin Gerin (see Table I). They are operated in the current mode.
Fig. 3. Mixing zone in the upper water box area
The neutron detectors are positioned outside the core, behind a lead shield designed to reduce the gamma flux (see Fig. 4).
Thanks to increasing distances between the driver core and the detectors, the experimental signals overlap on different ranges of operation of the chambers and electronic chains which allows to measure the whole power range in the case of power transients (i.e. from few kW up to ~20 GW) (see Table I and Fig. 4).
In the Figure 4, HN1 and HN2 are the neutron detectors used to control the reactor in normal operating conditions (except for transients). They are used in the safety chain of the reactor. The response time of their electronic chain and acquisition system is too long to be able to monitor correctly a power transient.
G2.1 and G2.2, which are the detectors closest to the core, are mainly used to measure power during steady state conditions (before transients). They also follow the beginning
Upper
Water Box
of the transients before the overlap of the experimental detectors signals is ensured by the G3 detectors.
Note that preliminary tests on the neutron detectors were performed at low power levels in order to check their operability, to determine their high-voltage, discrimination curves and their neutron sensitivity.
Fig. 4. Positions of the neutron detectors
TABLE I.CABRI EXPERIMENTAL BORON IONIZATION CHAMBERS
G2.1 G2.2 G3.1.1 G3.1.2 G3.4 Supplier Reuter Stokes Merlin Gerin Reuter Stokes Reuter Stokes Reuter Stokes Min Power ~10 kW ~10 MW ~100 MW
Saturation ~450 MW > Max transient power of CABRI
IV. CALIBRATION OF THE NEUTRON DETECTORS
The power commissioning tests aimed at calibrating the neutron detectors thanks to thermal balance measurements performed on the primary cooling system.
This calibration realized in steady state conditions (up to 25 MW) is very important since the core power during the transients is only assessed online by the neutron detectors.
The objective of the thermal balance measurements is to define the neutron detector sensitivity coefficient c which connects the power PND (W) to the detector signal S (V) according to the following equations [4] (see Fig. 3):
P
ND=
c S
.
(1) ND TB P =P (2)(
)
. . . TB p RC HL CL TL P =ρ
C Q T −T +P (3)(
)
. TL HL PW P =K T −T (4) With NDP core power measured by the Neutron Detector (W) c neutron detector sensitivity coefficient (W/V) S detector Signal (V)
TB
P
core power measured by Thermal Balance (W)ρ
water density (kg/m3)p
C water isobar specific heat (J/kg.°C-1) RC
Q Reactor Coolant flow rate (m3/s) HL
T Hot Leg water temperature (°C) CL
T
Cold Leg water temperature (°C) TLP
Thermal power Leak through the upper box (W)K
thermal leakage coefficient (W/°C) (see § IV. A) PWT Pool Water temperature (°C)
A. Experimental evaluation of the thermal leakage coefficient
The thermal leakage coefficient has been measured during primary cooling system operations with significant temperature differences between the reactor pool and the outside tanks (see Fig. 5). This measurement does not require power operating phases of the reactor, i.e. at zero power.
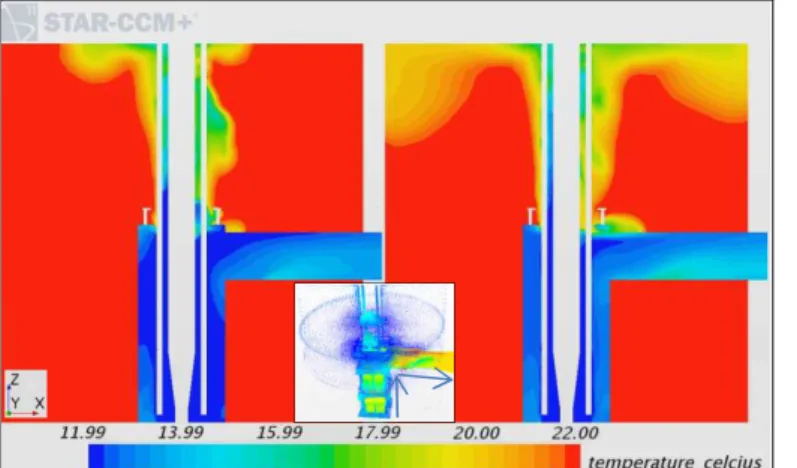
Fig. 5. View of the primary cooling system of CABRI (blue) The mixing zone in the upper part of the water box (above the core, downstream since the cooling water circulates down to top) is illustrated on the figures 6 and 7. In this case, the temperature of the pool water was higher than the temperature of water inside the primary cooling system. The first figure was obtained from images taken with a thermal camera at the beginning of the homogenization phase (cold water in blue). The second one comes from 3D CFD calculations performed with the STAR-CCM+ code [5].
Fig. 6. Thermal camera pictures of the mixing zone in the upper part of the water box
Fig. 7. STAR-CCM+ calculation of the mixing zone in the upper part of the water box
In order to assess the thermal leakage coefficient K, mobile thermocouples have been used to monitor the temperature near the mixing zone.
Measurements were made during three homogenization phases of the primary cooling system when there were significant water temperature differences between the pool and
the tanks. The value obtained is about 0.3 MW/°C with an estimated uncertainty of 20 % (2σ). This high level of uncertainty does not significantly affect the global uncertainty of the thermal balance measurements of power because the thermal power leakage represents only approximately 8 % of the total power obtained by thermal balance.
B. Calibration of the neutron detectors by thermal balances and check for the consistency and co-linearity of the measurements
During the power commissioning tests, thermal balances with increasing power levels (8, 10, 12, 15, 19 and up to 23 MW) were used to calibrate the neutron detectors. The neutron detector sensitivity coefficients were readjusted whenever the power delivered by the detectors deviated from the core power measured by thermal balance.
Some tests have also been carried out with varying the initial temperature of the primary cooling system to know the neutron detectors sensitivity dependence on this parameter.
This sensitivity variation is equal to -0.30 %/°C for all neutron detectors.
The consistency and co-linearity of the neutron detectors power measurements was checked during the different power increases and steady states of power.
The figure 8 presents the results obtained during the different phases of the power increase to reach a 23 MW final steady state of power (comparisons of HN and G2 detectors). For power higher than a few kW, the signals are perfectly consistent.
Fig. 8. Evolution of the neutron detectors signals during a 23 MW steady state power level
The three G3 neutron detectors signals are not represented on this figure because there are not representative for such low power level (see Table I). For these detectors, the sensitivity coefficients, obtained thanks to thermal balances at powers below 25 MW, are not precise and will be refined by power comparisons with G2 detectors (up to 450 MW) during power transients (see § V). 1,0E-08 1,0E-07 1,0E-06 1,0E-05 1,0E-04 1,0E-03 1,0E-02 1,0E-01 1,0E+00 1,0E+01 1,0E+02 600 900 1200 1500 1800 2100 2400 2700 3000 P o w e r (M W ) Time (s)
Neutron detectors Power during the various phases to reach the 23 MW steady state G21f(T) G22f(T) HN1f(T) HN2f(T) Tanks Reactor Pool
V. LINEARITY OF THE NEUTRON DETECTORS DURING POWER TRANSIENTS
The last objective of the power commissioning tests concerning the neutron detectors was to check their linearity during the power transients.
RIA power transients have been realized increasingly in energy, that means starting from low 3He pressure and low valve aperture of the transient circuit [2].
The coherence and co-linearity of the neutron detectors power measurements was checked during the different power transients.
The G3 detector sensitivity coefficients have been refined from the power comparisons with G2 detectors during transients up to their saturation (~ 450 MW) as shown on Fig. 9.
Fig. 9. CABRI transient of power example
The linearity of the neutron detectors and their capability to measure precisely the energy deposit during power transients have been checked using transient calorimetric balances.
The energy deposit in the core during the transient is evaluated by determining the energy carried away by the primary cooling system (integration of the instantaneous power) until the core power drops below the initial power before transient (see Fig. 10).
This energy is then compared to the energy integrated from the power of the neutron detectors during power transients.
This comparison is carried out for several power transients with various total energies and maximum power peaks.
The figure 11 and the table II show an example of results for the G3.4 neutron detector and conclude to its good linearity for different energy and power ranges, covering the whole range of the CABRI capabilities.
Fig. 10. Evolution of primary cooling system temperature during power transient
TABLE II.G3.4INTEGRATED POWER (G3.4) AND CALORIMETRIC BALANCES RESULTS ON THE CORE ENERGY COMPARISONS
Maximal power peak (GW) E_CTB* (MJ) E_G3.4** (MJ) E_G3.4 / E_PCS 3.5 77.4 80.0 0.968 8.1 128.7 130.1 0.990 12.8 170.4 170.0 1.002 16.8 201.9 202.8 0.996 5.9 208.1 209.6 0.993 0.6 55.4 58.1 0.952 19.1 233.5 232.9 1.003 21.3 245.5 244.6 1.004
* Calorimetric Thermal Balance energy on primary cooling system
** G3.4 energy (integration of the neutron detector power)
Fig. 11. G3.4 and calorimetric thermal balances results on the core energy comparisons
Given the results obtained during the power commissioning tests, an envelope uncertainty of 8 % (2σ) can be applied to the energy deposited in the core, measured from the experimental neutron detectors.
VI. CONCLUSION
This paper presents the results of the power tests campaign performed during the commissioning tests of the CABRI reactor.
The methods used to qualify the core power measurements (either steady state or power transients) were explained and some results of the power commissioning tests were presented. The neutron detectors have been calibrated thanks to thermal balances performed on the primary cooling system for steady states of power up to 23 MW.
The consistency and co-linearity of the neutron detectors power measurements were checked.
Finally an important point was devoted to the study of the linearity of the detectors on typical RIA power transients considered in the CIP program.
REFERENCES
[1] JP. Hudelot, Y. Garnier, J. Lecerf, M. Fournier, S. Magnetto, E. Gohier, “CABRI reactor commissioning: results and analysis of the tests on the primary cooling system and on the control and safety rods,” IGORR2014 conference, 17-21 November 2014, Bariloche, Argentina [2] B. Duc, B. Biard, P. Debias, L. Pantera, JP. Hudelot, F. Rodiac,
“Renovation, improvement and experimental validation of the Helium-3 transient rods system for the reactivity injection in the CABRI reactor”, IGORR2014 conference, 17-21 November 2014, Bariloche, Argentina [3] G. Ritter, O. Guéton, F. Mellier, and D. Beretz, “Neutron
Commissioning in the New CABRI Water Loop Facility,” IEEE Transactions on Nuclear Science, Vol. 57, n°5, October 2010
[4] F. Jeury, L. Pantera, Y. Garnier, “CABRI experimental reactor: experimental reassessment of CABRI core power and measurement uncertainties”, IGORR2013 conference, 13-18 October 2013, Daejeon, Korea