HAL Id: hal-01554773
https://hal.archives-ouvertes.fr/hal-01554773
Submitted on 9 May 2018
HAL is a multi-disciplinary open access
archive for the deposit and dissemination of
sci-entific research documents, whether they are
pub-lished or not. The documents may come from
teaching and research institutions in France or
abroad, or from public or private research centers.
L’archive ouverte pluridisciplinaire HAL, est
destinée au dépôt et à la diffusion de documents
scientifiques de niveau recherche, publiés ou non,
émanant des établissements d’enseignement et de
recherche français ou étrangers, des laboratoires
publics ou privés.
Metallicity-dependent kinematics and morphology of the
Milky Way bulge
E. Athanassoula, S.A. Rodionov, N. Prantzos
To cite this version:
E. Athanassoula, S.A. Rodionov, N. Prantzos. Metallicity-dependent kinematics and morphology of
the Milky Way bulge. Mon.Not.Roy.Astron.Soc., 2017, 467 (1), pp.L46-L50. �10.1093/mnrasl/slw255�.
�hal-01554773�
Metallicity-dependendent kinematics and morphology of the Milky
Way bulge
E. Athanassoula
?1, S. A. Rodionov
1, N. Prantzos
21 Aix Marseille Univ, CNRS, LAM, Laboratoire d’Astrophysique de Marseille, Marseille, France
2 Institut d’Astrophysique de Paris (IAP), UMR7095 CNRS, Univ. Pierre & Marie Curie, 98bis Bd. Arago, 75014 Paris, France
Accepted . Received
-ABSTRACT
We use N-body chemo-dynamic simulations to study the coupling between morphology, kine-matics and metallicity of the bar/bulge region of our Galaxy. We make qualitative comparisons of our results with available observations and find very good agreement. We conclude that this region is complex, since it comprises several stellar components with different properties – i.e. a boxy/peanut bulge, thin and thick disc components, and, to lesser extents, a disky pseudob-ulge, a stellar halo and a small classical bulge – all cohabiting in dynamical equilibrium. Our models show strong links between kinematics and metallicity, or morphology and metallicity, as already suggested by a number of recent observations. We discuss and explain these links. Key words: Galaxy: bulge – Galaxy: stellar content – Galaxy: structure – Galaxy: kinematics and dynamics – Galaxy: evolution
1 INTRODUCTION
Observations have recently revealed an interesting coupling between kinematics and metallicity of stars in the Milky Way (MW) bar/bulge region. Babusiaux (2016) (her Fig. 4, see also Babusiaux 2010), reviewing the link between metallicity and kine-matics, collected data from a number of sources and plotted the velocity dispersion (σ) versus the absolute value of the latitude (b). She found that for low metallicity stars, σ shows very little, if any, trend with |b|, while for high metallicity stars σ clearly decreases with increasing |b|.
Ness et al. 2013b (hereafter N13b; see the lower panels of their figure 6) binned the ARGOS data by metallicity, and plotted the velocity dispersion as a function of longitude l. This revealed that the higher metallicity stars (0<[Fe/H]) have two clear trends:
First, stars at l=0◦have high velocity dispersions which decrease
with increasing |l|, and, second, stars at low latitude (|b|=5◦) have
a larger velocity dispersion than stars at high latitude (|b|=10◦).
They also showed that the lower metallicity stars (-1.0<[Fe/H]<-0.5) have higher velocity dispersions than the higher metallicity stars and also that the velocity dispersion depends only little on longitude or latitude.
Just after this letter was first submitted, Zasowski et al. (2016, hereafter Z16) presented APOGEE data for the MW bulge. Given the relevance of these data to our results we added a posteriori a short discussion of them.
We present here a theoretical study of this interesting
chemo-? E-mail: [email protected]
kinematic coupling. Previous simulation studies of metallicity in the bar/bulge region (Bekki & Tsujimoto 2011; Martinez-Valpuesta & Gerhard 2013; di Matteo 2015) used pure N-body simulations and thus included neither gas nor star formation. Nevertheless, by assuming an initial metallicity radial distribution, they were able to study its redistribution due to bar formation and evolution. Here, we avoid such a short-cut, and use a coupled chemical-kinematical-morphological approach, based on an N-body simulation obtained with a code including both gas and star formation, coupled to a chemical evolution code which follows the distribution of the chemical elements as a function of time and location in the galaxy. The results of this letter were presented in two meetings on our
Galaxy, one in Paris (19 - 23/09/2016)1and the other in Canberra
(21 - 25/11/2016)2.
2 SIMULATIONS
2.1 General context
Our disc galaxy formation model has been described in detail by Athanassoula et al. (2016, hereafter A16). We will present it here only very briefly. We assume that the galaxy we model underwent a major merger about 8 – 10 Gyr ago and start our simulations with two spherical protogalaxies composed solely of dark matter
1 http://www.iap.fr/vie scientifique/ateliers/MilkyWay Workshop/2016/ and then click on program
2 https://www.aao.gov.au/files/conferences/Lia GASP16 0.pdf
2
E. Athanassoula, S. Rodionov, N. Prantzos
and gas, while stars form all through the simulation. These two protogalaxies are set on an orbit bringing them to a collision. The stars born before the merging undergo violent relaxation and form a spheroidal, centrally concentrated object. The stars born during the merging are strongly shuffled by the quickly varying potential and form mainly a thick disc or an extended stellar halo. Up to this point the evolution is merger driven. After the merger settles down the evolution becomes secular, and the thin disc starts forming from the gas accreted from the gaseous halo. Some of it may thicken and contribute to the thick disc, but, as gas accretion continues all through the simulation, a thin disc of relatively younger stars is always present.
2.2 Code
The code describing the dynamical evolution is based on GAD
-GET3 (a Tree SPH code, Springel & Hernquist 2002, 2003) and
is described in A16 and in Rodionov et al. (subm.). The mass of
the baryonic particles is 104M , and that of the dark matter ones
4 × 10⁴M
, with 10 and 17.5 million particles in each of these
components, respectively. The softening is 25 pc.
For the chemical part we adopt the Single Stellar Population (SSP) formalism, where a single simulation particle represents a population of stars of the same age. Within that “stellar particle”, stars are distributed according to the IMF of Kroupa (2002). They release their ejecta after a finite, mass dependent, lifetime. Yields for 12 selected elements are metallicity dependent and are taken from Nomoto, Kobayashi & Tominaga (2013) for single stars and from Iwamoto et al. (1999) for SNIa (see Appendix C in Kubryk, Prantzos & Athanassoula 2015 for details). A more detailed de-scription will be given elsewhere (Rodionov et al., in prep.).
There is one crucial free parameter in the present application of our code, namely the metallicity at the beginning of our simu-lation. If we had a cosmological simulation we would have started with zero metals. However, in order to fully follow the dynamics and evolution of the bar/bulge region we need to have a dynamical simulation which does not start at the time of the Big Bang and the formation of the large scale structure. It just starts from the pro-genitors of the last major merger and we need to assume that some of the elements are already formed. In this letter we use an ini-tial metallicity of [Fe/H]=-1 (Wolfe, Gawiser & Prochaska 2005). More on different choices will be included in Rodionov et al. (in prep.).
2.3 Model
Simulation mdf732, described in some detail in A16, has proper-ties that make it a reasonable choice for a qualitative model of the bar/bulge region of our Galaxy. In particular it has a classical bulge with only 9 – 12% of the total stellar mass and a bar of roughly the correct size, with a boxy/peanut inner part. We thus reran it using 27.5 million particles to enhance the signal-to-noise, because we need to split the data by metallicity, b and l. We use here the snap-shot of this new simulation at time t=10 Gyr, but we made sure that other late times in the simulation around this one gave very similar results.
As described in A16, there are two times which can be consid-ered as landmark times for the disc galaxy formation. The first is
the beginning of the merging period, or merging time, tbm, which
is the time beyond which the distance between the centres of the two protogalaxies becomes and stays less than 1 kpc (A16). The
second time is tbd, the time at which the thin disc starts forming.
The values of these times for our simulations are 1.4 and 2.2 Gyr, respectively (A16).
Although we do not claim to have a full model of our Galaxy, our model is a sufficiently reasonable approximation to use for the present qualitative comparison. Here we follow Ness et al. and con-sider only stars within a cylindrical radius of 3.5 kpc from the cen-tre, so as to concentrate on the bar/bulge region. Except for Fig. 3 and its discussion, we use everywhere the geometry of our Galaxy,
placing the bar major axis at 27◦to the line from the Sun to the
Galactic centre and assuming that the Sun is on the equatorial plane at a distance of 8 kpc from the centre.
3 RESULTS
In all the following analysis we use three metallicity bins, namely low metallicity 1.0<[Fe/H]<-0.5, hereafter LM), intermediate (-0.5<[Fe/H]<0, hereafter IM) and high metallicity (0<[Fe/H]<0.5, hereafter HM) bins, with one exception, namely in Sect. 3.1.2, where the high metallicity bin is defined as 0<[Fe/H], to follow N13b. Furthermore, in Sects. 3.2 and 3.3 we add a yet higher metal-licity bin with 0.5<[Fe/H]<1 (hereafter HHM).
3.1 Metallicity dependent kinematics
3.1.1 Comparison to the Babusiaux plot
To show the link between metallicity and kinematics, Babusiaux (2016) plotted the dispersion of the line-of-sight velocity as a
func-tion of latitude and constrains her plot to stars around l=0◦ and
from either the LM, or the HM metallicity ranges, i.e. neglecting all stars with IM metallicities. We repeated this for our simulation and three values of the longitude and give the results in the left panel of Fig. 1. We find that, for LM stars, σ takes higher values than for HM ones. Furthermore, for LM stars σ varies little with |b| or |l|, while for HM stars it decreases considerably with increasing
|b|. Note also that this decrease is strongest for l=0◦
, and weakens with increasing |l|. We thus conclude that there is an excellent qual-itative agreement between our simulations and observations (and even a reasonable quantitative one, as can be seen by comparing our figure with figure 4 of Babusiaux 2016).
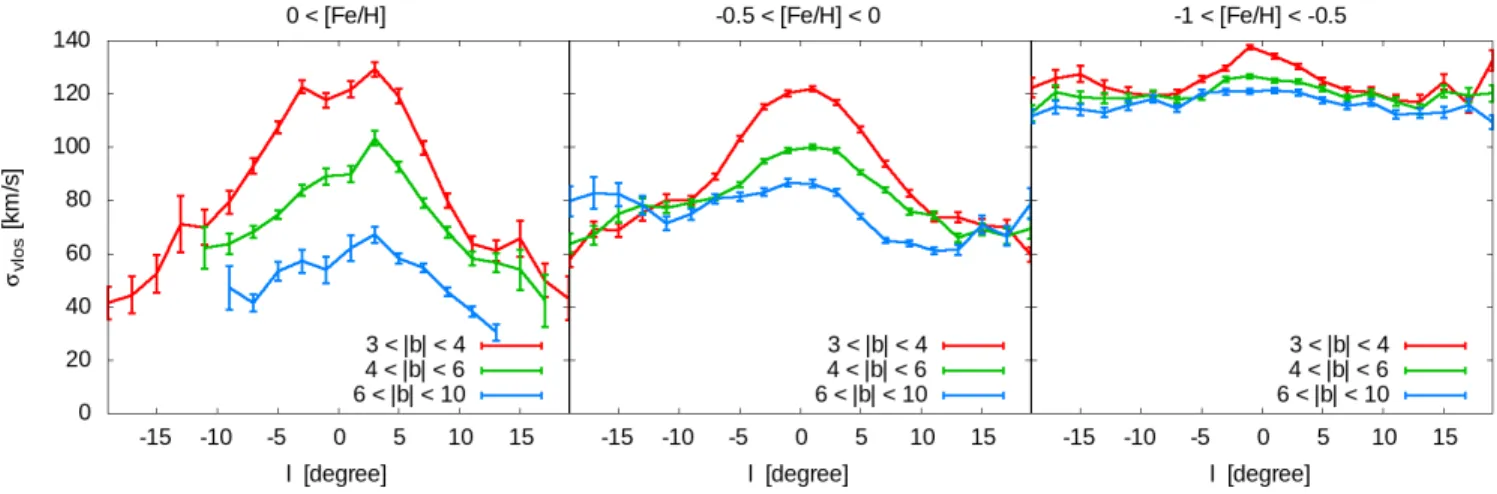
3.1.2 Comparison to ARGOS and APOGEE results
Fig. 2 shows the velocity dispersion as a function of l for three metallicity bins, i.e. from left to right, stars with 0<[Fe/H], IM and LM stars respectively, i.e. the same bins as in N13b, so that it can be directly compared to the lower panels of figure 6 of that paper. LM stars have in general higher values of σ than HM ones. For HM stars, σ is much larger at small |b| than at large |b|. This
differ-ence with |b| is very strong for l=0◦and decreases with increasing
|l|. For small values of |b|, and still for HM stars, there is also a dependence on l, the velocity dispersion being higher at the cen-tre and decreasing with increasing |l|, as expected. This decrease is stronger for low than for high |b|. These trends can also be found for LM stars, but to a much less pronounced. The IM stars have an intermediate behaviour, as expected.
We thus reproduce well the main observational characteristics found by N13b. In the lowest metallicity bin, however, the σ stays considerably flatter with l than in N13b. This discrepancy is even stronger when we compare with the Z16 data. Indeed, the Z16 data
c
Figure 1. Left: Velocity dispersion as a function of galactic longitude for two metallicity bins, one with LM stars and the other with HM stars. For each metallicity bin we average values from positive and negative b and we show longitudes with l=0◦, 5◦, and 10◦. Middle: Mean star formation time as a function of galactic latitude. The layout, as well as the split in two metallicity groups is the same as for the left panel. Right: Star Formation History within the considered region (R<3.5 kpc) as a function of time, separately for stars in LM, IM, HM and HHM metallicity bins.
Figure 2. Velocity dispersion as a function of Galactic longitude for three metallicity bins.
give results qualitatively in agreement with Ness et al., but quanti-tatively showing a smaller difference between the kinematics of the various populations. This could well be understood by the different selection criteria of the N13b and Z16 samples (inclusion or not of foreground stars, choice of metallicity bins, latitudes, etc.). Never-theless, the effect of the various selection criteria on the data is well beyond the scope of this letter and will be left for future work. How-ever, this difference between the two observational data sets helped us focus on the initial [Fe/H] used our simulations (Sect. 2.2) and we made a new calculation, starting the chemical evolution from zero metals initially. This produced a considerably stronger de-crease of σ with |l|, although always less than the corresponding decrease in the higher metallicity bins. We can thus achieve a good qualitative agreement. It is difficult, however, to obtain a quantita-tive agreement and to find, even approximately, what the best initial metallicity value is. We thus again limit ourselves to a qualitative agreement.
We conclude that there is very good qualitative agreement be-tween our simulations and observations, and we stress that this is found directly from the simulations, without having to add by hand any further stars, implying that our scenario of the galaxy formation history gives a right mix of the various types of stars.
3.2 Stellar ages and star formation (SF)
In the middle panel of Fig. 1 we plot the mean star formation time after binning stars by metallicity and longitude. We see clearly that the stars in the low metallicity bin were born preferentially be-tween, on average, one or two Gyr from the beginning of the
sim-ulation, i.e. around tbm(1.4 Gyr), while those in the HM bin were
born considerably later, between, on average, 4 and 7 Gyr ago. Note also that there is not much dependence of these birth times on |b|.
The right panel of Fig. 1 shows the star formation history of
stars within the inner 3.5 kpc (SFH3.5), i.e. the histogram of the
stellar mass born at a given time. This is done separately for our three metallicity bins, i.e. LM, IM, HM and the yet higher metallic-ity HHM bin. We note that the LM and HM have SFH time distribu-tions of quite different forms. The former were born much before the latter, in good agreement with what was shown in the middle panel of Fig. 1. Furthermore, the birth times of the LM stars are
quite concentrated around tbm(1.4 Gyr), suggesting that these star
formations are due to a starburst, presumably from strong inflow of gas during the merging. On the other hand, those of the HM stars are very spread out, starting from 7 Gyr ago and continuing up to the end of the simulation. The IM stars are intermediate, as expected.
4
E. Athanassoula, S. Rodionov, N. Prantzos
Figure 3. Edge-on views of the baryonic projected surface density in four metallicity bins. The side of each of the four squares covers ±3 kpc from the centre of the galaxy.
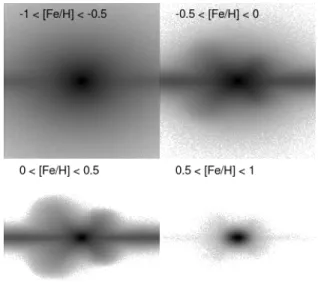
Figure 4. (l,b) perspectives of the baryonic projected surface density in four metallicity bins. The bar major axis is at 27◦from the line of sight to the centre of the galaxy, as in the MW and positive l is on the left.
3.3 Spatial distribution of metallicity-defined populations
To understand the spatial distribution of populations with different metallicities we viewed them side-on, i.e. edge-on with the line of sight in the equatorial plane and along the bar minor axis (Fig. 3). In this figure we wish to view the bar and its B/P structure in an optimal manner and not to compare with observations. We thus ex-clude stars from the foreground and background disc component, using a cut-off of |∆y|<0.5 kpc, where y is the distance of the ‘star’ from the plane perpendicular to the line of sight and through the centre of the galaxy. On the contrary, in Fig. 4 we view the bar in l, b coordinates, i.e. as viewed from the Sun, and introduce only the cut-off of R<3.5 kpc. We then split, both for Figs. 3 and 4 all stars in four metallicity bins – LM, IM, HM and HHM.
The difference between the distributions corresponding to dif-ferent metallicity ranges is striking. The lowest metallicities are dis-tributed in a spheroidal-like shape flattened in the vertical direction, and including a low density disc, which has a thick and smooth outline in the z direction. They do not show any, or very little, X-shaped structure, in good agreement with observations (e.g. Ness et al. 2012; Uttenthaller et al. 2015; Rojas-Arriagada et al. 2014; Kunder et al. 2016).
The IM stars show a clear X-shape embedded in a spheroidal-like or boxy-spheroidal-like part, implying that the stars in this bin come from two quite different populations and components. The HM bin has only the X-shape and a clear underlying disc component. These two panels show that the X-shape is of the off-centred type (OX, Bureau et al. 2006), i.e. that the branches of the X join only in pairs, two on either side of the centre (>—-<), contrary to the centred X (CX), where all four branches join in the centre (><). This is the case for about half of the Bureau et al. sample of X-shaped bulges.
Finally, the distribution of the material in the last metallicity bin (HHM) is centrally concentrated and its vertical extent is small compared to its horizontal extent. Although this definitely needs further study, it is tempting to associate it with a discy pseudo-bulge (see e.g. Athanassoula 2016 and 2008 for definitions and reviews). These density distributions show that the bar/bulge region is complex, with many co-existing stellar populations, while the ratio of their mass is a function of location. This also is in good agree-ment with observations (e.g. Ness et al. 2013a).
4 SUMMARY AND DISCUSSION
We use numerical simulations that follow the formation of a disc galaxy subsequent to a major merger of two protogalaxies with ex-tended gaseous haloes. In a previous paper (A16) we showed that such events could form realistic disc galaxies. We thus apply such a model to the central bar/bulge region of our Galaxy.
Metallicity distribution functions (Ness et al. 2013a) imply the existence of more than one stellar population in this region. We thus analysed, as in observations, separately three populations, with metallicities -1.<[Fe/H]<-0.5 (LM), -0.5<[Fe/H]<0 (IM) and 0<[Fe/H]<0.5 (HM), respectively.
As in observations, we limited ourselves to the inner 3.5 kpc so as to concentrate on the bar/bulge region. We compared the ve-locity dispersions of the LM and HM populations (IM stars have an intermediate behaviour) and found them quite different. This im-plies that they have quite different kinematics. LM stars have large velocity dispersions, which, furthermore, show little, or no, depen-dence on either latitude or longitude. HM stars located near the equatorial plane have roughly the same velocity dispersion as the LM ones, but this dispersion decreases substantially with increas-ing |l|, or b. The decrease with b is stronger for smaller longitudes. We thus find excellent qualitative agreement between our sim-ulations results and those of spectroscopic observations, concerning the kinematics, the metallicities and their link. This argues that the properties we are discussing must be generic to disc galaxies with boxy/peanut/X bulges, because our model, although it gives a rea-sonable fit to a number of MW quantities and properties, was not specifically built for this purpose.
We also followed the ages and the SFH3.5separately for each
of our metallicity defined populations. We find that the LM stars were born early on and in a relatively narrow time range centred
roughly on tbm(1.4 Gyr). On the other hand, the HM stars are born
c
later, up to considerably later, and over a much broader time range which extends to the end of the simulation.
Finally we inspected the morphology of each of these popula-tions separately. We found that the LM population makes a flattened spheroidal-like object, which could be considered as a compound of the thick disc, a stellar halo and (whenever present) a small clas-sical bulge. The IM and HM populations show clearly an X-shape when viewed side-on and are the two only populations to do so.
A clear conclusion from all our results is that the central re-gion of our Galaxy, and therefore of a number of external barred galaxies, is very complex, which can be understood by realising that a number of components are cohabiting in this area. These components have widely different morphological, kinematical and chemical properties and the properties of any region depend on the relative density of these components in it. Such a mix may not be obvious to disentangle quantitatively, but is a natural consequence of the dynamical processes governing the formation of the MW.
In A16 we had decomposed the baryons as a function of their birth time in five different populations. Using morphology, radial projected density profiles and circularity parameters, we found that stars born in the individual protogalaxies, i.e. before the merging, undergo violent relaxation during the merger and end up mainly in a triaxial classical bulge and a stellar halo. Stars born during the merging period contribute partly to a similar though more extended spheroid and partly to a thick disc and the bar that forms from it. Stars born in the beginning of this period mainly contribute to the classical bulge and only little to the thick disc. On the other hand, when we consider stars born at times nearer to the end of the merg-ing period, it is the thick disc that is the main contributor. At times after the end of the merging period (more precisely for times after
tbd) the gas accreted from the gaseous halo forms a thin disc and
its substructures such as spirals, or a bar, or a boxy/peanut bulge. This picture is of course a very simplified description of how the
stellar populations form, because for example stars born after tbd
(2.2 Gyr) in the thin disc could become members of the thick disc after being perturbed by small dark or luminous satellites, or by spirals. Furthermore, material from the gaseous halo will fall in at
all times, and not only after tbd. Thus the boundaries set by the
landmark times are not sharp and the whole evolution can be seen as a continuous sequence from an all-spheroid to an all thin disc formation, with strong changes at the landmark times.
The results we find here are well compatible with this evolu-tion picture proposed in A16. We find that the LM stars are old, and are born in a relative short time range around the merging time. They have larger velocity dispersions than HM stars, compatible with them being stars partly in a spheroid and partly in a thick disc. Most important, their 2D projected density distribution has the right shape for such components.
The HM stars were born on average much later than the LM ones, and over a much more extended range of times, extending all the way to the present time. They generally have smaller
veloc-ity dispersions, as would be expected for disc stars. For b=0◦, and
in general up to roughly |b|=4◦, their velocity dispersion decreases
with increasing |l| (left panel of Fig. 1, as expected for a disc. Most important, the corresponding 2D projected density distribution is that of a disc population, some of it having undergone the bar in-stability and then formed a clear X-shape.
Thus in the bar/bulge region we find a classical bulge com-ponent, a thin and a thick disc comcom-ponent, together with the cor-responding bar and boxy/peanut/X bulge, and, most probably, a discy bulge, although to affirm the latter we need yet higher res-olution simulations. The ratio of masses of these components vary
from one barred galaxy to another, so the one we have here may not correspond accurately to that of the MW.
It is important to stress that none of the components is strictly confined to a given bracket, be it in time, or age, or metallicity. Thus at any location there is mix of populations. This cohabitation ex-plains the links of metallicity with kinematics (as found in observa-tions) and also with morphology, as stressed here. Regions that are dominated by the spheroid population will have both spheroid kine-matics and spheroid metallicities, while regions which are domi-nated by disc population will have both disc kinematics and disc metallicities. This makes the link between kinematics and metallic-ities obvious, since we can not have e.g. spheroid kinematics and disc metallicities in the same component. Thus such links should be found also in external galaxies having a B/P structure viewed edge-on.
ACKNOWLEDGEMENTS
We thank A. Bosma, C. Chiappini, K. Freeman, M. Ness and G. Zasowski for stimulating and useful discussions and the referee for a constructive report. We acknowledge financial support from the CNES (Centre National d’Etudes Spatiales - France), as well as HPC resources from GENCI - TGCC/CINES x2016047665 (pro-gram SINGSONG) and from the Mesocentre of Aix-Marseille Uni-versit´e (program DIFOMER).
REFERENCES
Athanassoula E., 2008, in Formation and Evolution of Galaxy Bulges, IAU Symp. 245, Cambridge, UK: Cambridge Univ. Press, 93
Athanassoula, E., 2016, in Galactic Bulges, Astrophysics and Space Science Library, Vol. 418, Springer Verlag, Germany, 391 Athanassoula, E., Rodionov, S., Peschken, N., Lambert, J.C. 2016,
ApJ, 821, 90 (A16)
Babusiaux, C. et al. 2010, A&A, 519, 77 Babusiaux, C. et al. 2014, A&A, 563, 15
Babusiaux, C. 2016, Publ. Astr. Soc. Autralia, 33, 26 Bekki, K., Tsujimoto, T. 2011, MNRAS, 416, 60L
Bureau M., Aronica G., Athanassoula E., Dettmar R.-J., Bosma A., Freeman K. C., 2006, MNRAS, 370, 753
Di Matteo, P. et al. 2015, A&A, 577, A1 Iwamoto, K.et al. 1999, ApJS, 125, 439 Kroupa, P. 2002, Science, 295, 82
Kubryk, M., Prantzos, N., Athanassoula, E. 2015, A&A, 580, 126 Kunder et al., 2016, arXiv:1603.06578
Martinez-Valpuesta, I., Gerhard, O. 2013, ApJL, 766, 3 Ness et al. 2012, ApJ, 756, 22
Ness et al. 2013a, MNRAS, 430, 836 Ness et al. 2013b, MNRAS, 432, 2092
Nomoto, K., Kobayashi, C., Tominaga, N. 2013, ARA&A, 51, 457
Rojas-Arriagada, A. et al. 2014, A&A, 569, A103 Springel, V., Hernquist, L. 2002, MNRAS, 333, 649 Springel, V., Hernquist, L. 2003, MNRAS, 339, 289
Uttenthaler, S., Schultheis, M., Nataf, D. M., Robin, A. C., Lebzelter, T., Chen, B. 2012, A&A, 546, A57
Wolfe, A., Gawiser, E., Prochaska, J. 2005, ARA&A, 43, 861 Zasowski, G., Ness, M., Garc´ıa P´erez, A., Martinez-Valpuesta, I.,