HAL Id: hal-03018606
https://hal.archives-ouvertes.fr/hal-03018606
Submitted on 23 Nov 2020HAL is a multi-disciplinary open access archive for the deposit and dissemination of sci-entific research documents, whether they are pub-lished or not. The documents may come from teaching and research institutions in France or abroad, or from public or private research centers.
L’archive ouverte pluridisciplinaire HAL, est destinée au dépôt et à la diffusion de documents scientifiques de niveau recherche, publiés ou non, émanant des établissements d’enseignement et de recherche français ou étrangers, des laboratoires publics ou privés.
Functional potential of sewage sludge digestate microbes
to degrade aliphatic hydrocarbons during bioremediation
of a petroleum hydrocarbons contaminated soil
Anna Gielnik, Yoan Pechaud, David Huguenot, Aurélie Cebron, Giovanni
Esposito, Eric van Hullebusch
To cite this version:
Anna Gielnik, Yoan Pechaud, David Huguenot, Aurélie Cebron, Giovanni Esposito, et al.. Functional potential of sewage sludge digestate microbes to degrade aliphatic hydrocarbons during bioremediation of a petroleum hydrocarbons contaminated soil. Journal of Environmental Management, Elsevier, 2020, �10.1016/j.jenvman.2020.111648�. �hal-03018606�
Functional potential of sewage sludge digestate microbes to degrade
1aliphatic hydrocarbons during bioremediation of a petroleum
2hydrocarbons contaminated soil
34
Anna Gielnik 1,2, Yoan Pechaud 1, David Huguenot 1, Aurélie Cébron 3, Giovanni Esposito 2, Eric D. 5
van Hullebusch 4,5 6
1Université Paris-Est, Laboratoire Géomatériaux et Environnement (LGE), EA 4508, UPEM, 77454 7
Marne-la-Vallée, France 8
2University of Napoli “Federico II”, Department of Civil, Architectural and Environmental 9
Engineering, 80125 Napoli, Italy 10
3Université de Lorraine, CNRS, LIEC, F-54000 Nancy, France 11
4IHE Delft Institute for Water Education, Department of Environmental Engineering and Water 12
Technology, P.O. Box 3015, 2601 DA, Delft, The Netherlands 13
5Université de Paris, Institut de physique du globe de Paris, CNRS, F-75005 Paris, France 14
15 16
Corresponding author: Anna Gielnik 17
E-mail: (aniagielnik@gmail.com) 18
Postal address: Université Paris-Est, Laboratoire Géomatériaux et Environnement (LGE), EA 4508, 19
UPEM, 5 Bd Descartes 77454 Marne-la-Vallée, France 20
21 22
23
24
Active aeration system
Soil + saw dust + mineral nutrients Soil + saw dust + digestate
Solid phase glass bioreactor Soil + saw dust + digestate + immobilised inoculum Increase of: • PHCs degradation efficiency • Diversity of PHCs degrading bacteria • Content of alkB genes
• Soil respiration - alkB genes ratio up to 11.7 % - alkB genes content up to 1.8 × 10⁷
- alkB genes ratio up to 1.7 % - alkB genes content up to 3.1 × 10⁶
- alkB genes ratio up to 60.1 % - alkB genes content up to 7.1 × 10⁷
Soil
- alkB genes ratio up to 1.9 % - alkB genes content up to 5.9 × 10⁵
Highlights 25
• PHCs contaminated soil was treated with digestate in actively aerated bioreactors
26
• Digestate application increased alkB genes content in soil
27
• Digestate was more efficient in bioremediation compared to mineral nutrients
28
• Application of immobilised bacteria together with digestate increased PHCs removal
29
• Digestate increased density and diversity of PHCs degraders in soils
30 31
Abstract 32
Sewage sludge digestate is a valuable organic waste which can be used as fertilizer in
33
soil bioremediation. Sewage sludge digestate is not only a good source of nutrients but is also
34
rich in bacteria carrying alkB genes, which are involved in aliphatic hydrocarbons metabolism.
35
Increase of alkB genes ratio in polluted soils has been observed to improve bioremediation
36
efficiency. In this study, for the first time, the genetic potential of indigenous microorganisms
37
of digestate to degrade petroleum products was assessed. The objectives were to study
38
petroleum hydrocarbons (PHCs) removal together with shifts in soil taxa and changes in the
39
concentration of alkB genes after digestate application. Initial alkB genes concentration in
40
contaminated soils and digestate was 1.5% and 4.5%, respectively. During soil incubation with
41
digestate, alkB genes percentage increased up to 11.5% and after the addition of bacteria
42
immobilized onto biochar this value increased up to 60%. Application of digestate positively
43
affected soil respiration and bacterial density, which was concomitant with enhanced PHCs
44
degradation. Incubation of soil amended with digestate resulted in 74% PHCs decrease in 2
45
months, while extra addition of bacteria immobilized onto biochar increased this value up to
46
95%. The use of digestate affected the microbial community profiles by increasing initial
47
bacterial density and diversity, including taxa containing recognized PHCs degraders. This
48
study reveals the great potential of digestate as a soil amendment which additionally improves
49
the abundance of alkB genes in petroleum contaminated soils.
50
Key words: alkB genes, bioreactors, organic wastes, soil clean-up, PHCs 51
1. Introduction 53
Intensive exploration and refinery of crude oil have resulted in a worldwide legacy of
54
soils polluted with crude oil composed mostly of alkanes and its derivates, which constitutes a
55
threat for human health, disables soil services and affects land management (Shahi et al., 2016).
56
Bioremediation is an efficient strategy to treat petroleum hydrocarbons (PHCs) contaminated
57
soils (Lu et al., 2014). A successful bioremediation treatment requires regulation of soil nutrient
58
ratio (C:N:P), oxygen supply and most of all, dense, specialized microbial biomass able to
59
metabolize the contaminants (Safdari et al., 2018). One of the most important enzymes group
60
involved in PHCs oxidation are alkane monooxygenases encoded by alkB genes, responsible
61
for the first step of alkanes oxidation (Fuentes et al., 2014). Actual research and development
62
efforts are focusing on the increase of the ‘soil bioremediation potential’ which is connected
63
with the abundance of petroleum degraders, and thus functional genes, responsible for
64
contaminant degradation (Abtahi et al., 2020; Powell et al., 2006).
65
An efficient way to increase the density of PHCs metabolizing bacteria in soil, and thus,
66
to increase soil alkB genes content, is bioaugmentation. This method includes addition of liquid
67
biomass suspensions or immobilized bacteria (e.g. onto biochar) to soil (Agnello et al., 2016;
68
Mrozik and Piotrowska-Seget, 2010). Immobilization of inoculum on porous organic carriers
69
becomes popular practice due to significant improvement of microbial cells preservation
70
(Mrozik and Piotrowska-Seget, 2010). Dense and diverse microbial populations with a wide
71
metabolic capacity, which may serve for bioremediation purposes are also found in organic
72
fertilizers (Barra Caracciolo et al., 2015; Megharaj et al., 2011). However, those fertilizers are
73
poorly investigated in terms of functional genes content allowing alkanes degradation.
74
Digestate is a by-product of anaerobic digestion of organic residues (e.g. sewage sludge,
75
animal manures, organic fraction of municipal solid wastes) and constitutes a valuable soil
76
amendment with undiscovered potential in bioremediation (Kataki et al., 2017). Compared to
77
raw feedstock, nutrients in digestate are concentrated and present in bioavailable form (e.g.
78
ammonia) (Gómez-brandón et al., 2016), additionally the amount of easily biodegradable
79
compounds is reduced which is beneficial for bioremediation as they constitute a preferable
80
carbon source for microorganisms (Sayara et al., 2010).
81
Organic fertilizers were already studied in soil bioremediation, however mainly as
82
nutrient sources (Osei-Twumasi et al., 2020; Xi et al., 2020). If the microbial population
83
engaged in PHCs metabolism was studied, the data were restricted to simple analysis
monitoring general changes of microbial community (DGGE, TTGE) or identification of
85
culturable bacterial strains (Abtahi et al., 2020). We hypothesized that bacteria contained in
86
digestate can enrich metabolic potential of soil providing new PHCs degrading taxa and thus
87
increase the content of alkB genes. We also hypothesized that addition of bacteria immobilized
88
onto biochar may further increase process efficiency if inoculated microorganisms have been
89
previously acclimated to treatment conditions. In this study, for the first time, we tested sewage
90
sludge digestate as soil inoculum in lab-scale aerated bioreactors. Our goal was to study how
91
addition of sewage sludge digestate to PHCs contaminated soil affects the concentration of alkB
92
genes and contaminants removal in time. We have also performed sequencing of total bacteria
93
in multiple time points to verify if addition of digestate affected the number of genera associated
94
with PHCs metabolism.
95 96
Materials and methods 97
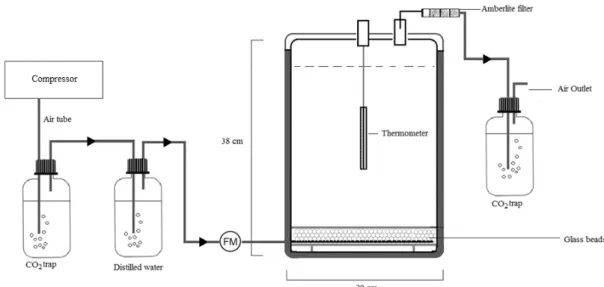
1.1 Experimental set-up 98
The experiments (Figure 1) were performed in 12 L glass solid phase bioreactors with
99
active aeration designed according to Namkoong et al. (2002). To provide appropriate oxygen
100
amount, bioreactors were aerated from the bottom, with air flow rate ranging between 190 and
101
200 L h-1 m-3 soil. Before entering into the reactors, CO2 was removed from the inlet air by a
102
NaOH trap. Next, the air passed through a humidifier to remove aspirated alkali solution and to
103
increase humidity content in order to prevent reactors from drying. Exhaust air from the reactors
104
was filtered by an Amberlite® column in order to adsorb volatile organic compounds, which
105
could be released due to hydrocarbons volatilization. Further, the exhaust air passed through
106
5M NaOH trap to accumulate CO2 generated during bacterial respiration. The amount of
107
trapped CO2 was quantified by titration with HCl (Namkoong et al., 2002).
109
Figure 1. Scheme of bioreactor set up used in the study. FM: flow meter. Arrows indicates the 110
direction of the airflow. 111
To ensure high porosity of the soil mixture, treated soil was mixed with bulking agent
112
(sawdust). The ratio of added sawdust was adjusted to favor a homogeneous airflow throughout
113
reactor (Rhykerd et al., 1999). Apart from control condition (B1), three biostimulation and
114
bioaugmentation treatment conditions were tested in duplicate (Table 1). Biostimulation
115
treatments covered addition of nitrogen in the form of NH4Cl (B2) or sewage sludge digestate
116
(B3). The digestate to soil ratio was optimized based on previous studies (Gielnik et al., 2018;
117
Namkoong et al., 2002). In bioaugmented treatments, bacteria immobilized on biochar were
118
added together with digestate (B4). The ratio of added biochar was suggested by other studies
119
(Brown et al., 2017). Bioreactors were incubated during 63 days at 20 °C (±2 °C). To ensure
120
the homogeneity of the mixture, the content of bioreactors was mixed once a week and humidity
121
level was checked by drying the samples overnight at 110 °C and further adjusting reactors
122
content to fit 60% of the water holding capacity (WHC). Temperature inside the reactors was
123
measured during the treatment by thermocouple systems. To study the volatile fraction of PHCs,
124
exhaust column with 25 g of Amberlite® was extracted every week and the sorbent was
125
replaced.
126
Once a week, 50 g of a representative sample (10 g of sample collected from 5 points
127
and pooled together) originating from different reactor locations was collected from each
128
reactor and homogenized for PHCs quantification and DNA extraction. Before PHCs
129
extraction, soil mixture was air dried and grinded in a mortar. DNA analyses of every bioreactor
130
were performed in triplicate. For DNA extraction, 5 g aliquots of the fresh samples were stored
131
at -20 °C.
132 133
134
Table 1. Treatments analyzed during the experiment. 135
Set-up Description
B1 Control: Soil (5.00 kg) + sawdust (0.49 kg = 500 cm3) + water (60% WHC) B2 Soil (5.00 kg) + sawdust (0.49 kg = 500 cm3) + NH
4Cl (C:N:P 100:10:2) + water (60% WHC)
B3 Soil (3.75 kg) + sawdust (0.49 kg = 500 cm3) + digestate (1.25 kg) + water (60% WHC) B4 Soil (3.50 kg) + sawdust (0.49 kg = 500 cm3) + digestate (1.25 kg)
+ bacteria immobilized onto biochar* (0.25 kg) + water (60% WHC)
*indigenous hydrocarbon degrading bacteria were enriched from bioreactor B3 136
137
1.2 Soil, digestate and biochar 138
Sewage sludge digestate was obtained from a biogas plant located in Limoges (France).
139
Soil contaminated with petroleum products was obtained from an oil refinery site located in the
140
north-east of France. Soil was air dried and sieved through < 2 mm according to the ISO 11464
141
standard method. Fresh digestate was homogenized, sieved through < 2 mm and stored at 4 °C
142
before analysis. Detailed parameters of both digestate and soil are presented in Table 2. Initial
143
physico-chemical characterization of soil and digestate as well as concentration of polycyclic
144
aromatic hydrocarbons (PAHs) in the soil was performed by Synlab (France, ISO/IEC
145
17025:2005).
146
Biochar used for bacteria immobilization was produced from sewage sludge digestate
147
by pyrolysis using the Biogreen® technology (Wongrod et al., 2018). Detailed characteristics
148
of the biochar are given elsewhere (Wongrod et al., 2018). Before use, biochar was washed
149
with ultrapure water to remove remaining impurities until the pH value of leaching water was
150
stabilized, then sterilized by autoclaving and air dried under sterile hood (Xu and Lu, 2010a).
151
Bacteria enriched for immobilization originated from the soil mixtures with the same
152
composition as in bioreactor B3 (Table 1). Before enrichment, soil mixture was incubated for
153
2 weeks to allow microbial adaptation and consequent community rearrangements. The
154
immobilization procedure is given in details elsewhere (Gielnik et al., 2018). The final amount
155
of immobilized bacterial cells represented by colony-forming unit was 3.4 × 10⁸ cells per 1 g
156
of biochar.
Addition of biochar to contaminated soil may result in irreversible sorption of PHCs
158
and formation of non-extractable residues. To verify if addition of biochar had significant effect
159
on PHCs concentration decrease, not due to biological processes, a simple test was performed.
160
Contaminated soil was mixed with non-inoculated biochar in a proportion corresponding with
161
bioreactor B4 (Table 1). Control constituted of a sole soil sample. Water content of both variants
162
was maintained at 60% of WHC and samples were incubated in triplicate for 2 months at 20
163
°C. After that time PHCs were quantified in all samples. Results have not revealed significant
164
differences in PHCs level between the control and sample with biochar (data not shown).
165 166
Table 2 Characteristics of soil and digestate used in the study.OM: organic matter; P: phosphorus; 167
TN: total nitrogen; TOC: total organic carbon; PHCs: petroleum hydrocarbons, WHC: water holding 168
capacity, DW: dry weight, US-EPA:United States Environmental Protection Agency. 169
Soil Sewage sludge digestate Method
pH (H2O) 6.2 (0.2) 7.1 (0.1) NF ISO 10693
Water content (%) 0.4 (0.1) 95.6 (0.2) NEN-ISO 11465
WHC (mL cm-3) 0.2 (0.1) n.a. OECD test No. 222
OM (%) 2.2 (0.1) 87.3 (0.7) NF ISO 14235 TOC (g kg-1 DW) 15 (1) 120 (7) NEN-EN 13137 TN (g kg-1 DW) 0.3 (0.1) 20.8 (0.8) NEN-EN-ISO 11732 P (g kg-1 DW) 0.3 (0.1) 10.0 (0.2) NEN 6961, CEN/TS 16171, NF-EN 16179 C:N:P 100:2.3:2.0 100:17.3:8.3 - PHCs (mg kg-1 DW) 13200 (124) 1.8 (0.1) Section 2.4 US-EPA 16 PAHs (mg kg-1 DW)
25 (1) n.a. Internal method (SynLab)
Total elements content (mg kg-1 DW) NEN 6961,
NEN-EN-ISO17294-2 Fe 7600 (124) 54000 (210) Al 2700 (35) 7600 (14) Cd 0.3 (0.0) 0.7 (0.0) Cr 8.7 (0.1) 34.0 (0.3) Cu 57 (1.0) 110 (1.2) Hg 6.5 (0.2) 0.7 (0.1) Pb 120 (4.4) 27 (2.3) Ni 7.0 (0.1) 8.9 (0.4) Zn 88 (1.5) 270 (6.2)
n.a.: not analyzed 170
1.3 PHCs quantification 171
For PHCs analysis 10 g of air-dried and grinded sample was extracted with 10 mL of
172
hexane. To study PHCs volatilization, 25 g of Amberlite® from the exhaust gas column was
173
extracted with a mix of 15 mL methanol and 15 mL hexane. The extraction procedure was based
174
on USEPA 8015B and 3550s methods (USEPA, 2007, 1996), with mechanical shaking
175
combined with ultrasonic extraction. PHCs were quantified on gas chromatography with flame
ionization detector (Shimadzu) with capillary column 30 m ´ 0.25 mm ´ 0.25 µm (ZB5HT
177
Inferno, Phenomenex) and hydrogen as a carrier gas. Maximal oven temperature was 325 °C.
178
Injection was done with 1 µL of sample in the split mode with split ratio 20 and temperature
179
285 °C. Column flow was set at 3.0 mL.min-1 with pressure 113.5 kPa. Diesel oil was used as
180
quantification standard.
181
1.4 DNA extraction 182
Genomic DNA was extracted from 500 mg of freeze samples using Fast DNA Spin Kit
183
for Soils (MP Biomedicals). Extracted DNA was eluted in 100 µL of DNA free ultra-pure water.
184
DNA concentration and purity was determined using spectrophotometer UV-1800 (Shimadzu)
185
equipped with a TrayCell adaptor for micro-volumes (Hellma) (Biache et al., 2017). DNA was
186
stored at – 20 ºC for further analyses.
187
1.5 Real-time PCR 188
The extracted genomic DNA was used to quantify total bacterial and fungal populations.
189
Primers selected for total bacteria were 968F/1401R (Felske et al., 1998) targeting 16S rDNA
190
and Fung5F/FF390R (Smit et al., 1999; Vainio and Hantula, 2000) targeting 18S rDNA for
191
fungi. Functional genes, i.e. alkanes hydroxylating monooxygenases genes (alkB), were
192
amplified using primers AlkBF: AACTACATCGAGCACTACGG-3’ and AlkBR:
5’-193
TGAAGATGTGGTTGCTGTTCC-3’ (Powell et al., 2006) using 50°C for annealing
194
temperature. Real-time polymerase chain reaction (qPCR) quantifications were performed
195
using CFX96 Real Time PCR detection system (Bio-Rad) and SybrGreen detection (iQ sybr
196
green Supermix, Bio-Rad), according to the procedure described elsewhere (Cébron et al.,
197
2015, 2008) and using dilution series (101 to 108 copies.µL-1) of standard plasmids.
198
1.6 Sequencing analysis 199
Ilumina MiSeq v3 Sequencing (2 ´ 300 bp) of the V3-V4 region of the 16S rDNA was
200
performed by MicroSynth AG (Switzerland) on previously isolated DNA. The company is ISO
201
certified according to 9001:2008 and ISO / IEC 17025. Library preparation included sample
202
quality control and Nextera two-step PCR amplification using primer set 341f_ill/802r_ill, PCR
203
product purification, quantification and equimolar pooling. Bioinformatic analysis included
204
demultiplexing, merging of forward and reverse reads, quality filtering, trimming, chimera
205
removal, operational taxonomic unit (OTU) clustering (97% identity threshold) and
subsampling for even sample size (rarefaction to the lower number of reads per sample).
207
Taxonomy assignment was based on the SILVA 16S database v.123 (> 60% confidence). Alpha
208
diversity calculation and comparative statistics were done with the use of Phyloseq and DeSeq2
209
(R packages). Heat map of the most abundant genera and clustering with Pearson method were
210
performed using free Heatmapper software (heatmapper.ca).
211
1.7 Germination ecotoxicity tests 212
Germination tests were performed at the beginning and at the end of the experiment
213
with the use of germination plates and seeds of garden cress (Lepidium sativum) and mustard
214
(Sinapis alba) as recommended by previous studies (Gargouri et al., 2014; Maila and Cloete,
215
2005; Mao et al., 2009). Germination plates were filled with 80 g of fresh homogenized sample
216
from each reactor. Control consisted of uncontaminated soil (obtained from the same industrial
217
area as contaminated soil) mixed with sawdust and digestate in the same ratio as soil from
218
bioreactors. Ten seeds were placed equally on each plate. Germination plates were incubated in
219
a growth chamber for 7 days, at 21 °C, with a photoperiod of 12/12 and photosynthetic photon
220
flux density at 100 µmol m−2 s−1. After 7 days, germinated plants were counted, and radicle
221
length was measured. Based on obtained data the germination index (GI) was calculated (Graj
222
et al., 2013) according to the equation:
223
(1)
224
where: Gs and Gc are numbers of seeds germinated in the sample and control, respectively,
225
whereas Ls and Lc are the radicle lengths in the sample and control [mm], respectively.
226
1.8 Microtox® ecotoxicity assay
227
The toxicity of soil elutriates was determined using the Microtox® bioassay according
228
to previous studies (Khudur et al., 2015). Briefly, 1 g of air-dried soil was mixed with 9 mL of
229
ultra-pure water and incubated overnight in the dark at 150 revolutions per minute. After
230
incubation each sample was centrifuged at 4 500 revolutions per minute for 10 min. The
231
luminescence was measured on the dilutions of soil leaches at 15 °C after 5 and 15 min of
232
exposure, using a Microtox M500 Analyzer and with Aliivibrio fischeri (Hach, France) as a
233
biological reagent. Phenol (20 mg L-1) andzinc sulfate (10 mg L-1) standards, as well as reagent
234
[ ]
% 100 ´ ´ = Lc Ls Gc Gs GIcontrol were run with each bath. Delta EC50 represents toxicity loss between samples at day 1 235 and day 63. 236 1.9 Statistical analysis 237
Statistical analyses were performed using XL Stat (Addinsoft 2015) statistical software for
238
Excel. Significant differences of parameters among the treatments were detected with one-way
239
ANOVA (p < 0.05) followed by Tukey Post-Hoc test.
240
2. Results and discussion 241
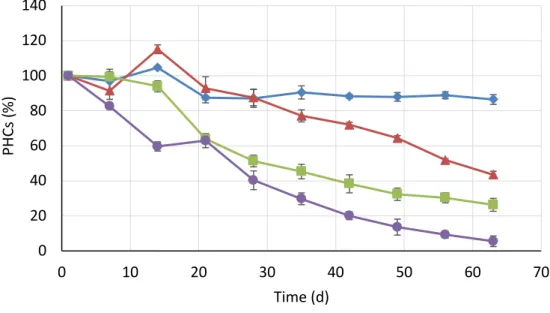
2.1 PHCs removal and mineralization extent 242
PHCs removal over time is presented in Fig. 2. The highest removal after 63 days was
243
observed for treatment B4 containing digestate and immobilized bacteria (94.5%), then for B3
244
with digestate (73.7 %), B2 with mineral nutrients (56.5 %) and the control B1 (13.6 %).
245
Differences observed after 63 days are significant (ANOVA; P ≤ 0.05). During the first 30 days
246
more than 50% of PHCs were degraded in treatments containing digestate (B3 and B4), while
247
in treatment with mineral nutrients 50% of PHCs were degraded after 55 days.
248
249
Figure 2. PHCs depletion during 63 days treatment for B1 condition; B2 condition; 250
B3 condition; B4 condition. Abbreviations (B1, B2, B3, B4) refer to Table 1. Results are presented 251
as a mean of samples collected from two reactors and analyzed in triplicate (n=3) with standard 252
deviation. 253
PHCs degradation efficiencies reported in the literature vary from few weeks to few
254
months depending on soil and contamination characteristics as well as experimental scale
255 0 20 40 60 80 100 120 140 0 10 20 30 40 50 60 70 PHCs (% ) Time (d)
(Agnello et al., 2016; Dados et al., 2014; Megharaj et al., 2011). In the present study, 2 months
256
of treatment were sufficient for almost complete soil clean-up in the condition employing
257
digestate and immobilized bacteria (B4).
258
PHCs removal was followed by the decrease of characteristic unresolved
259
chromatographic peak (Fig. S1) representing weathered polar substances of highly recalcitrant
260
nature (Bruckberger et al., 2018). For the treatments B1 and B2, PHCs increased above initial
261
concentration in the first 15 days, which was not observed in treatments containing digestate.
262
Similar observations were reported in another study (Dados et al., 2014), where the use of
263
(NH4)2SO4 as a nutrient source resulted in initial increase of PHCs concentration within the first
264
20 days, while for treatment with compost the increase did not occur. This suggests buffering
265
capacities of organic amendments in terms of PHCs metabolites (e.g. aldehydes) (Xu and Lu,
266
2010b).
267
268
Figure 3. Carbon mineralization represented by cumulated CO2 production for B1 condition; 269
B2 condition; B3 condition; B4 condition. Abbreviations (B1, B2, B3, B4) refer to 270
Table 1. Results are presented as a mean of samples collected from two reactors and analyzed in 271
triplicate (n=6) with standard deviation. 272
Petroleum compounds in contaminated soils can be removed by biodegradation,
273
biotransformation, volatilization or can be adsorbed on organic matter in a form of
non-274
extractable residues (Kästner et al., 2014). In the present study, volatilization values were below
275
0.5 % of PHCs loss and thus were not further considered. Mineralization of organic carbon
276
represented by CO2 evolution was monitored to support information about microbial metabolic
277
activity and PHCs degradation (Fig. 3). We observed that CO2 evolution was correlated with
278 0 5000 10000 15000 20000 25000 2 9 14 21 26 35 43 50 57 63 Cum ul at ive CO 2 producti on (m gC O2 .k gs oil -1) Time (d)
PHCs removal, suggesting that biodegradation was the major force driving contaminant
279
concentration decrease (Table 3). Mineralization values observed in the study are
280
corresponding with the data of other authors reporting that about 10 g CO2 kg-1 soil was
281
produced during first 30 days of soil treatment with sewage sludge in similar amendment ratio
282
(Namkoong et al., 2002). Application of mineral nutrients often results in lower mineralization
283
rates than organic fertilizers (Cerqueira et al., 2014; Tahhan and Abu-Ateih, 2009). In the
284
present study, the use of digestate doubled respiration rates in comparison with mineral
285
nutrients and was further increased by the application of immobilized bacteria which correlated
286
with PHCs removal degree (Table 3).
287
Table 3. Pearson correlation coefficients and p values between soil respiration and PHCs levels. 288
Abbreviations are reported in Table 1. 289 290 291 292 293 294 295 296 297 298 299 300
Intensive mineralization of organic matter during soil incubation is often followed by
301
temperature rise (Antizar-Ladislao et al., 2006). However, in the present study, temperature
302
inside reactors was equal to the temperature of the inlet air (20 ± 2 ºC). As during anaerobic
303
digestion easily biodegradable carbon is depleted and organic matter becomes stabilized,
304
incubation of digestate may not result in rapid organic matter degradation and heat production.
305
However, a significant organic fraction of organic matter can still be slowly degraded, which
306
eventually contributes to observed CO2 production. This is in accordance with the observations
307
of other authors (Tambone et al., 2015), where composting of different pig slurry digestates did
308
not always resulted in temperature rise but induced changes in Potential Dynamic Respiration
309
Index (PDRI).
310
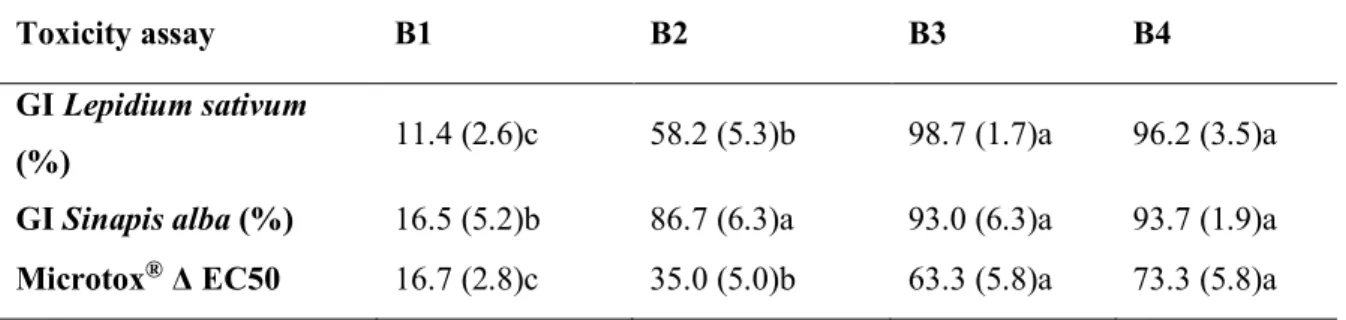
2.2 Soil toxicity changes 311
The concentration of contaminants does not provide direct information about soil
312
toxicity, due to possible presence of toxic substances other than PHCs (e.g. pesticides, trace
313
elements) and toxic metabolites generated during hydrocarbons degradation, such as aldehydes
314 Reactors r p value B1 0.737 0.015 B2 0.947 < 0.001 B3 0.968 < 0.001 B4 0.963 < 0.001
which are less hydrophobic and easily extracted into soil aqueous phase (Xu and Lu, 2010a).
315
The values of germination index (GI) for both tested plants followed the trend of PHCs removal
316
yield with high toxicity for condition B1 (GI < 20 %) and low toxicity values for conditions B3
317
and B4 (GI > 90%). In the same way, Microtox® assay, presented as the relative change of EC50
318
between the start and the end of the experiment, also revealed a toxicity decrease in accordance
319
with PHCs removal yields (B1 < B2 < B3 < B4).
320
High efficiency of PHCs biodegradation was followed by high soil toxicity decrease in
321
treatments containing digestate and digestate with immobilized bacteria. Observed soil toxicity
322
decrease is comparable with results of other authors analyzing bioremediation of industrially
323
contaminated soils treated with mineral fertilizers (Xu and Lu, 2010a). Moreover, in the study
324
of Nwankwegu et al. (2016) as well as in the present study, application of organic fertilizer
325
resulted in higher PHCs removal and toxicity decrease than the use of mineral nutrients pointing
326
that successful remediation may be performed with the use of sustainable nutrient sources like
327
digestate.
328 329
Table 4 Toxicity changes after 63 days of incubation. Abbreviations are reported in Table 1. GI: 330
Germination Index. Results are presented as a mean of samples collected from two reactors and analyzed 331
in triplicate with standard deviation in bracket. Values of the same line followed by different letter are 332
significantly different (ANOVA p < 0.05). 333
Toxicity assay B1 B2 B3 B4
GI Lepidium sativum
(%) 11.4 (2.6)c 58.2 (5.3)b 98.7 (1.7)a 96.2 (3.5)a
GI Sinapis alba (%) 16.5 (5.2)b 86.7 (6.3)a 93.0 (6.3)a 93.7 (1.9)a Microtox® Δ EC50 16.7 (2.8)c 35.0 (5.0)b 63.3 (5.8)a 73.3 (5.8)a 334
2.3 Functional genes abundance 335
Genes copies corresponding to the total bacterial (16S rDNA) and fungal (18S rDNA)
336
communities (Fig. S2), as well as alkB genes (Fig. S3) encoding monooxygenases crucial for
337
alkanes oxidation (Powell et al., 2006) were measured at day 1, 30 and 63. The estimated
338
abundance of fungi was around 2 orders of magnitude lower compared to bacteria (Fig. S2),
339
which is a common observation in soil. Total bacterial population differed among treatments
340
and slightly changed with time. Significantly more 16S rRNA gene copies were found in
341
digestate and treatments B2, B3, B4 compared to the control (B1).
342
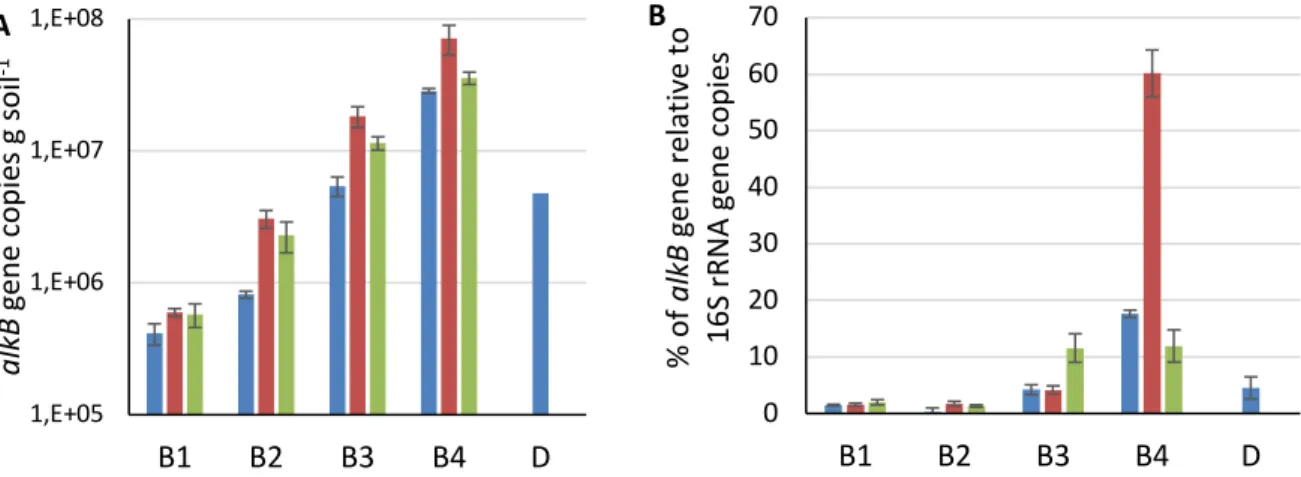
Figure 4A presents changes of the alkB genes concentrations with time. The content of
343
alkB genes for all treatments was as follow B4>B3>B2>B1 (ANOVA; p < 0.05) at all
344
monitoring time points, which corresponds with PHCs removal. For all treatments, excluding
345
control, the lowest concentration of alkB genes was observed at the beginning of the
346
experiment, then it greatly increased during the middle phase and further slightly decreased at
347
the end. Addition of digestate (containing about 5.3 × 10⁶ copies of alkB genes per g of dry
348
weight), has significantly increased the copy number of alkB genes in soil. The initial number
349
of alkB genes in control was 7.6 × 10⁵ while in treatment B3 containing digestate the value
350
exceeded 106 copies g-1 soil (Fig. 4A). Application of immobilized bacteria in treatment B4
351
additionally raised the gene copies number above 107 copies g-1 soil. Such a high concentrations
352
of alkB genes are outstanding in comparison to values obtained with mineral fertilizer as well
353
as values reported in the literature (Masy et al., 2016; Shahi et al., 2016; Sutton et al., 2013).
355
Figure 4. A) AlkB genes copy number during the treatments; B) Percentage alkB genes relative to 356
total bacteria represented by 16S rRNA gene copy number. Treatment times: day 1 ; day 30 ; 357
day 60 . Abbreviations are reported in Table 1. D: digestate. Results are presented as an average value 358
of three samples collected from the same reactor with standard deviation. 359
At day 1, the percentage of alkB relative to 16S rRNA gene copies for control (B1) and
360
treatment with mineral nutrients (B2) were 1.4% and 0.4%, respectively (Fig. 4B), which is in
361
accordance with other studies where the observed values of alkB/16S rDNA for soil treatment
362
with mineral nutrients ranged between 0.1 and 0.6% (Powell et al., 2006; Sutton et al., 2013).
363
In treatment with digestate (B3) the initial alkB/16S rDNA ratio reached 4.2% while in
364
treatment with digestate and inoculated biochar (B4) reached 17.6%, the differences between
365
all treatments were significant (ANOVA; p < 0.05). The final values of the ratio were 2.0, 1.3,
366
11.6, 11.9% for set-up B1, B2, B3 and B4, respectively, which indicates an important role of
367
digestate in supplementation and maintenance of high proportion of bacteria carrying alkB
368
genes in soil. These results are in accordance with a previous microcosm study (Gielnik et al.,
369
2019).
370
The number of PHCs degrading bacteria, and thus the amount of alkB genes are
371
connected to the amount of available substrate (e.g. PHCs) and bacterial activity. Thus, low
372
contents of alkB genes were observed at the beginning of the experiment, before the intensive
373
proliferation of biomass which is normally observed in the first half of the treatment. Intensive
374
bioremediation in the first month was followed by lower activity in the second part of the
375
experiment due to decrease of available substrate, which can be observed in Figure 2.
376
Interestingly, very high ratio of alkB/16S rDNA (60.1%) was observed in the middle phase for
377
treatment B4. It was probably due to introduction of inoculum already acclimated to treatment
378
conditions which allowed fast microbial growth and dominance of bacteria carrying alkB genes
379
over non-specialized soil microbial population. It also suggests that in other treatments, in the
380 1,E+05 1,E+06 1,E+07 1,E+08 B1 B2 B3 B4 D al kB gene copi es g soi l -1 0 10 20 30 40 50 60 70 B1 B2 B3 B4 D % of al kB gene rel at ive to 16 S rR N A ge ne c op ie s A B
phase of intensive proliferation, not only PHCs degraders, but also other bacterial species were
381
promoted.
382
2.4 Bacterial community composition 383
The effect of microorganisms originating from organic fertilizers on bioremediation of
384
PHCs is poorly studied. It was previously observed that successful bioremediation of petroleum
385
products is connected with diverse bacterial community carrying functional genes (e.g. alkB or
386
cytochrome P450 monooxygenase genes) but also with ecological equilibrium among bacteria,
387
including species not directly engaged in bioremediation (Akbari and Ghoshal, 2014). Thus,
388
sequencing of 16S rRNA was performed to study in which extent soil indigenous microflora
389
may be affected by the presence of organic fertilizer and which bacterial groups (originating
390
from soil or from digestate) dominate.
391
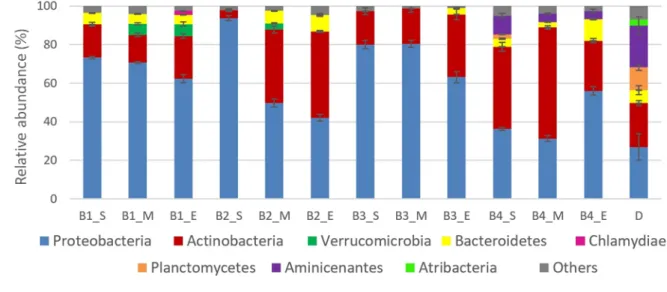
The main bacterial phyla are presented in Figure S3. For all the treatments, dominant
392
phyla throughout the incubation were Proteobacteria or Actinobacteria which are common soil
393
phyla detected during bioremediation studies (Fuentes et al., 2014), while in digestate the
394
dominant phyla were Proteobacteria (35.9%) and Aminicenantes (30.0%). In treatments B1
395
and B2, an increase of Verrucomicrobia with time was observed. This phylum is common in
396
soil environments (Bergmann et al., 2011). Verrucomicrobia was already found in minority in
397
hydrocarbon affected soils and the phylum tended to diminish at the end of bioremediation
398
(Ramadass et al., 2018), which suggests its secondary role in PHCs degradation. Aminicenantes
399
and Atribacteria phyla were specific for fresh digestate, and were already detected during
400
anaerobic digestion of sewage sludge (Pan et al., 2019; Zhao et al., 2018). Probably due to
401
anaerobic preferences, representatives of the Atribacteria phylum were not detected after
402
mixing of digestate with soil and application of aeration, while Aminicenantes representatives
403
were detected in samples B4 but their relative proportion decreased with time.
404
In all treatments, except for B4, Proteobacteria dominated over Actinobacteria at the
405
beginning of the treatment, however with time Actinobacteria tended to increase.
406
Actinobacteria is the main phylum observed in oil bioremediation treatments and contains
407
many species recognized as hydrocarbons degraders (Ros et al., 2010). Interestingly, in
408
treatment B4, Actinobacteria was a dominant phylum at the beginning of the experiment which
409
can be explained by previous acclimation of microbial inoculum. This observation suggests that
introduced inoculum was well prepared to degrade hydrocarbons and thus its application
411
allowed to increase process performance.
412
Top genera differed among samples according to treatment and sampling time (Fig. 5). Detailed
413
information about genera and list of identified species are included in supplementary materials
414
(Tables S1 and S2).
415
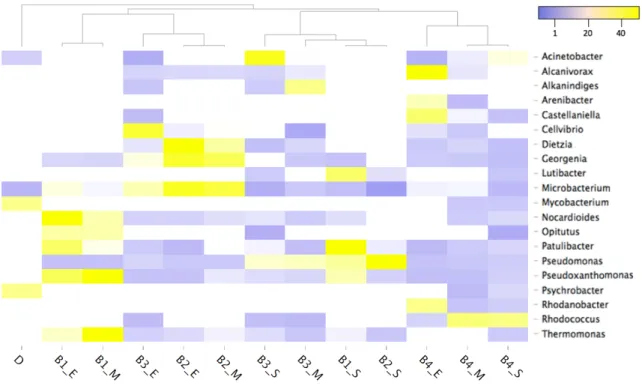
Clustering analysis revealed a distinct bacterial population in digestate and treated soil.
416
Similarities between microbial profiles were initially observed for treatments B1 and B2 (B1_S
417
and B2_S), however in the middle phase of the treatment the two profiles became distinct which
418
suggests that addition of mineral nutrients shaped soil microbial profile. Samples from reactors
419
B4 displayed similar microbial profiles at the beginning and in the middle phase of the treatment
420
(B4_S and B4_M) which could be explain by the applied inoculum microbial populations that
421
were well adapted to degrade PHCs. A slight population shift in treatment B4 occurred at the
422
end of the incubation (B4_E) which was probably a consequence of PHCs depletion.
423
In the control (B1), the most abundant genera at the beginning of the experiment were
424
Pseudomonas (46.8%). Pseudomonas genus is a common soil bacterial taxa and contains many
425
well-known PHCs degrading species (Liu et al., 2011; Reyes-Sosa et al., 2018). After 30 days,
426
the population of Pseudomonas decreased to 1.6% and other species associated with PHCs
427
degradation were promoted including Pseudoxanthomonas, Microbacterium and Nocardioides
428
(Liu et al., 2011; Reyes-Sosa et al., 2018; Yu et al., 2018).
429
In the treatment B2, Pseudomonas were dominant in the first days of the study (90%)
430
and dropped to 4% after 30 days. At the end of the incubation the dominant genera included
431
Microbacterium (24.2%), Cellvibrio (13.6%), Dietzia (12.1%) and Georgenia (6%).
432
Interestingly, most Dietzia affiliated OTUs were assigned to Dietzia maris previously identified
433
as hydrocarbons degrading bacteria (Sutton et al., 2013).
434
In soil amended with digestate (B3), the most common genera at the beginning were
435
Pseudomonas (33%), Acinetobacter (32.3%) and Rhodococcus (12.4%), all of these genera
436
contain species with known ability to degrade PHCs (Liu et al., 2011; Reyes-Sosa et al., 2018;
437
Yu et al., 2018). Interestingly, in the middle part of the process, Alkanindiges reached a peak
438
abundance of 17.5% and almost totally disappeared after the next 30 days (0.2%). Alkanindiges
439
genera contains many PHCs degrading species (Bogan et al., 2003). The increase of
440
Alkanindiges population in the middle part of the treatment may be connected with the phase
of intensive PHCs degradation while decrease at the end of the treatment could be a result of
442
bioavailable hydrocarbons depletion.
443
In case of treatment B4, at the beginning, the dominant genera were Rhodococcus
444
(41.6%) and Acinetobacter (13.1%) associated with PHCs degradation (Liu et al., 2011;
Reyes-445
Sosa et al., 2018; Yu et al., 2018). After 63 days, the relative importance of Rhodococcus
446
decreased to 15.8% and other PHCs degrading genera became dominant including Alcanivorax
447
(21%), Microbacterium (7.6%) and Arenibacter (5%) (Reyes-Sosa et al., 2018). In all
448
treatments amended with digestate, initial richness of genera associated with PHCs degradation
449
and overall diversity measures were higher compared to reactors B1 and B2.
450
It was observed that treatments supplemented with digestate were characterized by more
451
dense and diverse microbial communities compared to treatments with mineral nutrients. It
452
could be a result of the dense digestate microbial population as well as improved soil conditions
453
including increase of soil organic matter, water holding capacity and contaminant dilution,
454
making soil more suitable environment for microbial development (Ren et al., 2018). Not only
455
bacterial taxa directly involved in the metabolism of PHCs were promoted during the study.
456
The relations between different bacterial taxa are not evident and may include symbiosis,
457
cooperation or mutualistic dependences additionally affected by abiotic conditions. Bacterial
458
community composition was initially influenced by digestate addition however it had not
459
crucial effect on the direction of microbial community changes. As mentioned in other studies,
460
the direction of the bacterial community evolution in amended soils does not only depend
461
strictly on the type of organic matter but also on soil type and environmental conditions
(Pérez-462
Piqueres et al., 2006).
464
Figure 5. Heat map illustrating top genera (> 0.2%) based on relative abundance (%). 465
Abbreviations are reported in Table 1. D: digestate; S: day 1; M: day 30; E: day 63. Results are presented 466
as a mean of three samples collected from the same reactor. To show similarities in genera composition 467
between samples Pearson clustering method was employed. 468
Conclusions 469
Application of digestate to a PHCs contaminated soil in lab scale aerated bioreactors
470
has enhanced soil bioremediation potential, as reflected by the higher concentration of alkB
471
genes compared to mineral fertilizer. Digestate supplementation to soil improved activity,
472
density and diversity of total microbial population. Moreover, use of digestate positively
473
affected the density and diversity of bacterial taxa containing PHCs degrading species.
474
Monitoring of the concentration of alkB genes during the treatments reflected the PHCs removal
475
efficiency, which confirms role of alkB genes as biodegradation marker. Future studies could
476
focus on alkB genes diversity in organic fertilizers, the kinetics of functional genes spreading
477
in soil after fertilizer application and fluctuation of functional genes abundance according to
478
the bioavailable contaminant concentration.
479
Acknowledgements 480
This research project has received funding from the European Union's Horizon 2020 research
481
and innovation program under the Marie Skłodowska-Curie grant agreement N 643071.
482
References 483
Abtahi, H., Parhamfar, Milad, Saeedi, R., Villaseñor, J., Sartaj, M., Kumar, V., Coulon, F.,
Parhamfar, Maryam, Didehdar, M., Hamed seifi, Koolivand, A., 2020. Effect of
485
competition between petroleum-degrading bacteria and indigenous compost
486
microorganisms on the efficiency of petroleum sludge bioremediation: Field application
487
of mineral-based culture in the composting process. J. Environ. Manage. 258.
488
https://doi.org/10.1016/j.jenvman.2019.110013
489
Agnello, A.C., Bagard, M., Hullebusch, E.D. Van, Esposito, G., Huguenot, D., 2016.
490
Comparative bioremediation of heavy metals and petroleum hydrocarbons
co-491
contaminated soil by natural attenuation, phytoremediation, bioaugmentation and
492
bioaugmentation-assisted phytoremediation. Sci. Total Environ. 563–564, 693–703.
493
https://doi.org/10.1016/j.scitotenv.2015.10.061
494
Akbari, A., Ghoshal, S., 2014. Pilot-scale bioremediation of a petroleum
hydrocarbon-495
contaminated clayey soil from a sub-Arctic site. J. Hazard. Mater. 280, 595–602.
496
https://doi.org/10.1016/j.jhazmat.2014.08.016
497
Antizar-Ladislao, B., Lopez-Real, J., Beck, A.J., 2006. Bioremediation of polycyclic aromatic
498
hydrocarbons (PAH) in an aged coal-tar-contaminated soil using different in-vessel
499
composting approaches. J. Hazard. Mater. 137, 1583–1588.
500
https://doi.org/10.1016/j.jhazmat.2006.04.056
501
Barra Caracciolo, A., Bustamante, M.A., Nogues, I., Di Lenola, M., Luprano, M.L., Grenni,
502
P., 2015. Changes in microbial community structure and functioning of a semiarid soil
503
due to the use of anaerobic digestate derived composts and rosemary plants. Geoderma
504
245–246, 89–97. https://doi.org/10.1016/j.geoderma.2015.01.021
505
Bergmann, G.T., Bates, S.T., Eilers, K.G., Lauber, C.L., Caporaso, J.G., Walters, W.A.,
506
Knight, R., Fierer, N., 2011. The under-recognized dominance of Verrucomicrobia in
507
soil bacterial communities. Soil Biol. Biochem. 43, 1450–1455.
508
https://doi.org/10.1016/j.soilbio.2011.03.012
509
Biache, C., Oualia, S., Cébron, A., Lorgeoux, C., Colombano, S., Faure, P., 2017.
510
Bioremediation of PAH-contamined soils: Consequences on formation and degradation
511
of polar-polycyclic aromatic compounds and microbial community abundance. J.
512
Hazard. Mater. 329, 1–10. https://doi.org/10.1016/j.jhazmat.2017.01.026
513
Bogan, B.W., Sullivan, W.R., Kayser, K.J., Derr, K.D., Aldrich, H.C., Paterek, J.R., 2003.
Alkanindiges illinoisensis gen. nov., sp. nov., an obligately hydrocarbonoclastic, aerobic
515
squalane-degrading bacterium isolated from oilfield soils. Int. J. Syst. Evol. Microbiol.
516
53, 1389–1395. https://doi.org/10.1099/ijs.0.02568-0
517
Brown, D.M., Okoro, S., van Gils, J., van Spanning, R., Bonte, M., Hutchings, T., Linden, O.,
518
Egbuche, U., Bruun, K.B., Smith, J.W.N., 2017. Comparison of landfarming
519
amendments to improve bioremediation of petroleum hydrocarbons in Niger Delta soils.
520
Sci. Total Environ. 596–597, 284–292. https://doi.org/10.1016/j.scitotenv.2017.04.072
521
Bruckberger, M.C., Bastow, T.P., Morgan, M.J., Gleeson, D., Banning, N., Davis, G., Puzon,
522
G.J., 2018. Biodegradability of polar compounds formed from weathered diesel.
523
Biodegradation. https://doi.org/10.1007/s10532-018-9841-1
524
Cébron, A., Beguiristain, T., Bongoua-Devisme, J., Denonfoux, J., Faure, P., Lorgeoux, C.,
525
Ouvrard, S., Parisot, N., Peyret, P., Leyval, C., 2015. Impact of clay mineral, wood
526
sawdust or root organic matter on the bacterial and fungal community structures in two
527
aged PAH-contaminated soils. Environ. Sci. Pollut. Res. 22, 13724–13738.
528
https://doi.org/10.1007/s11356-015-4117-3
529
Cébron, A., Norini, M.P., Beguiristain, T., Leyval, C., 2008. Real-Time PCR quantification of
530
PAH-ring hydroxylating dioxygenase (PAH-RHDα) genes from Gram positive and
531
Gram negative bacteria in soil and sediment samples. J. Microbiol. Methods 73, 148–
532
159. https://doi.org/10.1016/j.mimet.2008.01.009
533
Cerqueira, V.S., Peralba, M. do C.R., Camargo, F.A.O., Bento, F.M., 2014. Comparison of
534
bioremediation strategies for soil impacted with petrochemical oily sludge. Int.
535
Biodeterior. Biodegrad. 95, 338–345. https://doi.org/10.1016/j.ibiod.2014.08.015
536
Dados, A., Omirou, M., Demetriou, K., Papastephanou, C., Ioannides, I.M., 2014. Rapid
537
remediation of soil heavily contaminated with hydrocarbons: a comparison of different
538
approaches. Ann. Microbiol. 241–251. https://doi.org/10.1007/s13213-014-0856-5
539
Felske, A., Akkermans, A.D.L., De Vos, W.M., 1998. Quantification of 16S rRNAs in
540
complex bacterial communities by multiple competitive reverse transcription-PCR in
541
temperature gradient gel electrophoresis fingerprints. Appl. Environ. Microbiol. 64,
542
4581–4587.
543
Fuentes, S., Méndez, V., Aguila, P., Seeger, M., 2014. Bioremediation of petroleum
hydrocarbons: Catabolic genes, microbial communities, and applications. Appl.
545
Microbiol. Biotechnol. 98, 4781–4794. https://doi.org/10.1007/s00253-014-5684-9
546
Gargouri, B., Karray, F., Mhiri, N., Aloui, F., Sayadi, S., 2014. Bioremediation of petroleum
547
hydrocarbons-contaminated soil by bacterial consortium isolated from an industrial
548
wastewater treatment plant. J. Chem. Technol. Biotechnol. 89, 978–987.
549
https://doi.org/10.1002/jctb.4188
550
Gielnik, A., Pechaud, Y., Huguenot, D., Riom, J.-M., Guibaud, G., Esposito, G., van
551
Hullebusch, E.D., 2018. Effect of digestate application on microbial respiration and
552
bacterial communities during bioremediation of petroleum hydrocarbons contaminated
553
weathered soils. Sci. Total Environ. In revision.
554
Gómez-brandón, M., Juárez, M.F., Zangerle, M., 2016. Effects of digestate on soil chemical
555
and microbiological properties : A comparative study with compost and vermicompost.
556
J. Hazard. Mater. 302, 267–274. https://doi.org/10.1016/j.jhazmat.2015.09.067
557
Graj, W., Lisiecki, P., Szulc, A., Chrzanowski, Ł., Wojtera-Kwiczor, J., 2013.
558
Bioaugmentation with petroleum-degrading consortia has a selective growth-promoting
559
impact on crop plants germinated in diesel oil-contaminated soil. Water. Air. Soil Pollut.
560
224. https://doi.org/10.1007/s11270-013-1676-0
561
Kästner, M., Nowak, K.M., Miltner, A., Trapp, S., Schäffer, A., 2014. Classification and
562
modelling of nonextractable residue (NER) formation of xenobiotics in soil – A
563
synthesis. Crit. Rev. Environ. Sci. Technol. 44, 2107–2171.
564
https://doi.org/10.1080/10643389.2013.828270
565
Kataki, S., Hazarika, S., Baruah, D.C., 2017. Assessment of by-products of bioenergy systems
566
(anaerobic digestion and gasification) as potential crop nutrient. Waste Manag. J. 59,
567
102–117. https://doi.org/10.1016/j.jenvman.2017.02.058
568
Khudur, L.S., Shahsavari, E., Miranda, A.F., Morrison, P.D., Nugegoda, D., Ball, A.S., 2015.
569
Evaluating the efficacy of bioremediating a diesel-contaminated soil using
570
ecotoxicological and bacterial community indices. Environ. Sci. Pollut. Res. 22, 14809–
571
14819. https://doi.org/10.1007/s11356-015-4624-2
572
Liu, C., Wang, W., Wu, Y., Zhou, Z., Lai, Q., Shao, Z., 2011. Multiple alkane hydroxylase
573
systems in a marine alkane degrader, Alcanivorax dieselolei B-5. Environ. Microbiol. 13,
1168–1178. https://doi.org/10.1111/j.1462-2920.2010.02416.x
575
Lu, L., Yazdi, H., Jin, S., Zuo, Y., Fallgren, P.H., Ren, Z.J., 2014. Enhanced bioremediation
576
of hydrocarbon-contaminated soil using pilot-scale bioelectrochemical systems. J.
577
Hazard. Mater. 274, 8–15. https://doi.org/10.1016/j.jhazmat.2014.03.060
578
Maila, M.P., Cloete, T.E., 2005. The use of biological activities to monitor the removal of fuel
579
contaminants—perspective for monitoring hydrocarbon contamination: a review. Int.
580
Biodeterior. Biodegradation 55, 1–8. https://doi.org/10.1016/j.ibiod.2004.10.003
581
Mao, D., Lookman, R., Weghe, H.V.D., Weltens, R., Vanermen, G., Brucker, N.D., Diels, L.,
582
2009. Estimation of ecotoxicity of petroleum hydrocarbon mixtures in soil based on
583
HPLC-GCXGC analysis. Chemosphere 77, 1508–1513.
584
https://doi.org/10.1016/j.chemosphere.2009.10.004
585
Masy, T., Demanèche, S., Tromme, O., Thonart, P., Jacques, P., Hiligsmann, S., Vogel, T.M.,
586
2016. Hydrocarbon biostimulation and bioaugmentation in organic carbon and clay-rich
587
soils. Soil Biol. Biochem. 99, 66–74. https://doi.org/10.1016/j.soilbio.2016.04.016
588
Megharaj, M., Ramakrishnan, B., Venkateswarlu, K., Sethunathan, N., Naidu, R., 2011.
589
Bioremediation approaches for organic pollutants: A critical perspective. Environ. Int.
590
37, 1362–1375. https://doi.org/10.1016/j.envint.2011.06.003
591
Mrozik, A., Piotrowska-Seget, Z., 2010. Bioaugmentation as a strategy for cleaning up of
592
soils contaminated with aromatic compounds. Microbiol. Res. 165, 363–375.
593
https://doi.org/10.1016/j.micres.2009.08.001
594
Namkoong, W., Hwang, E.Y., Park, J.S., Choi, J.Y., 2002. Bioremediation of
diesel-595
contaminated soil with composting. Environ. Pollut. 119, 23–31.
596
https://doi.org/10.1016/S0269-7491(01)00328-1
597
Nwankwegu, A.S., Orji, M.U., Onwosi, C.O., 2016. Studies on organic and in-organic
598
biostimulants in bioremediation of diesel-contaminated arable soil. Chemosphere 162,
599
148–156. https://doi.org/10.1016/j.chemosphere.2016.07.074
600
Osei-Twumasi, D., Fei-Baffoe, B., Anning, A.K., Danquah, K.O., 2020. Synergistic effects of
601
compost, cow bile and bacterial culture on bioremediation of hydrocarbon-contaminated
602
drill mud waste. Environ. Pollut. 266. https://doi.org/10.1016/j.envpol.2020.115202
Pan, X., Lv, N., Li, C., Ning, J., Wang, T., Wang, R., 2019. Impact of nano zero valent iron
604
on tetracycline degradation and microbial community succession during anaerobic
605
digestion. Chem. Eng. J. 359, 662–671. https://doi.org/10.1016/j.cej.2018.11.135
606
Pérez-Piqueres, A., Edel-Hermann, V., Alabouvette, C., Steinberg, C., 2006. Response of soil
607
microbial communities to compost amendments. Soil Biol. Biochem. 38, 460–470.
608
https://doi.org/10.1016/j.soilbio.2005.05.025
609
Powell, S.M., Ferguson, S.H., Bowman, J.P., Snape, I., 2006. Using Real-Time PCR to
610
Assess Changes in the Hydrocarbon-Degrading Microbial Community in Antarctic Soil
611
During Bioremediation 52, 523–532. https://doi.org/10.1007/s00248-006-9131-z
612
Ramadass, K., Megharaj, M., Venkateswarlu, K., Naidu, R., 2018. Bioavailability of
613
weathered hydrocarbons in engine oil-contaminated soil : Impact of bioaugmentation
614
mediated by Pseudomonas spp . on bioremediation. Sci. Total Environ. 636, 968–974.
615
https://doi.org/10.1016/j.scitotenv.2018.04.379
616
Reyes-Sosa, M.B., Apodaca-Hernández, J.E., Arena-Ortiz, M.L., 2018. Bioprospecting for
617
microbes with potential hydrocarbon remediation activity on the northwest coast of the
618
Yucatan Peninsula, Mexico, using DNA sequencing. Sci. Total Environ. 642, 1060–
619
1074. https://doi.org/10.1016/j.scitotenv.2018.06.097
620
Ros, M., Rodríguez, I., García, C., Hernández, T., 2010. Microbial communities involved in
621
the bioremediation of an aged recalcitrant hydrocarbon polluted soil by using organic
622
amendments. Bioresour. Technol. 101, 6916–6923.
623
https://doi.org/10.1016/j.biortech.2010.03.126
624
Safdari, M.S., Kariminia, H.R., Rahmati, M., Fazlollahi, F., Polasko, A., Mahendra, S.,
625
Wilding, W.V., Fletcher, T.H., 2018. Development of bioreactors for comparative study
626
of natural attenuation, biostimulation, and bioaugmentation of petroleum-hydrocarbon
627
contaminated soil. J. Hazard. Mater. 342, 270–278.
628
https://doi.org/10.1016/j.jhazmat.2017.08.044
629
Sayara, T., Sarrà, M., Sánchez, A., 2010. Effects of compost stability and contaminant
630
concentration on the bioremediation of PAHs-contaminated soil through composting. J.
631
Hazard. Mater. 179, 999–1006. https://doi.org/10.1016/j.jhazmat.2010.03.104
632
Shahi, A., Aydin, S., Ince, B., Ince, O., 2016. Evaluation of microbial population and
functional genes during the bioremediation of petroleum-contaminated soil as an
634
effective monitoring approach. Ecotoxicol. Environ. Saf. 125, 153–160.
635
https://doi.org/10.1016/j.ecoenv.2015.11.029
636
Smit, E., Leeflang, P., Glandorf, B., Van Elsas, J.D., Wernars, K., Analysis, 1999. Analysis of
637
fungal diversity in the wheat rhizosphere by sequencing of cloned PCR-amplified genes
638
encoding 18S rRNA and temperature gradient gel electrophoresis. Appl. Environ.
639
Microbiol. 65, 2614–2621.
640
Sutton, N.B., van Gaans, P., Langenhoff, A.A.M., Maphosa, F., Smidt, H., Grotenhuis, T.,
641
Rijnaarts, H.H.M., 2013. Biodegradation of aged diesel in diverse soil matrixes: Impact
642
of environmental conditions and bioavailability on microbial remediation capacity.
643
Biodegradation 24, 487–498. https://doi.org/10.1007/s10532-012-9605-2
644
Tahhan, R.A., Abu-Ateih, R.Y., 2009. Biodegradation of petroleum industry oily-sludge
645
using Jordanian oil refinery contaminated soil. Int. Biodeterior. Biodegrad. 63, 1054–
646
1060. https://doi.org/10.1016/j.ibiod.2009.09.001
647
Tambone, F., Terruzzi, L., Scaglia, B., Adani, F., 2015. Composting of the solid fraction of
648
digestate derived from pig slurry: Biological processes and compost properties. Waste
649
Manag. 35, 55–61. https://doi.org/10.1016/j.wasman.2014.10.014
650
USEPA, 2007. Method 3550C: Ultrasonic Extraction, Test Methods for Evaluating Solid
651
Waste, Physical/Chemical Methods. U.S. Environ. Prot. Agency.
652
USEPA, 1996. SW-846: Nonhalongenated Organics Using GC/FID. Test Methods for
653
Evaluating Solid Waste, Physical/Chemical Methods. U.S. Environ. Prot. Agency.
654
https://doi.org/10.1016/j.jmgm.2005.11.005
655
Vainio, E.J., Hantula, J., 2000. Direct analysis of wood-inhabiting fungi using denaturing
656
gradient gel electrophoresis of amplified ribosomal DNA. Mycol. Res. 104, 927–936.
657
https://doi.org/10.1017/S0953756200002471
658
Wongrod, S., Simon, S., Guibaud, G., Lens, P.N.L., Pechaud, Y., Huguenot, D., van
659
Hullebusch, E.D., 2018. Lead sorption by biochar produced from digestates:
660
Consequences of chemical modification and washing. J. Environ. Manage. 219, 277–
661
284. https://doi.org/10.1016/j.jenvman.2018.04.108
Xi, B., Dang, Q., Wei, Y., Li, X., Zheng, Y., Zhao, X., 2020. Biogas slurry as an activator for
663
the remediation of petroleum contaminated soils through composting mediated by humic
664
acid. Sci. Total Environ. 730, 139117. https://doi.org/10.1016/j.scitotenv.2020.139117
665
Xu, Y., Lu, M., 2010a. Bioremediation of crude oil-contaminated soil : Comparison of
666
different biostimulation and bioaugmentation treatments. J. Hazard. Mater. 183, 395–
667
401. https://doi.org/10.1016/j.jhazmat.2010.07.038
668
Xu, Y., Lu, M., 2010b. Bioremediation of crude oil-contaminated soil: Comparison of
669
different biostimulation and bioaugmentation treatments. J. Hazard. Mater. 183, 395–
670
401. https://doi.org/10.1016/j.jhazmat.2010.07.038
671
Yu, X., Lee, K., Ma, B., Asiedu, E., Ulrich, A.C., 2018. Chemosphere Indigenous
672
microorganisms residing in oil sands tailings biodegrade residual bitumen. Chemosphere
673
209, 551–559. https://doi.org/10.1016/j.chemosphere.2018.06.126
674
Zhao, L., Ji, Y., Sun, P., Li, R., Xiang, F., Wang, H., Ruiz-martinez, J., 2018. Effects of
675
individual and complex ciprofloxacin, fullerene C60, and ZnO nanoparticles on sludge
676
digestion : Methane production, metabolism, and microbial community. Bioresour.
677
Technol. 267, 46–53. https://doi.org/10.1016/j.biortech.2018.07.024
678
679
681
Supplementary materials
682683
Functional potential of sewage sludge digestate microbes to degrade
684aliphatic hydrocarbons during bioremediation of a petroleum
685hydrocarbons contaminated soil
686Anna Gielnik 1,2, Yoan Pechaud 1, David Huguenot 1, Aurélie Cébron 3, Giovanni Esposito 2, Eric D. 687
van Hullebusch 4,5 688
1Université Paris-Est, Laboratoire Géomatériaux et Environnement (LGE), EA 4508, UPEM, 77454 689
Marne-la-Vallée, France 690
2University of Napoli “Federico II”, Department of Civil, Architectural and Environmental 691
Engineering, 80125 Napoli, Italy 692
3Université de Lorraine, CNRS, LIEC, F-54000 Nancy, France 693
4IHE Delft Institute for Water Education, Department of Environmental Engineering and Water 694
Technology, P.O. Box 3015, 2601 DA, Delft, The Netherlands 695
5Université de Paris, Institut de physique du globe de Paris, CNRS, F-75005 Paris, France 696
698
Figure S1. GC-FID chromatogram presenting PHCs concentration before (red) and after (blue) 699
63 days of treatment under conditions B3. 700
701
702
Figure S2. Bacterial and fungal abundance during the treatments represented by 16S and 18S 703
rRNA genes copy number. Abbreviations are reported in Table 1. D: digestate. Results are presented 704
as an average value of three samples collected from the same reactor with standard deviation.Values 705
that are annotated with different letter among one gene class and sampling time are significantly 706
different (ANOVA p < 0.05 and Tukey's multiple range test). 707
708
709
Figure S3. Relative abundance of main bacterial phyla in tested treatments during three 710
sampling time points and in digestate. Abbreviations are reported in Table 1. D: digestate; S: day 1; 711
M: day 30; E: day 63. Results are presented as a mean of three samples collected from the same 712
reactor with standard deviation. 713