HAL Id: hal-02095865
https://hal.univ-lorraine.fr/hal-02095865
Submitted on 30 Apr 2019HAL is a multi-disciplinary open access archive for the deposit and dissemination of sci-entific research documents, whether they are pub-lished or not. The documents may come from teaching and research institutions in France or abroad, or from public or private research centers.
L’archive ouverte pluridisciplinaire HAL, est destinée au dépôt et à la diffusion de documents scientifiques de niveau recherche, publiés ou non, émanant des établissements d’enseignement et de recherche français ou étrangers, des laboratoires publics ou privés.
Decoding the Time-Dependent Response of
Bioluminescent Metal-Detecting Whole-Cell Bacterial
Sensors
Jérôme F.L. Duval, Christophe Pagnout
To cite this version:
Jérôme F.L. Duval, Christophe Pagnout. Decoding the Time-Dependent Response of Bioluminescent Metal-Detecting Whole-Cell Bacterial Sensors. ACS Sensors, American Chemical Society, 2020, 309, pp.article 127751. �10.1021/acssensors.9b00349�. �hal-02095865�
Decoding the Time-Dependent Response of
Bioluminescent Metal-Detecting Whole-Cell Bacterial Sensors
Jérôme F.L. Duval,
1,Christophe Pagnout
21 Université de Lorraine, CNRS, LIEC (Laboratoire Interdisciplinaire des Environnements Continentaux), UMR7360, Vandoeuvre-lès-Nancy F-54501, France.
2 Université de Lorraine, CNRS, LIEC, UMR7360, Campus Bridoux, Metz F-57070, France. Corresponding author: [email protected]
Abstract.
The signal produced by aqueous dispersions of bioluminescent, metal-responsive whole-cell bacterial sensors is indicative of the concentration of bioavailable metal ions in solution. The conventional calibration-based strategy followed for measuring this concentration is however inadequate to provide any quantitative prediction of the cells response over time as a function of e.g. their growth features, their defining metal accumulation properties, or the physicochemical medium composition. Such an evaluation is still critically needed for assessing on a mechanistic level the performance of biosensors in terms of metal bioavailability and toxicity monitoring. Herein we report a comprehensive formalism unraveling how the dependence of bioluminescence on time is governed by the dynamics of metal biouptake, by the activation kinetics of lux-based reporter gene, by the ensuing rate of luciferase production, the kinetics of light emission and quenching. It is shown that bioluminescence signal corresponds to the convolution product between two time-dependent functions, one detailing the dynamic interplay of the above micro- and nanoscale processes, and the other pertaining to the change in concentration of photoactive cell sensors over time. Numerical computations illustrate how the shape and magnitude of the bioluminescence peak(s) are intimately connected to the dependence of the photoactive cells concentration on time and to the magnitudes of Deborah numbers that compare the relevant timescales of the biointerfacial and intracellular events controlling light emission. Explicit analytical expressions are further derived for practical situations where bioluminescence is proportional to the concentration of metal ions in solution. The theory is further quantitatively supported by experiments performed on luminescent cadmium-responsive lux-based Escherichia coli biosensors.
Keywords. Whole-cell bacterial sensors, Bioluminescence, Time-dependent response, Dynamics, Metal biouptake, Luciferase, Quenching.
In a context where anthropogenic activities lead to significant contamination of natural aquatic environments, efficient ecosystem management strategies requires suitable devices to detect trace pollutants such as metals in aqueous solutions.1 Conventional physicochemical methods adopted for that purpose (e.g. spectrometry, conductivity, complexometry) often suffer from the complexity of sample preparation protocols, from interference effects associated with the aqueous matrix containing the element to be measured, or the impossibility to assess the bioavailable metal fraction, which is however essential for a proper estimate of toxicity effects on biota.2-6 In order to develop reliable methods for a fine monitoring of metals bioavailability and toxicity, the scientific community has resorted to solutions derived from biotechnologies, such as whole-cell microbial biosensors.7-10 The latter correspond to genetically modified microorganisms that emit a measurable physical or (electro)chemical signal in the presence of the target metal analyte.7-13 Genetic constructions are all based on the same principle and are strongly inspired by bacterial mechanisms of metal homeostasis.7 Reporter genes, introduced e.g. in the form of plasmids, are fused to a promoter whose expression is regulated by a regulatory (or repressor) protein that has a strong affinity with the metal element to be detected (Figure 1). In the absence of this element, the expression of reporter genes is repressed by the repressor attached to the promoter. Inactivation of the repressor occurs when the latter forms a complex with the metal ion, thus allowing the expression of reporter genes and the production of so-called reporter proteins (e.g. GFP or luciferase) at the origin of the measured signal (e.g. fluorescence or luminescence).7,8 Many so-constructed whole-cell bacterial sensors are listed in the literature12-18 with detection limits from a few nM to ten µM.
The response of bacterial metal sensors over time depends on the intracellular concentration of the target metal and, more generically, on the dynamics of the processes that determine the partition of metals at the interphase between the biosensor and the extracellular medium.18 Depending on the bacterial systems considered and on medium composition, these processes include the reactive transfer of metals from the solution to the biosurface (e.g. their speciation),3,18-20 their passive biosorption,18 their internalization and bioaccumulation,21,22 or their excretion via efflux pumps.22 The biosensor signal is further intimately determined by the production rate of reporter proteins, which necessarily depends on the efficiency with which the transcription of reporter genes is activated by the metal ion-repressor protein complex.18,23-25 The physiology of cell sensors is an additional factor controlling their ability to produce light, and any interfering toxic effects generated by the metal species shall necessarily impact their response. These elements illustrate the complexity of the signal emitted by metal-responsive whole-cell bacterial sensors, the time dependence and magnitude of which are inherently mediated by interrelated extracellular, biointerfacial and intracellular bio-physicochemical processes. The ensuing lack of predictability of biosensor signals probably explains why this technology has met a limited number of
commercial achievementsfor environmental monitoring26,27 and why testing in natural aquatic media still remains scarce.12,17
Further efforts are thus required to rationalize whole-cell bacterial sensors signals on mechanistic and quantitative levels. The models developed for that purpose mainly rely on systems of differential equations that translate the coupling between kinetics of the successive steps leading to e.g. fluorescence or luminescence emission.18,23,28-31 As correctly argued in Ref. [23] where focus is given to bioluminescence, these models generally differ in their degree of sophistication for representing the various molecular determinants that control bioluminescence reaction and catalysis thereof, and thus in their number of introduced parameters, some of them remaining difficult -if not impossible- to measure under realistic sensors exposition conditions. With some exceptions,18 most of these approaches have in common that they further discard the complexity of the physicochemical processes governing the bioavailability of the target analyte at the biosensors/solution interface. The impact of cell growth on biosensors response is further sometimes incorrectly formulated by introduction of a simple proportionality factor in theoretical expressions of bioluminescence,24 which contrasts with the non-linearity recently invoked in the noticeable work by Delle Side et al.23 In line with the nature of the bio-system they considered, these authors did not account for the possible exchange fluxes of the molecules triggering light production, between cells and external medium. This aspect is however critical for proper assessment of the luminescence emitted by metal-responsive whole-cell biosensors.18
In view of the above elements, we report herein a conceptual framework allowing a full integration of the dynamic coupling between (i) the processes that regulate the partitioning of metals at the interphase between aqueous medium and luminescent metal-responsive whole-cell bacterial sensors, (ii) the formation of metal-repressor protein complex, which initiates reporter gene expression, (iii) the production of luciferase and the ensuing light emission and quenching, and finally (iv) the processes leading to time variations in concentration of photoactive cells. Illustrative numerical computations, supported by tractable analytical developments, decipher the impact of each of the above process on the bioluminescence response. Implications for bioluminescence data interpretation are further discussed, and analysis of the bioluminescence response of cadmium-detecting lux-based Escherichia coli biosensors supports theory.
THEORY
Setting the stage. In the following developments, we consider a dispersion of genetically-engineered (lux operon-based7,32) bacteria that produce light after their accumulation of metal ions (M for short) present in solution at bulk concentration denoted as
c
M (mol m-3). Depending on solution composition and on the amount of available nutrients therein, the numberN
of photoactive metal-responsive bacteria may varywith time t due to cell growth, to inactivation of some of the biosensors or to metal-induced toxicity effects. Accordingly, we define the time-dependent concentration c tp
(m-3) of photoactive cells by
p / T
c t N t V with
V
T the volume of the dispersing medium, and t0 the initial time referring to the introduction of M in the biosensors dispersion (Figure 1A). For the sake of demonstration, we consider practical situations where metal speciation in solution is not significant18,33 and metal depletion from bulk solution as a result of metal bioaccumulation is absent, which ensures thatc
M does not depend on time.34 In line with standard experimental conditions, the cell dispersion is sufficiently dilute to ignore possible overlap of metal diffusion layers and electric double layers developed around the (negatively charged35) cells.18,22,34 The bioluminescence produced at t by the metal-sensing whole-cell bacterial sensors is hereafter denoted as um t
(expressed in counts s-1 or photons s-1). The cascade of events leading to photons emission by such biosystems includes (Figures 1B,C): (a) the conductive diffusion of M from bulk solution to the charged bacterial surface, followed by M internalization and possible excretion via efflux pumps,18,22,34,36,37 (b) M binding to the regulatory (repressor) proteins denoted as Preg (e.g. ZntR),7,18,38,39 (c) interaction of the formed metal-repressor protein complex, MP
reg, with a promoter placed upstream the (lux-based) reporter gene, which in turn initiates gene transcription and leads to the production of the reporter protein luciferase that plays a central role in catalyzed bioluminescent reaction,7,32 (d) the subsequent emission of photons (h
490 nm) and light quenching.23 The two following sections detail the theoretical formulations of processes (a)-(b) and (c)-(d), respectively. A glossary of symbols is given in Supporting Information.Partitioning dynamics of metal ions at the cell sensor/solution interface. The concentration of bioavailable M, hereafter denoted as cM,f , refers to the fraction of metal ions that can be uptaken by the cell sensors. In the absence of significant metal speciation in solution, cM,f may differ from
c
M due to rapid adsorption of M at (passive) cell surface sites.18 The latter process does not lead to metal biouptake, unlike the adsorption of M at dedicated metal transporter sites.40 In the practical limit of linear Henry passive biosorption of M, cM,f is related toc
M via18
M,f / M 1 a a H pˆ
c t c
S K c t (1), where Sa 4a2 is the surface area of an individual biosensor assimilated to a sphere of radius a. K ˆH (m) in eq 1 is the Henry coefficient associated to M passive biosorption, and a corresponds to the dimensionless Boltzmann accumulation factor of M at the charged cell envelope. This factor depends on the electrostatic cell surface properties, on solution ionic strength and pH18 and it can be evaluated from
cell electrophoretic mobility measurements and proper interpretation thereof.18,35,41 Metal biouptake proceeds here according to Michaelis-Menten mechanism,42 which corresponds to a fast langmuirian adsorption of M at the active transporter sites located at the membrane surface, followed by a first-order rate-limiting internalisation step with kinetic constant kint.18,22,34,36,40,43 The corresponding biouptake flux
u
J (mol m-2 s-1) is then defined by Ju
t /JucMa
t /
KMcMa
t
where JuK kH int MK is the maximum achievable M uptake flux (mol m-2 s-1), KM (mol m-3) the reciprocal of the M affinity for the transporter sites, KH (m) the corresponding Henry adsorption coefficient, and cMa
t is the M concentration at the membrane surface at t (Figure 1C). Under steady-state metal transport condition achieved within ms timescale for microorganisms,18,22,34,36,37 the flux
u
J t satisfies at any t 22,34
u diff e M
J t J t k t (2)
, where Jdiff (mol m-2 s-1) is the metal diffusion flux from solution to the membrane surface, and ke M represents the excretion flux of intracellular M40 with
e
k (s-1) the excretion kinetic constant and M(mol m-2) the intracellular concentration of M expressed per unit cell surface area (Figure 1C). Solving for the steady-state Nernst-Planck equation, the flux Jdiff is written Jdiff
t f Del M
cM,f
t a1caM
t
/a ,22,34 withM
D the diffusion coefficient of M in solution. The dimensionless factor fel corrects the rate of M diffusion for interfacial cell electrostatics and for the presence of any peripheral soft bio-layer that potentially acts as a barrier against metal diffusion.22,34,44 For microorganisms devoid of such a layer, we have fel1 under solution ionic strength conditions of practical interest (typically 1 mM to 100 mM).44
Substituting the expressions of Jdiff and Ju into eq 2, it is shown that Ju is provided by eq 2 with
diff
J t defined by (details in Supporting Information, SI-1)
1/2 1 e M 1 e M u M,f M,f u diff 1 2 u M,f 1 e M u M,f M,f 1 4 1 1 1 1 1 1 1 2 1 1 1 k t k t Bn Bn J c t c t J J t J Bn c t k t Bn J c t c t . (3)Equation 3 involves the dimensionless concentration cM,f
acM,f /KM of bioavailable M in solution that is related to the dimensionless total M concentration cM acM /KM via
M,f / M 1 ads p
c t c
c t (see eq 1) where
ads
a a H pS K cˆ max is the dimensionless scalar quantifying the passive metal biosorption process in the linear Henry regime, and cp
t cp
t /cpmax is the normalized concentration of photoactive cells with cpmax the maximum photoactive cells concentration in the investigated time range. Bn in eq 3 corresponds to the dimensionless bioavailabilitynumber Bn=
(
DM,out elf a-1)
/(
kint H aK b)
corrected for cell surface electrostatics.22,34 The extremes 1/Bn <<1 and 1/Bn >>1 correspond to situations where the rate of metal biouptake is determined by the kinetics of M internalization (as assumed within the conventional Biotic Ligand Model45) and by the diffusive transport of M to the biosurface, respectively.22,34 In the absence of M excretion and for insignificant passive biosorption of M (cM,f
t cM ), the dimensionless flux Ju Ju /Ju identifieswith Jdiff /Ju and becomes independent of time. It first increases linearly with cM (slope 1 / 1 Bn
1
, details in SI-1), then gradually levels off until it reaches unity at cM , which corresponds to 1 saturation of all metal transporter sites.Assuming that regulatory proteins Preg exhibit the strongest metal binding capacity among all other intracellular M chelators, as verified for other metalloproteins,37 the concentration
M t of internalized M verifies (Figures 1B,C)
i
M p u e M p a s M p d c p d d V t c t J t k t c t k t c t k t c t t (4), where Ju
t is defined by eqs 2-3, ka (mol-1 m3 s-1) and kd (s-1) are the kinetic constants for the formation and dissociation of the metal-regulatory protein complexes MPreg, respectively. sVi (mol m-3)in eq 4 pertains to the concentration of metal-binding sites carried by the proteins Preg and smeared-out over the volume Vi4a3/ 3, while c
t (mol m-2) represents the intracellular concentration of MPreg complexes expressed per unit cell surface area. The counterpart of eq 4 for chemodynamics of MPreg complexes reads as c
p i
a s M p d c p d d V t c t k t c t k t c t t . (5)Kinetics of luciferase production and expression of ensuing bioluminescence. Luciferase production sets in after activation of the reporter gene that follows the interaction between promoter and metal-regulatory protein complexes (Figures 1B,C). The corresponding luciferase production flux generated by the assembly of biosensors in the dispersion volume VT may be formulated according to
Luc p c a p a f r a Luc p Hi c a p d d n n n t c t t S c t S k k S t c t t K t S c t (6), where Luc
t (mol m-2) is the intracellular concentration of luciferase at t per unit cell surface area, kf (mol m-3 s-1) andr
k (s-1) the kinetic constants for luciferase production and degradation, respectively. The half-life 1/kr of the luciferase enzyme reflects the activity performance of luciferase in the bioluminescence reaction. The rate of change in luciferase concentration over time is here described by
the Hill function
c a p Hi c a p n n n t S c t K t S c t ,25 classically used to model regulation of gene expression by
chemicals (here the MPreg complexes). In this function, the Hill constant KHi (mol m-3) relates to the dissociation constant between promoter and MPreg complex and may be viewed as the concentration of MPreg at which half of the reporter genes are ‘switched on’. The Hill cooperative binding coefficient
0n reflects the possible increase (n ) or decrease (1 n ) of the binding affinity of MP1 reg for the promoter as the concentration of available ligands is reduced.25
The number of luciferase molecules produced in the volume VT within an infinitesimal time delay
d is a Td Luc
p d d c S V . Following the original idea by Delle Side et al.,23 the existence of luminescence quenching (i.e. a loss of signal over time18,23) implies that the number of photons-emitting luciferase molecules at t is generally lower than that at td . Denoting as q t
, the function that quantifies the decrease in the amount of photoactive luciferase at t as compared to that at
, the t luminescence generated by the ensemble of metal-responsive whole-cell sensors at t is provided by23
Luc
p a T 0 d um , d d t c t k S V q t
(7), where k (counts s-1 mol-1) is the kinetic constant for photons production per mole of luciferase molecules. To further proceed, we adopt a tractable rectangular expression for q t
, 23 written here interms of the Heaviside function
, 0 for 0 1 for 0 t H t t according to q t
, H t
, H t
, q
with q the characteristic quenching timescale. This form of q states that the luciferase molecules produced at time
remain photoactive within the time interval [
; ] and their photoactivity drops q to 0 for t . q 23 In turn, eq 7 becomes
a T Luc
p
q Luc q
p q
um t k S V t c t H t, t c t
(8)
, where the condition um
t0
0 is adopted, consistent with our choice of boundaries
M 0 c 0 Luc 0 0
. The set of coupled eqs 4-6 and 8 fully defines the time-dependent concentrations M
t , c
t , Luc
t and the corresponding bioluminescence um t
. After some algebra, eqs 4-6 and 8 may be written in the convenient dimensionless forms detailed in SI-1 (eqs S4-S7) after introduction of the following key dimensionless quantities: (i) the dimensionless time t t/a with
i
a 1 / ka sV
the characteristic timescale for association of intracellular M with the regulatory protein
Preg, (ii) the dimensionless concentration of intracellular M defined by
1
M t Ju a M t cp t
,
(iii) the dimensionless concentration of MPreg complex given by
1 c t Ju d c t cp t with d 1 / kd
the dissociation timescale of a complex, (iv) the dimensionless stability constant K d/ a of
MPreg complex, and (v) the dimensionless concentration of luciferase,
a pmax Hi
Luc Luc p f a n S c K t t c t k , which involves the dimensionless Hill stability constant KHi
defined by KHi KHi/
Ju a KS ca pmax
. Unless otherwise stated, for given time-dependent concentration
p
c t of photoactive cells, for prescribed features of M biouptake and passive biosorption (i.e. at fixed
1
Bn , KM, Ju and ads), for given n , K , KHi and fixed values of the Deborah numbers ke a , kr a and q/ a, the dimensionless forms of eqs 4-6 and 8 were solved in Mathcad 15 calculus environment using an hybrid solver based on either Adams or backward differentiation methods depending on the stiffness of the set of differential equations.46,47 Convergency of the numerical results was systematically verified by comparison with predictions from the analytical developments elaborated in the next section under metal concentration conditions of practical interest.
Explicit analytical expressions for the bioluminescence.
In the linear Henry metal biouptake regime, the bioavailable metal concentration in solution is so low that the condition cM,f 1 is verified. In this regime, and further assuming that passive biosorption of
M is not significant (i.e. ads ), the time-dependent bioluminescence 0 um t
is defined by the combination of eqs S7, S10 and S14 derived in SI-2. The linear Hill regime corresponds to metal concentrations sufficiently low for the production rate of luciferase to increase linearly with . This c latter regime is achieved for bio-systems defined by the absence of Hill binding cooperativity (i.e. n1 )23,48 and pending the condition
c t /KHi 1
is satisfied. For metal concentrations in line with both linear Henry metal biouptake and linear Hill regimes, the expression of the bioluminescence emitted by the assembly of N biosensors in the limit ads reduces to (details in SI-3) 0
q a q q p p a 0 a um , d t t g t c t H t g t c
(9), where k V k T f a /KHi (counts s-1), the symbol is the convolution product operator, and g is the time-dependent dimensionless function defined by
1 1 2 u,0 r a r a r a 1 1 2 r a r a 2 1 e 1 1 1 2 2 1 1 2 2 1 e 1 e 1 1 2 K x t K K x t K J x g t k K x x K x k k x k k K x
kr a t 1
. (10) , with xke a
/ 1
Bn1
,
2 1 1 4 1 2 1 1 x K Kx K x K and Ju,0 the dimensionless metal
bioaccumulation flux Ju,0cM / 1
Bn1
. The latter necessarily verifies Ju,0 in the linear Henry 1 biouptake regime where the coverage degree of active transporter sites by M is very low. The function g provides a rationale for the non-linear coupling between dynamics of M partitioning at the interface formed between each photoactive cell sensor and the medium, and dynamics of intracellular processes leading to light emission (Figure 1C). The first term between brackets in eq 9 further highlights that the time dependence of the bioluminescence produced by the whole assembly of biosensors results from thenon-linear interplay (convolution product) beween intertwined dynamics of the aforementioned biointerfacial and intracellular processes, and changes in concentration of photoactive biosensors over time. Literature data suggest that the quenching time q for photoactive luciferase is of the order of the minute at most,23 i.e. several orders of magnitude shorter than the typical time window over which bioluminescence is measured (several hours).18 Accordingly, for
q
t eq 9 simplifies into (SI-3)
f q
T p Hi um t k V k f t c t K (11), where f depends on time according to
r a u,0 r a r a 1 1 2 r a 1 1 1 2 1 1 sinh cosh e e 2 K x t K k t J f t x K K x k k x K x t K t K k . (12)Equations 9-12 reveal that at metal concentrations corresponding to applicability of both the linear Henry biouptake and linear Hill regimes, um t
is proportional to Ju,0 or, equivalently, to the total metal concentration cM regardless the magnitude of the ratio t/q. Relaxing the condition ads 0 assumed for the derivation of eqs 9-12, it can be shown that eqs 9-12 remain applicable after replacement of cp
t therein by cp
t
1ads pc
t
. For cases where concentration of photoactive metal-sensing cells is constant with time, um t
then becomes proportional to the quadratic term cp
1a a H pS K cˆ
, which is in line with experimental data.18 Finally, inspection of eqs 4-6 and 8 allows to state that the conditions identified in this section that lead to a linear dependence of um t
on cM (at any t) are both necessary and sufficient. The non-linearity of eq 9 with respect to the time-dependent concentration of photoactive cell sensors renders impossible any tractable formulation of the ratio between um t
and
p
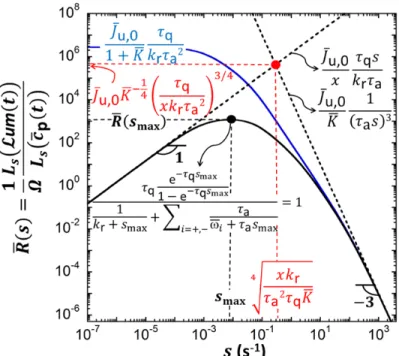
c t . A representation of this ‘bioluminescence transfer function’ can be elaborated in the Laplace s-domain where s has frequency dimension (s-1). The reader is referred to SI-4 (Figure S-1, eqs S32,S40) for detailed discussion and physical interpretation of the biosensors response in the Laplace domain.
Impacts of the dynamics of interfacial and intracellular processes operational at the single cell level on bioluminescence. We first tackle situations where passive biosorption of M is insignificant (ads ), 0 where the concentration of photoactive biosensors is independent of time (cp
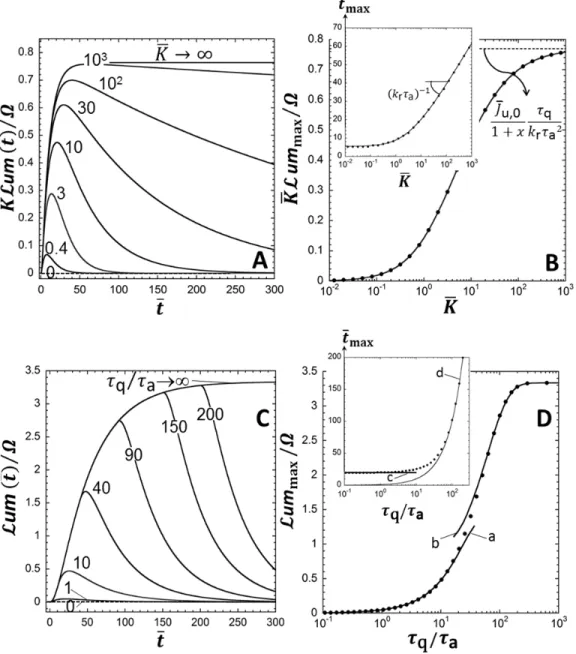
t ) and the metal 1 concentration warrants applicability of the linear Henry biouptake regime and of the linear Hill regime (eqs 9-10).Under such conditions, Figure 2A reports how the dimensionless bioluminescence um
t / is affected by the interplay between kinetics of M excretion and of MPreg complex formation, and by the extent according to which the rate of metal biouptake is determined by M diffusion from the supplying medium to the biosurface. All these factors are subsumed in the dimensionless quantity
1
e a/ 1
xk Bn . For x , luminescence first increases with time, goes through a maximum at 0
max
t t and then decreases to zero with a characteristic time decay that increases upon decreasing x. In other terms, light production by metal-sensing cells lasts over time when metal excretion is extremely slow compared to MPreg complex formation (ke a ) and/or when metal biouptake becomes severely 1 limited by M diffusion from the bulk solution to the biosurface (Bn1 ), which conforms to intuitive 1 expectation. Both situations refer to performant biosensors for which M efflux is not significant and/or kinetics of M transfer across the cell membrane is fast compared to transport of M from bulk solution to cell surface. In addition, the magnitude of the maximum reached by the dimensionless bioluminescence,
max
um /
, increases with decreasing x (i.e. with increasing biosensors performance) and tends to the
limit Ju,0 q
1K k
r a2 for 1 x (Figure 2B) (details in SI-5, eq S52 therein), where we recall 0 that Ju,0 1 / 1
Bn1
. These findings are in line with the analysis of the bioluminescence transfer function detailed in SI-4 (Figure S-1). The maximum in luminescence is shifted to larger tmax with decreasing x (inset Figure 2B), and it vanishes in the hypothetical limit where there is no metal leakage from intra- to extra-cellular volumes (x , Figure 2A), as further discussed in SI-4. It is also found 0 that tmax
kr a
1ln 1/
x
at x (inset Figure 2B, details in SI-5, eq S47 therein): the slower is 1 luciferase degradation (timescale 1/ k ) compared to MPr reg complex formation (timescale a), the more efficient is the biosensor over time, i.e. the larger are tmax and ummax/. These modulations of the bioluminescence signal with changing the Deborah number 1/ k
r a
are further confirmed in Figure 2C. In the very favorable case where luciferase degradation operates at a timescale that is much larger than a(i.e. 1 / k
r a
), it is found that ummax/ Ju,0 q /
xa (details in SI-5, eq S53) and that bioluminescence thus becomes independent of kr. Luciferase degradation then becomes immaterial within the timescale of luminescence production, a feature that is obviously desired for achieving optimal detection of metallic ions. In this limit, Figure 2D (inset) further specifies that the rate of increase ofmax
t with increasing ln 1/ k
r a
is solely determined by the kinetic and thermodynamic determinants of metal partitioning at the biointerface (i.e. x and K ) and is given by 1/ 1
1
2 K x K (details in
SI-5, eq S48 therein). Similar analysis may be performed for deciphering the increased performance of biosensors with increasing the stability constant K of metal-repressor protein MPreg complex and increasing the quenching time q/ a. The reader is referred to SI-6 (Figure S-2) for details.
The initial slope of the curves displayed in Figures 2A,C and in Figures S-2A,C (SI-6) corresponds to the maximal rate of photons production. If bioluminescence emission is not significantly limited over time by metal excretion and luciferase degradation, this slope (in counts s-2) reads as (details in SI-7, eq S63 therein)
max
a p u,0 0 d um / d / 1 t t t S c KJ K (13), where k k f q T V /KHi (counts s-1 mol-1 m3) is the luminescence yield per mole of MPreg complex over the volume VT. Equation 13 is consistent with the expression of the maximal rate of bioluminescence emission anticipated in our earlier report.18 As an intermediate conclusion, results in Figure 2 and in Figure S-2 show that the shape of the bioluminescence peak is strongly affected by the determinants of metal partitioning at the biosensor/solution interface, by the kinetics of luciferase degradation, by the metal-repressor protein complex stability and by quenching kinetics. The reader is referred to Supporting Information (SI-8, Figure S-3) for further detailed discussion of the biosensors response in situations where non-linear metal biouptake and/or non-linear Hill regimes are operational. In particular, the analysis clarifies how the performance of the bionsensor is further connected to the magnitudes of the Hill cooperativity index n, of the dimensionless Hill stability constant KHi and of the metal bioavailability number Bn .
On the interplay between time-dependent concentration of photoactive metal-sensing cells and bioluminescence. We report in Figure 3 the characteristic dependences of um
t / on time for selected ‘growth’ patterns of active metal-sensing cells generated on the basis of the Gompertz model49 detailed in SI-9 (eqs S64-S66) and commonly adopted to interpret dynamics of microbialpopulation.23,49,50 It is emphasized that eqs 4-6, 8 are valid for any type of time-dependent function
p
c t , whether it underpins decreasing or increasing photoactive cell population following cell growth/death, or changes in cell metabolism resulting from e.g. metal toxicity effects or variation of nutrients bioavailability in the medium. For the sake of demonstration, we focus here on situations where cp
t increases with t according to Gompertz law for cells growth kinetics. Figure 3A shows how the bioluminescence signal is mediated by cp
t in situations where (i) the initial concentration cp
0 of photoactive cells (which represents a fraction of the total cells number) is zero, (ii) the maximum growth rate -as reflected by the derivative dcp
t / dt at the inflexion point of the growth curve- is maintained constant, and (iii) the cell population lag time is changed. The results clearly evidence that the magnitude of the bioluminescence peak corresponding to situations where cp
t is lower than that obtained for 1 the ‘reference’ case cp
t (curve (a) in Figure 3A), its width is larger and its asymmetry is reduced. 1 The bioluminescence peak is further detected within the time window where there is a significant increase of cp
t . Under the here-tested conditions, the peak is shifted to longer times with increasing lag time, while its shape remains preserved. These features are direct consequences of the convolution product involved in the definition of um t
(eqs 9 and 11). When decreasing the maximum cell growth rate while maintaining cp
0 , the magnitude of the bioluminescence peak decreases, the peak width 0 increases noticeably and basically coincides with the time range where dcp
t / dt differs from 0 (Figure 3B). These results illustrate the necessity to properly control the growth features of photoactive cells in order to achieve the desired bioluminescence signal properties (magnitude, symmetry and time of apparition).In Figure 4, biosensors response is evaluated for situations where cp
0 is varied between unity (curve (a)) and 0 (curve (g), inset of Figure 4A). It is found that the bioluminescence response takes the form of two peaks for 0cp
0 , a (high) short-term peak and a (ca. 101 3 smaller) long-term peak (Figure 4A and Figure 4B, respectively), whereas a single peak is detected for the cases cp
0 (the 0 only long-term peak, curve (g)) and cp
0 (the only short-term peak, curve (a)). Under conditions of 1 Figure 4, kinetics of photoative cells growth is much slower than that of the processes pictured in Figure 1C operational at the single cell level. Within the timescale of these processes, cp may then be considered constant with time, and the short-term behavior of the bioluminescence becomes similar to that documented in Figures 2 and S-2. The shape of the short-term peak is thus basically independent of cellsgrowth features and its magnitude increases with cp
0 . Passing some delay, the growth of photoactive cells comes into play and contributes to the bioluminescence in the form of the convolution product between cp
t and a function that mirrors the short-term dynamics of the interfacial and intracellular processes involved in light production (see eqs 10,12). Similarly to Figure 3B, the long-term peak magnitude, width and asymmetry are then impacted by the rate of cell growth. Obviously, the extent of separation between the peaks is tied to the magnitude of the ratio between cell population lag time and characteristic timescale of light production at the individual cell level. For cases where linear Henry metal biouptake and linear Hill regimes apply, where M passive biosorption remains negligible over time and cells growth is not affected by the presence of M, the magnitude of each detected peak varies linearly with the metal concentration in solution. The difference between the magnitudes of the short- and long-term peaks (for cases where both peaks are observed) is connected to the difference between light quenching timescale q and time t of peak apparition. Indeed, the larger is the ratio t/q compared to unity, the smaller becomes the difference between the two terms involved in eq 9 (or equivalently in eq S22, SI-3) and the more pronounced becomes the reduction in long-term bioluminescence signal (the argument holds for given cell growth kinetic features).From the above results, it is anticipated that more than 2 bioluminescence peaks may be detected over time for a dispersion of photoactive metal biosensors whose growth properties differ in terms of lag time, maximum growth rate and/or initial cell concentration. As a first approximation, the response of such complex mixtures of metal-sensing cells may be formulated by
f, q,
, T p, Hi, 1 um M j j j j j j j k t k V f t c t K
(14), which holds under the conditions validating the use of eqs 11-12. The index j introduces a differentiation between the (bio)physical processes schemed in Figure 1C and now applying to the j-th type of cell population featuring the growth properties subsumed in cp, j
t . Calling M the number of such distinct biosensors populations, we infer from Figure 4 and eq 14 that the corresponding bioluminescence response can exhibit between M and 2 M peaks depending on the initial conditions
p,j 0
c .
CONFRONTATION between THEORY and EXPERIMENTS
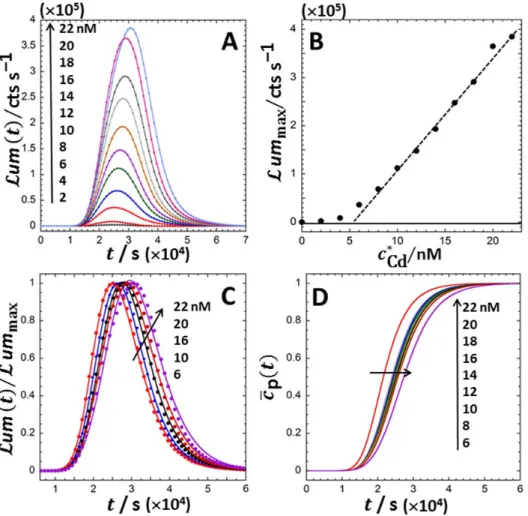
We report in Figure 5A the bioluminescence response measured for a dipersion (VT =100 l) of cadmium-responsive Escherichia coli bioreporters constructed from the Keio knock-out mutant JW3596 (obtained from the Coli Genetic Stock Center, Yale university51) along the lines detailed in our previous
report.18 Briefly, cells were engineered upon introduction of the pZNT-lux plasmid harboring a metal-inducible zntA-luxCDABE gene fusion. Bioluminescence measurements were carried out over ca. 20 hrs in 5 fold-diluted poor-metal complexing nGGM medium (10 mM ionic strength, neutral pH)18 at fixed optical density (OD600nm = 0.2, verified at the start and end of the experiments) for Cd(II) concentrations in the range 0 to 22 nM using a Lumistar Luminometer (BMG LabTechnologies, Germany). In line with the trend displayed in Figure 4 (curve (g)), the bioluminescence response under the here-examined medium conditions exhibits a single long-term peak with a maximum located at a tmax that slightly increases from ca. 2.4104 s to 3.1104 s over the range of tested bulk Cd concentrations (denoted as
Cd
c ) (Figure 5A). The amplitude ummax of the maximum further grows linearly with cCd exceeding the threshold value of 5 nM, which corresponds here to the minimum metal concentration required for induction of the luminescence (Figure 5B). This linearity implies that the bioluminescence expression given by eqs 9-10, derived for the linear Henry metal biouptake regime and linear Hill regime for luciferase production, are those to be considered for testing the validity of our formalism against the experimental data. Further considering that the measurement time t is well above the characteristic timescale reported for luminescence quenching (qca.30 s),23,52 the simplified expressions 11-12 for
um t
are applicable for the situation of interest. It is further verified that eqs 11-12 may be recast in the simple normalized form
p
max max p max
um um f t c t t f t c t (15)
, where f t
is here defined by
a r r a r a 1 1 1 2 a a r a 1 1 2 1 1 sinh / cosh / e e 2 K x t K k t K f t x K x k k K x K x t t k . (16)In practice, (i) the half-life 1/ k of luciferase (which is of the order of 10 minutes or longer depending on r medium conditions)53 is significantly larger than the characteristic timescale
a
(< ca. 1 s)54 for association of intracellular Cd with the regulatory proteins (here ZntR), (ii) the stability constant K is well above unity, which reflects the formation of strong metal-protein complexes, and (iii) the quantity
1
e a/ 1
xk Bn is well below unity (the typical timescale 1 / k for excretion of Cd(II) by E. coli e cells is indeed of the order of hours).36,37 In turn, eq 16 reduces to (SI-10)
r eff 1 eff eff r r e k t k e k t 1 k f t k k (17), where we introduced the overall timescale 1/keff Ka/x for the production of Cd-ZntR complex, which includes the dynamics of Cd biouptake from the solution and the excretion process kinetics (via the dimensionless term x ). In cases where the half-life of luciferase is determined by the overall production kinetics of Cd-ZntR complexes (i.e. 1 /keff 1 /kr), eq 17 further simplifies into
r
r
e k t 1
f t k t . (18)
As detailed in SI-3 (eq S30) and SI-4, the function f t
, proportional to f t , scales with the derivative
of the function g t that formally defines the bioluminescence peak response to a hypothetical cell
concentration pulse. Therefore, f t
may adopt negative values (for k tr before tending to 0 (at 1)r 1)
k t . Equations 15, 17 (or 18 if applicable) are devoid of the unkown constants k, kf or KHi: they therefore provide a way to build a constrained analysis of the experimental data with a reduced number of adjustable parameters. In detail, eqs 15 and 17 (or 18) involve two kinetic constants, keff and kr, and three additional parameters that define the Gompertz time-dependence of the concentration cp
t of photoactive cells (see eq S67 in SI-9 for details). The normalized experimental data um
t / um max are given in Figure 5C for each tested metal concentration cCd (falling within the linear response regime of the biosensors, Figure 5B) together with the corresponding theoretical reconstructions done on the basis of eqs 15, 17 and S67 upon Levenberg-Marquardt adjustment of the 5 aforementioned parameters. It is found that the dependence of the bioluminescence on time measured over the range 6 to 22 nM in Cd concentration is remarkably recovered by theory with 1 /keff 1 /kr 30.07 3 mins (i.e. eq 17 reduces to eq 18) and with the cp
t that are reported in Figure 5D over the tested range of Cd metal concentrations. The observed shifts of the maximum in bioluminescence to larger tmax with increasingCd
c are necessarily independent of the metal biouptake flux Ju,0 (or equivalently of cCd ) as inferred from eqs 11-12. Accordingly, they are recovered from theory upon adjustment of the lag time involved in the Gompertz expression (see Figure 3A) that reflects here the time required for cells to adapt to increase in cCd (Figure 5D). Confrontation between theory and experiments reveals an intimate connection
between kinetics of loss in luciferase activity (1/ k timescale) -whose magnitude very well conforms to r that found in previous studies-53 and the production kinetics (1 / keff timescale) of Cd-regulatory protein complexes that initiate the cascade of events leading to photons emission (Figure 1). Last, under the conditions examined in Figure 5A, the amount of Cd ions passively biosorbed is -at given cCd - constant over time because the total concentration of metal-sorbing cells cp,total (including both photoactive and non-photoactive fractions) is fixed by the optical density, here constant over the whole duration of the experiments. In turn, the bioavailable metal concentration cCd,f is directly inferred from cCd using eq 1 where cp
t should be replaced by cp,total. The applicability of the linear Henry passive biosorption regime (and thus of eq 1) for the system of interest was established in our previous work.18CONCLUSIONS.
A comprehensive formalism is detailed for the evaluation of the bioluminescence produced over time by a dispersion of metal-sensing whole cell bacterial reporters. The theory deciphers quantitatively the non-linear relationships between the amplitude and shape of the bioluminescence signal emitted by the biosensors, the biophysicochemical determinants of metal partitioning dynamics between intra- and extra-cellular volumes, the kinetics of metal-repressor protein complex formation and ensuing activation of reporter gene, the resulting kinetics of luciferase production and rates of light emission and quenching. It is demonstrated that the expression defining the bioluminescence response involves a convolution product between the time-dependent concentration of photoactive metal-sensing cells and a temporal function representing the intricate coupling between metal biouptake dynamics and light production kinetics. Tractable analytical expressions of the bioluminescence are elaborated under practical conditions where biosensor reponse is proportional to the concentration of bioavailable metal ions in solution. The theory is further supported by experimental data collected over ca. 20 hrs on Cd-responsive lux-based E. coli biosensors. This successful confrontation between experiments and theory demonstrates the intricate nature of the bioluminescence signal that results from the convolution product between time dependent functions reflecting the dynamics of multiscale processes from the (reporter) gene level, up to the individual cell and population scales. It further highlights the necessity to distinguish between total cell concentration and concentration of photoactive cells, the ratio of which depends on medium composition and bioavailability of nutrients (recalling that luciferase production requires energy).
It is believed that this study lays the foundations of an original conceptual framework for quantitative and physically-sound exploitation of the dependence of bioluminescence on time, and for evaluation of metal bioavailability and toxicity toward microorganisms in complex natural aqueous samples. Any
metal-induced perturbation of biosensors physiology shall impact on their response, and this can be captured from the current formalism that explicitly integrates variations in photoactive cells concentration with time.
Supporting Information.
Glossary of (main) symbols. (SI-1) Demonstration of eq 3 (a), and defining dimensionless forms of eqs 4-6 and 8 (b). (SI-2) Demonstration of the expression defining the bioluminescence in the Henry metal biouptake regime (i.e. cM,f 1). (SI-3) Demonstration of eqs 9-12. (SI-4) Expression for- and analysis
of the transfer function between bioluminescence and concentration of photoactive biosensors, and Figure S-1. (SI-5) Evaluation of the maximum reached by the bioluminescence (Figures 2B, 2D and Figures S-2B and S-2D in SI-6). (SI-6) Analysis of the dependence of bioluminescence on the stability constant K of metal-repressor protein MPreg complex and on the quenching time q/ a, and Figure S-2. (SI-7) Demonstration of eq 13. (SI-8) Analysis of the dependence of bioluminescence on time under conditions where non-linear metal biouptake and/or non-linear Hill regimes are operational, and Figure S-3. (SI-9) Gompertz expression for cell growth kinetics. (SI-10) Demonstration of eq 17.
References.
1. Wei, Q.; Nagi, R.; Sadeghi, K; Feng, S; Yan, E.; Ki, S. J.; Caire, R.; Tseng, D and Ozcan A. Detection and spatial mapping of mercury contamination in water samples using a smart-phone. ACS Nano 2014, 8, 1121-1129.
2. Gabarrón, M.; Zornoza, R.; Martínez-Martínez, S.; Muñoz V. A.; Faz, Á. and Acosta, J. A. Effect of land use and soil properties in the feasibility of two sequential extraction procedures for metals fractionation. Chemosphere 2018, 218, 266-272.
3. Van Leeuwen, H. P.; Town, R. M.; Buffle, J.; Cleven, R. F. M. J.; Davison, W.; Puy, J.; van Riemsdijk, W. H. and Sigg, L. Dynamic speciation analysis and bioavailability of metals in aquatic systems. Environ. Sci. Technol. 2005, 39, 8545-8556.
4. Duval, J. F. L.; Paquet, N.; Lavoie, M. and Fortin, C. Dynamics of metal partitioning at the cell-solution interface: Implications for toxicity assessment under growth inhibition conditions. Environ. Sci. Technol. 2015, 49, 6625-6636.
5. Magalhaes, D.; da Costa Marques, M. R.; Baptista, B. and Buss, D. F. Metal bioavailability and toxicity in freshwaters. Environ. Chem. Lett. 2015, 13, 69-87.
6. Angle, J. S.; Chaney, R. L. and Rhee, D. Bacterial resistance to heavy metals related to extractable and total metal concentrations in soil and media. Soil Biol. Biochem.1993, 25, 1443-1446.
7. van der Meer, J. R. and Belkin, S. Where microbiology meets microengineering: design and applications of reporter bacteria. Nat. Rev. Microbiol. 2010, 8, 511-522.
8. Saltepe, B.; Kehribar, E.S. ; Yirmibeşoğlu, S. S. S. and Şeker, U. Ö. Ş. Cellular biosensors with engineered genetic circuits. ACS Sens. 2018, 3, 13-26.
9. Grattieri, M and Minteer, S. D. Self-powered biosensors. ACS Sens. 2018, 3, 44-53.
10. Gui, Q.; Lawson, T.; Shan, S.; Yan, L.; Liu, Y. The application of whole cell-based biosensors for use in environmental analysis and in medical diagnostics. Sensors 2017, 17, 1623-1639.
11. De Mora, K.; Joshi, N.; Balint, B. L.; Ward, F. B.; Elfick, A. and French, C. E. A pH-based biosensor for detection of arsenic in drinking water. Anal. Bioanal. Chem. 2011, 400, 1031-1039.
12. Stocker, J.; Balluch, D.; Gsell, M.; Harms, H.; Feliciano, J.; Daunert, S.; Malik, K. A. and van der Meer, J. R. Development of a set of simple bacterial biosensors for quantitative and rapid measurements of arsenite and arsenate in potable water. Environ. Sci. Technol. 2003, 37, 4743-4750
13. Cortés-Salazar, F.; Beggah, S.; van der Meer, J. R. and Girault H. H. Electrochemical As(III) whole-cell based biochip sensor. Biosens. Bioelectron. 2013, 47, 237-242.
14. Tauriainen, S.; Karp, M.; Chang, W.; Virta, M. Luminescent bacterial sensor for cadmium and lead. Biosens. Bioelectron. 1998, 13, 931-938.
15. Corbisier, P.; Van der Lelie, D.; Borremans, B.; Provoost, A.; Delorenzo, V.; Brown, N. L.; Lloyd, J. R.; Hobman, J. L.; Csoregi, E.; Johansson, B. and Mattiason, B. Whole cell and protein based biosensors for the detection of biovailable heavy metal in environmental samples. Anal. Chim. Acta 1999, 387, 235-244.
16. Biran, I; Babai, R.; Levcov, K.; Rishpon, J. and Ron, E. Z. Online and in situ monitoring of environmental pollutants: electrochemical biosensing of cadmium. Environ. Microbiol. 2000, 2, 285-290. 17. Jouanneau, S.; Durand, M. J.; Courcoux, P.; Blusseau, T. and Thouand, G. Improvement of the identification of four heavy metals in environmental samples by using predictive decision tree models coupled with a set of five bioluminescent bacteria. Environ. Sci. Technol. 2011, 45, 2925-2931.
18. Pagnout, C.; Present, R. M.; Billard, P.; Rotureau, E. and Duval, J. F. L. What do luminescent bacterial metal-sensors probe? Insights from confrontation between experiments and flux-based theory. Sensors and Actuators B: Chemical 2018, 270, 482-491.
19. Van Leeuwen, H. P.; Duval, J. F. L.; Pinheiro, J. P.; Blust, R. and Town, R. M. Chemodynamics and bioavailability of metal ion complexes with nanoparticles in aqueous media. Environ. Sci. Nano. 2017, 4, 2108-2133.
20. Duval, J. F. L.; Town, R. M. and van Leeuwen, H. P. Lability of nanoparticulate metal complexes at a macroscopic metal responsive (bio)interface: expression and asymptotic scaling laws. J. Phys. Chem. C 2018, 122, 6052-6065.
21. Leonard, E.M.; Marentette, J. R.; Balshine, S. and Wood, C.M. Critical body residues, Michaelis-Menten analysis of bioaccumulation, lethality and behaviour as endpoints of waterborne Ni toxicity in two teleosts. Ecotoxicology 2014, 23,147-62.
22. Duval, J. F. L. and Rotureau, E. Dynamics of metal uptake by charged soft biointerphases: impacts of depletion, internalisation, adsorption and excretion. Phys. Chem. Chem. Phys. 2014, 16, 7401-7416. 23. Delle Side, D. ; Nassisi, V. ; Pennetta, C. ; Alifano, P.; Di Salvo, M.; Talà, A.; Chechkin, A.; Seno, F. and Trovato, A. Bacterial bioluminescence onset and quenching: a dynamical model for a quorum sensing-mediated property. R. Soc .Open Sci. 2017, 4, 171586. DOI: 10.1098/rsos.171586.
24. Kelly, C. J. ; Hsiung, C.-J. and Lajoie, C. A. Kinetic analysis of bacterial bioluminescence. Biotechnol. Bioeng. 2003, 81, 370-378.
25. Ang, J.; Harris, E.; Hussey, B. J.; Kil, R. and McMillen, D. R. Tuning response curves for synthetic biology. ACS Synth. Biol. 2013, 2, 547-567.
26. Harms, H.; Wells, M. C. and van der Meer, J. C. Whole-cell living biosensors: are they ready for environmental application? Appl. Microbio. Biotechnol. 2006, 70, 273-280.
27. Rogers K. R. and Gerlach, C. L. Peer Reviewed: Update on Environmental Biosensors. Scientific understanding and technological development are advancing, but commercialization, with a few exceptions, has been slow. Environ. Sci. Technol. 1999, 33, 500A-506A.
28. Austin, C. M.; Stoy, W.; Su, P., Harber, M. C.; Bardill, J. P.; Hammer, B. K. and Forest, C. R. Modeling and validation of autoinducer-mediated bacterial gene expression in microfluidic environments. Biomicrofluidics. 2014, 8, 034116. DOI: 10.1063/1.4884519.
29. Leveau, J. H. and Lindow, S. E. Predictive and interpretive simulation of green fluorescent protein expression in reporter bacteria. J. Bacteriol. 2001, 183, 6752-6762.
30. de Jong, H.; Ranquet, C.; Ropers, D.; Pinel, C. and Geiselmann, J. Experimental and computational validation of models of fluorescent and luminescent reporter genes in bacteria. BMC Systems Biology 2010, 4, 55-71.
31. Iqbal, M.; Doherty, N.; Page, A. M. L.; Qazi, S. N. A.; Ajmera, I.; Lund, P. A.; Kypraios, T.; Scott, D. J.; Hill, P. J. and Stekel, D. J. Reconstructing promoter activity from Lux bioluminescent reporters. PLoS Comput Biol. 2017, 13, e1005731. DOI: 10.1371/journal.pcbi.1005731.
32. Welham, P. A. and Stekel, D. J. Mathematical model of the Lux luminescence system in the terrestrial bacterium Photorhabdus luminescens. Mol. Biosyst. 2009, 5, 68-76.
33. Paquet, N.; Lavoie, M.; Maloney, F.; Duval, J. F. L.; Campbell, P.G.C. and Fortin, C. Cadmium accumulation and toxicity in the unicellular alga Pseudokirchneriella subcapitata: influence of metal-binding exudates and exposure time. Environ. Toxicol. Chem. 2015, 34, 1524-1532.
34. Duval, J. F. L. Dynamics of metal uptake by charged biointerphases: bioavailability and bulk depletion. Phys. Chem. Chem. Phys. 2013, 15, 7873-7888.
35. Duval, J. F. L. and Gaboriaud, F. Progress in electrohydrodynamics of soft microbial particle interphases. Curr. Opin. Colloid Interface Sci. 2010, 15, 184-195.
36. Rotureau, E.; Billard, P. and Duval, J. F. L. Evaluation of metal biouptake from the analysis of bulk metal depletion kinetics at various cell concentrations: theory and application. Environ. Sci. Technol. 2015, 49, 990-998.
37. Present, R. M.; Rotureau, E.; Billard, P.; Pagnout, C.; Sohm, B.; Flayac, J.; Gley, R.; Pinheiro, J. P. and Duval, J. F. L. Impact of intracellular metallothionein on metal biouptake and partitioning dynamics at bacterial interfaces. Phys. Chem. Chem. Phys. 2017, 19, 29114-29124.
38. Outten, C. E.; Outten, F. W. and O’Halloran, T. V. DNA distortion mechanism for transcriptional activation by ZntR, a Zn(II)-responsive MerR homologue in Escherichia coli, J. Biol. Chem. 1999, 274, 37517-37524.
39. Frackman, S.; Anhalt, M. and Nealson, K. H. Cloning, organization, and expression of the bioluminescence genes of Xenorhabdus luminescens. J. Bacteriol. 1990, 172, 5767-5773.
40. Hajdu R.; Pinheiro, J. P.; Galceran, J. and Slaveykova, V. I. Modeling of Cd uptake and efflux kinetics in metal-resistant bacterium Cupriavidus metallidurans. Environ. Sci. Technol. 2010, 44, 4597-4602.
41. Duval, J. F. L. and Ohshima, H. Electrophoresis of diffuse soft particles. Langmuir 2006, 22, 3533-3546.
42. Michaelis, L. and Menten, M. M. The kinetics of invertin action. 1913. FEBS Lett. 2013, 587, 2712-2720.
43. H. P. van Leeuwen. Metal speciation dynamics and bioavailability: inert and labile complexes Environ. Sci. Technol. 1999, 33, 3743-3748.
44. Duval, J. F. L. and van Leeuwen, H. P. Rates of ionic reactions with charged nanoparticles in aqueous media. J. Phys. Chem. A 2012, 116, 6443-6451.
45. Slaveykova, V. I. and Wilkinson, K. J. Predicting the bioavailability of metals and metal complexes: critical review of the Biotic Ligand Model. Environ. Chem. 2005, 2, 9-24.
46. Jeffreys, H. and Jeffreys, B. S. The Adams-Bashforth Method. §9.11 in Methods of Mathematical Physics, 3rd ed. Cambridge, England: Cambridge University Press, pp. 292-293, 1988.
47. Ascher, U. M. and Petzold, L. R. Computer Methods for Ordinary Differential Equations and Differential-Algebraic Equations, SIAM, Philadelphia, ISBN 0-89871-412-5, 1998.
48. Long, T.; Tu, K.; Wang, Y.; Mehta, P.; Ong, N.; Bassler, B. and Wingreen, N. Quantifying the integration of quorum-sensing signals with single-cell resolution. PLOS Biol. 2009, 7, 1-10.
49. Tjorve, K. M. C and Tjorve, E. The use of Gompertz models in growth analyses, and new Gompertz-model approach: an addition to the unified-Richards family. PLOS One 2017, 12, e0178691. DOI: 10.1371/journal.pone.0178691.
50. Peleg, M. and Corradini, M. G. Microbial growth curves: what the models tell us and what they cannot. Crit. Rev. Food Sci. Nutr. 2011, 51, 917-945.